


 |
SRP520S - STATISTICS FOR REGIONAL PLANNERS - 2ND OPP - JAN 2025 |
|
|
1 Page 1 |
▲back to top |
nAmlBIA unlVERSITY
OF SCIEnCE Ano TECHnDLOGY
FACULTY OF ENGINEERING AND THE BUILT ENVIRONMENT
DEPARTMENTOF ARCHITECTUREP, LANNINGAND CONSTRUCTION
QUALIFICATION:BACHELOR OF REGIONAL AND RURAL DEVELOPMENT
QUALIFICATIONCODE:07BRAR
NQF LEVEL:5
COURSECODE:SRP520S
COURSENAME: STATISTICSFOR REGIONAL
PLANNERS
DATE: JANUARY 2025
PAPER: THEORY
DURATION: 3 HOURS
MARKS: 100
SUPPLEMENTARY/SECONDOPPORTUNITYEXAMINATION QUESTION PAPER
Ms. Toini Angula
EXAMINER(S) Ms. Jennille Kohima
Dr. Eric Yankson
MODERATOR Mr. J Korrubel
INSTRUCTIONS:
1. Answer ALLthe questions.
2. Read all the questions carefully before answering.
3. Number the answers clearly and legibly.
4. The following materials are permissible during the examination: pen, pencil, ruler,
eraser and calculator.
THIS QUESTION PAPERCONSISTSOF 5 PAGES(Including this front page)
|
|
2 Page 2 |
▲back to top |
Statistics for Regional Planners
SRPS20S
Question 1
State whether the following statements are True or False
a) Categorical variables are often called qualitative.
(1)
b) A variable is called not quantitative when the measurement scale has numerical values. (1)
c) Interval scales have a specific numerical distance or interval between each pair of levels. (1)
d) Discrete variables have a basic unit of measurement that cannot be subdivided.
(1)
e) Observation is not a preplanned research tool which is carried out purposefully to address
research questions and objectives.
f) Interviews is a data collection method where an observer may study the subjective factors
objectively.
(1)
[6]
Question 2
a) Define the term statistics.
(2)
b) What is the difference between descriptive and inferential statistics.
(6)
c) Identify and describe the three scales of measurement.
(8)
d) Identify and explain the methods in which observations can take place?
(6)
e) Describe statistical data
(2)
[24)
Question 3
a) What is a time series analysis?
(2)
b) list three reasons why we need a time series analysis.
(6)
[8]
Question 4
a) (i)
Name the Namibian Institution mandated to produce quality statistics
(1)
(ii)
State the legislative framework that guides them.
(1)
b) list the four main components of quality under the Namibia Quality Assurance Framework
for Statistics.
(4)
[6]
Supplementary/Second Opportunity Examination Question Paper
Page 2 of 5 January 2025
|
|
3 Page 3 |
▲back to top |
Statistics for Regional Planners
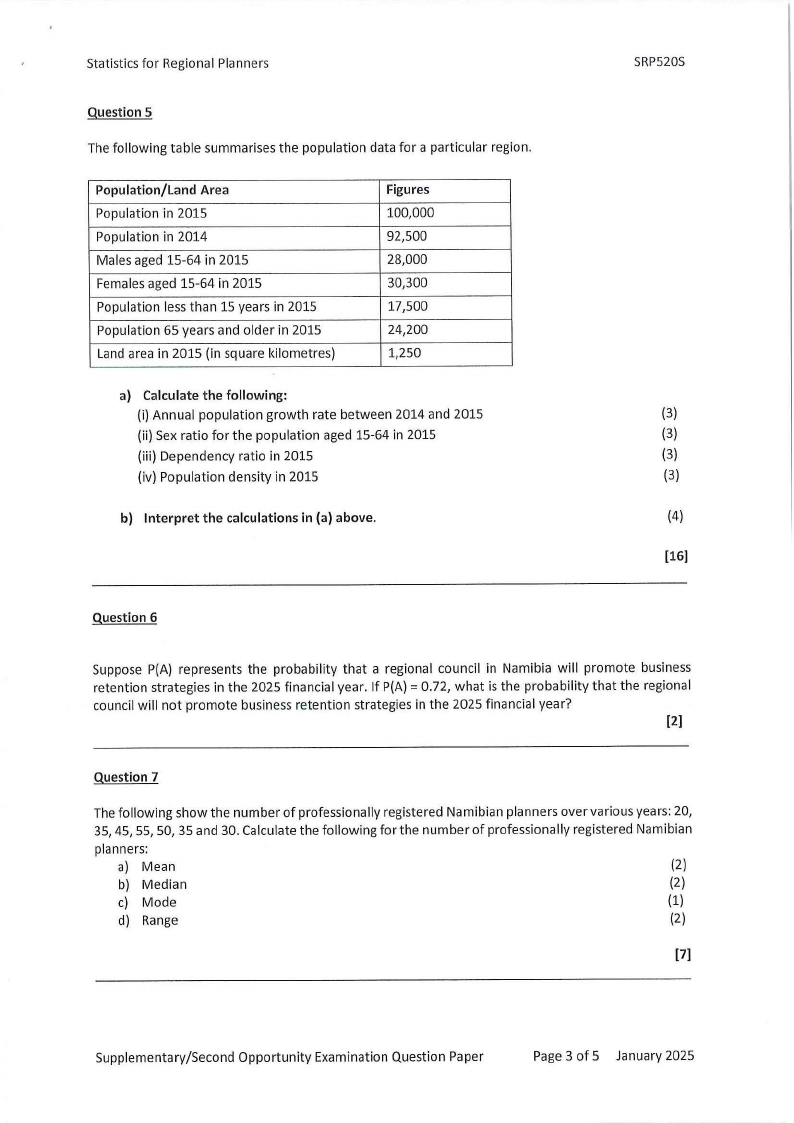
Question 5
The following table summarises the population data for a particular region.
Population/Land Area
Population in 2015
Population in 2014
Males aged 15-64 in 2015
Femalesaged 15-64 in 2015
Population less than 15 years in 2015
Population 65 years and older in 2015
Land area in 2015 (in square kilometres)
Figures
100,000
92,500
28,000
30,300
17,500
24,200
1,250
a) Calculate the following:
(i) Annual population growth rate between 2014 and 2015
(ii) Sex ratio for the population aged 15-64 in 2015
(iii) Dependency ratio in 2015
(iv) Population density in 2015
b) Interpret the calculations in (a) above.
SRP520S
(3)
(3)
(3)
(3)
(4)
[16)
Question 6
Suppose P(A) represents the probability that a regional council in Namibia will promote business
retention strategies in the 2025 financial year. If P(A) = 0.72, what is the probability that the regional
council will not promote business retention strategies in the 2025 financial year?
[2]
Question 7
The following show the number of professionally registered Namibian planners over various years: 20,
35, 45, 55, 50, 35 and 30. Calculate the following for the number of professionally registered Namibian
planners:
a) Mean
(2)
b) Median
(2)
c) Mode
(1)
d) Range
(2)
[7)
Supplementary/Second Opportunity Examination Question Paper
Page 3 of 5 January 2025
|
|
4 Page 4 |
▲back to top |
Statistics for Regional Planners
SRP520S
Question 8
A survey estimates that the probability of planners promote community development is 0.55. Of the
planners who promote community development, 75% also advocate the importance of regional
planning. What is the probability that a randomly selected planner believes in both community
development and regional planning?
(2)
Question 9
Let X represent the number of times a local authority has engaged in participatory planning recently.
Assuming that the probability distribution of Xis approximately: P(0) =0.15, P(l) =0.30, P(2) =0.20,
P(3) =0.10 and P(4) =0.25.
a) Is X a discrete or a continuous variable? Please explain briefly.
(2)
b) Construct a table showing the probability distribution.
(4)
c) Find the mean of the probability distribution.
(3)
(9)
Question 10
As a regional planner, you have the task of sampling from the 40,000 residents in a region to find out
the percentage of inhabitants who believe the regional council should invest more in community
development. Explain how you would proceed if you want a systematic random sample of 200
residents.
(2)
Question 11
The weights of a sample offive spatial planners are as follows: 100, 120, 90, 80 and 105. Calculate
the following for the weights:
a) Mean
(3)
b) Sample variance
(4)
c) Sample standard deviation
(3)
(10]
Supplementary/Second Opportunity Examination Question Paper
Page 4 of 5 January 2025
|
|
5 Page 5 |
▲back to top |
..
Statistics for Regional Planners
SRP520S
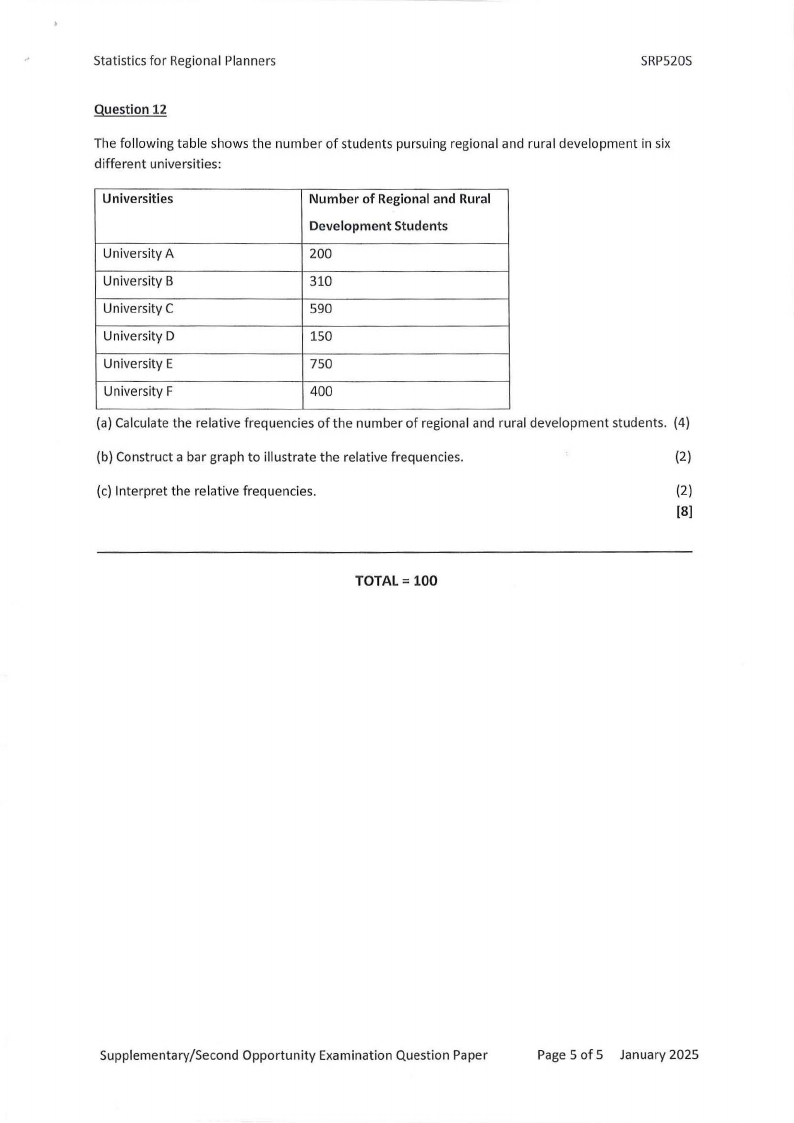
Question 12
The following table shows the number of students pursuing regional and rural development in six
different universities:
Universities
University A
University B
University C
University D
University E
University F
Number of Regional and Rural
Development Students
200
310
590
150
750
400
(a) Calculate the relative frequencies of the number of regional and rural development students. (4)
(b) Construct a bar graph to illustrate the relative frequencies.
(2)
(c) Interpret the relative frequencies.
(2)
[8)
TOTAL= 100
Supplementary/Second Opportunity Examination Question Paper
Page 5 of 5 January 2025