RMC811S-RESEARCH METHODS FOR NATIRAL SCIENCES JUNE QP 2024


RMC811S-RESEARCH METHODS FOR NATIRAL SCIENCES JUNE QP 2024


1 Page 1

▲back to top


nAmlBIA unlVERSITY
OF SCIEnCE Ano TECHnOLOGY
FACULTYOF HEALTH,NATURAL RESOURCESAND APPLIEDSCIENCES
DEPARTMENT OF NATURAL RESOURCES SCIENCES
QUALIFICATION: BACHELOR OF NATURAL RESOURCES MANAGEMENT HONOURS
QUALIFICATION CODE: 08BNRH
COURSE CODE: RMC811S
LEVEL: 8
COURSE NAME: RESEARCHMETHODS FOR NATURAL
SCIENCES
DATE: JUNE 2024
DURATION: 3 HOURS
MARKS: 150
FIRSTOPPORTUNITY EXAMINATION QUESTION PAPER
EXAMINER(S) Dr Tendai Nzuma (Section A: Scientific Writing)
Dr Meed Mbidzo (Section B: Statistics)
MODERATOR: Prof M. Mwale
INSTRUCTIONS
1. Answer ALL the questions.
2. Write clearly and neatly.
3. Number the answers clearly.
PERMISSIBLEMATERIALS
1. Examination question paper
2. Answering book
3. Calculator
THIS QUESTION PAPER CONSISTS OF 9 PAGES (Excluding this front page)

2 Page 2

▲back to top


SECTIONA: SCIENTIFICWRITING
(SO]
QUESTION 1
Define the term "paraphrasing plagiarism" and explain how it can be avoided in academic writing.
(10)
Provide an example to illustrate your point.
QUESTION 2
Given a graph depicting the population trends of various bird species in an urban area over a decade (10)
(graph shown below), analyse the impact of urban development on biodiversity. Discuss all three
species showing different trends and suggest possible ecological or urban developmental reasons for
these trends.
Decadal Population Trends of Urban Birds in Namibia
-~ --_- 1400
1200
1000
.........·.·..····•··••......._......._.._..._._.........._._.._..-
.. _._ -.- -.
Jt:- -~
...........
..
800
It:- -Jt:-
-
....................
........... . . ... •··
600
400
200
0 +----r----.----r----r-----.----,---~-----.---,,----,------,
2013 2014 2015 2016 2017
2018
2019
2020
2021
•••• ••• HouseSparrow ___. - RockPigeon _..,_ African Hoopoe
2022
2023
QUESTION 3
Explain how audience analysis can influence the technicality and language of scientific documents.
(10)
Provide examples of how you would adjust a document when addressing different audiences.
QUESTION4
Design a short research proposal that evaluates the role of wetland restoration as a strategy for
(20)
adapting to climate change and improving water security in arid areas. In your proposal, include the
following components:
1. Introduction: Clearly define the problem statement and outline the objectives of your study.
2. Methodology: Describe the methods you will use to conduct your research.
3. Expected Outcomes: Discuss the potential results and implications of your study.
Ensure each section is detailed and specific to the focus of your research.

3 Page 3

▲back to top


SECTIONB: STATISTICS
QUESTION 5
What statistical procedure would you use for the following research questions and/or scenarios?
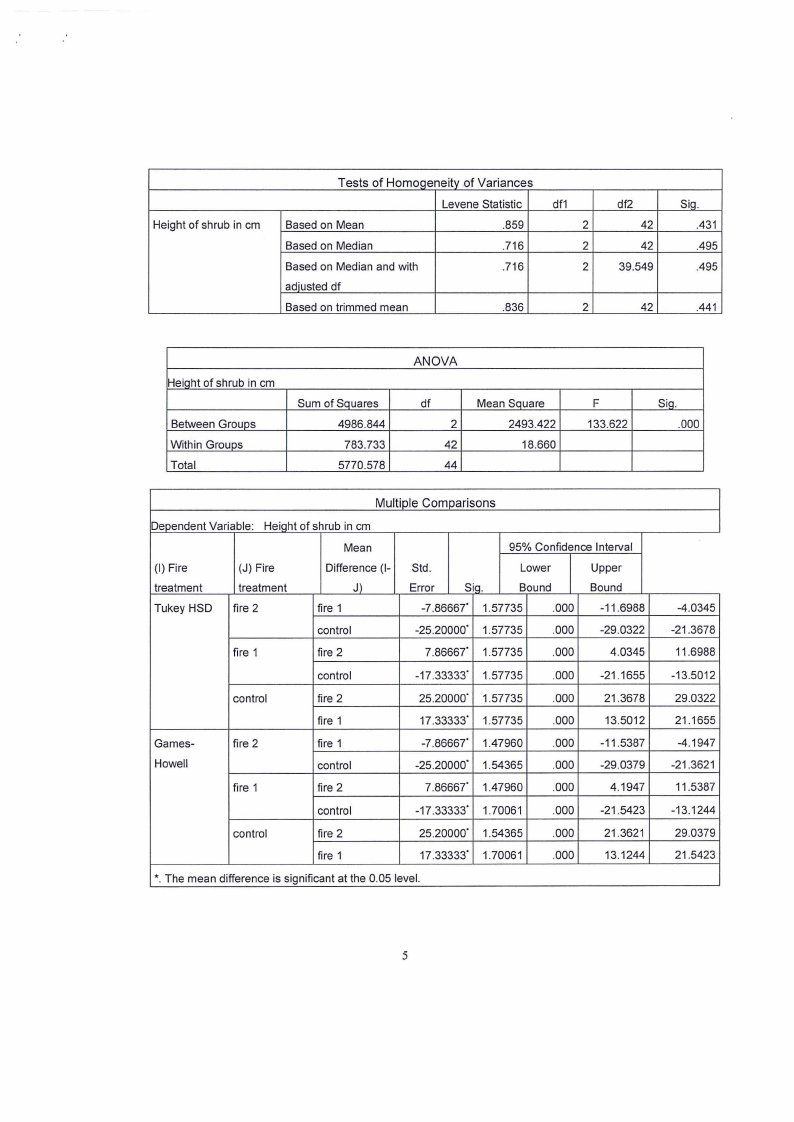
a) A researcher is studying the effect of a new fertilizer on plant growth. They have three groups
of plants: one with no fertilizer, one with the standard fertilizer, and one with the new
fertilizer. What statistical test should be used to compare the average growth rates among
these groups?
[100]
[11]
(2)
b) An ecologist wants to determine if there is a relationship between the number of predators
(2)
and the size of prey populations in a closed ecosystem. Which statistical test is most
appropriate?
c) A biologist records the mating calls of frogs before and after the introduction of a noise
(2)
pollution source near their habitat. What statistical test should be used to compare the
frequency of calls before and after the pollution?
d) It is generally believed that males tend to be taller than females. However, you do not believe (2)
that this hypothesis holds for the NRM honours class of 2024 at NUST. So, you take a sample
of the heights of 20 male students and 30 female students. You want to test if there is a
difference in height between male and female students. Note: You find that the heights for
both males and female were not normally distributed and that there were significant outliers
in the data.
e) A researcher is studying the salinity tolerance of three different coastal plant species by
(3)
measuring their growth rates under the same controlled salinity conditions. The growth data
are non-normally distributed because of high variability among samples. What test should be
used to compare the growth rates across the three plant species, and why is this test
appropriate?
QUESTION 6
A vet wants to test a new drug that improves running performance in cheetah. The researcher would [15]
like to know whether this new drug leads to a difference in performance compared to the old drug. To
do this, the vet sampled a group of cheetahs in captivity who each performed two trials in which they
had to run as far as possible in 3 minutes. In one of the trials, they got a shot ofthe old drug and in the
other trial they got a shot of the new drug. The distance they ran in both trials was recorded. determine
whether the new drug improves performance compared to the old drug.
a) What statistical procedure or test would you use to determine whether the new drug improves (2)
running performance compared to the old drug?
b) What are the two main data assumptions of the statistical procedure/test mentioned in (a)?
(4)
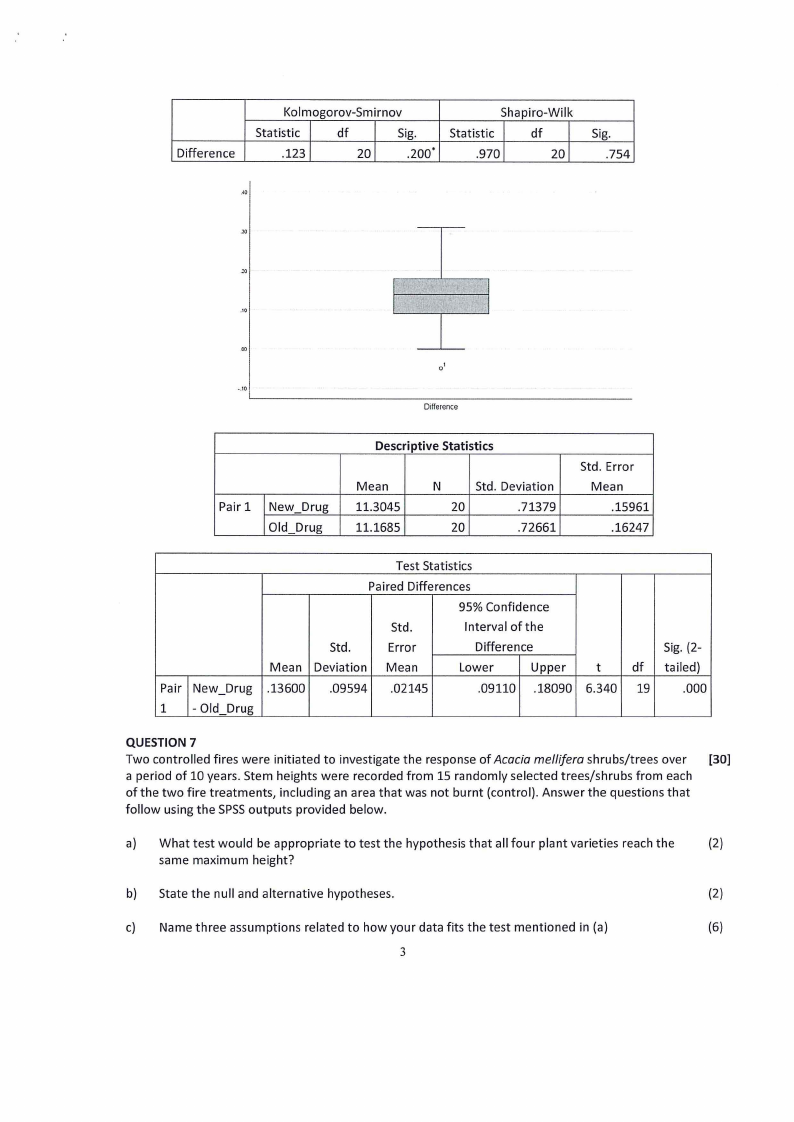
c) Based on the SPSSoutput (tables and graphs) provided below, has the two data assumptions in (4)
(b) been met or violated? Explain in detail.
d) Using the two tables below, report on the descriptive statistics and fully explain whether the
(5)
new drug improves running performance of cheetah.
2

4 Page 4

▲back to top


Difference
Kolmogorov-Sm irnov
Statistic
df
Sig.
.123
20
.200·
Shapiro-Wilk
Statistic
df
.970
20
Sig.
.754
10
.10
00
a'
-.10
Difference
Pair 1 New Drug
Old Drug
Descriptive Statistics
Mean
11.3045
11.1685
N
Std. Deviation
20
.71379
20
.72661
Std. Error
Mean
.15961
.16247
Pair New_Drug
1 - Old Drug
Test Statistics
Paired Differences
95% Confidence
Std.
Interval of the
Std.
Error
Difference
Mean Deviation Mean
Lower
Upper
.13600 .09594 .02145
.09110 .18090
t
6.340
Sig. (2-
df tailed)
19
.000
QUESTION 7
Two controlled fires were initiated to investigate the response of Acacia mellifera shrubs/trees over [30]
a period of 10 years. Stem heights were recorded from 15 randomly selected trees/shrubs from each
of the two fire treatments, including an area that was not burnt (control). Answer the questions that
follow using the SPSSoutputs provided below.
a) What test would be appropriate to test the hypothesis that all four plant varieties reach the
(2)
same maximum height?
b) State the null and alternative hypotheses.
(2)
c) Name three assumptions related to how your data fits the test mentioned in (a)
(6)
3

5 Page 5

▲back to top


d) State whether the three assumptions mentioned in (c) are met or not (provide evidence for
(9)
your answers).
e) Report on the descriptive statistics of the plant heights for the different plant varieties.
(4)
f) Determine whether the four plant varieties reach the same maximum height?
(4)
g) If there is a statistically significant difference in plant heights of the four varieties, explain
(3)
where the difference lies by providing evidence.
Fire treatment
Kolmoqorov-Smirnov•
I Statistic
df
Siq_
Height of shrub in cm fire 2
.122
fire 1
.111
control
.116
Shapiro-Wilk
Statistic
df
15
.200·
15
.200°
15
.200"
Siq.
.973
.973
.977
100.00
90.00
Eu
80.00
.0
2
J::
'"o'
.,E 70.00
.E>
I
60.00
$
$
50.00
fire 2
fire 1
Fire treatment
control
Descriptives
Height of shrub in cm
95% Confidence Interval for
Mean
fire 2
N
Mean Std. Deviation Std. Error Lower Bound Uooer Bound Minimum Maximum
15 63.8000
3.54965 .91652
61.8343
65.7657
58.00
71.00
fire 1
15 71.6667
4.49868 1.16155
69.1754
74.1580
63.00
79.00
control
Total
15 89.0000
45 74.8222
4.81070 1.24212
11.45205 1.70717
86.3359
71.3816
91.6641
78.2628
81.00
58.00
98.00
98.00
4

6 Page 6

▲back to top


Height of shrub in cm
Tests of Homoaeneitv of Variances
Levene Statistic
Based on Mean
.859
Based on Median
.716
Based on Median and with
.716
adjusted df
Based on trimmed mean
.836
df1
2
2
2
2
df2
42
42
39.549
42
Sia.
.431
.495
.495
.441
Heiaht of shrub in cm
Between Groups
Within Groups
Total
Sum of Sauares
4986.844
783.733
5770.578
ANOVA
df
2
42
44
Mean Sauare
2493.422
18.660
F
133.622
Sia.
.000
Multiole Comoarisons
Dependent Variable: Heiaht of shrub in cm
(I) Fire
treatment
Tukey HSD
(J) Fire
treatment
fire 2
Mean
Difference (I-
J)
fire 1
95% Confidence Interval
Std.
Lower
Upper
Error
Sia.
Bound
Bound
-7.8666T 1.57735
.000 -11.6988
control
-25.20000· 1.57735
.000 -29.0322
fire 1
fire 2
7.8666T 1.57735
.000
4.0345
control
-17.33333° 1.57735
.000 -21.1655
control
fire 2
25.20000· 1.57735
.000
21.3678
fire 1
17.33333" 1.57735
.000
13.5012
Games-
Howell
fire 2
fire 1
control
-7.8666T 1.47960
-25.20000· 1.54365
.000 -11.5387
.000 -29.0379
fire 1
fire 2
7.8666T 1.47960
.000
4.1947
control
-17.33333° 1.70061
.000 -21.5423
control
fire 2
25.20000· 1.54365
.000
21.3621
fire 1
17.33333" 1.70061
.000
13.1244
*. The mean difference is significant at the 0.05 level.
-4.0345
-21.3678
11.6988
-13.5012
29.0322
21.1655
-4.1947
-21.3621
11.5387
-13.1244
29.0379
21.5423
5

7 Page 7

▲back to top


QUESTION 8
A researcher is interested in determining whether the effect of education level on conservation
[22]
interest was different for males and females. Use the SPSSoutputs provided to answer the question
that follow.
(a) What statistical test would you use to determine whether the effect of education level on
(2)
interest in conservation is different for males and females (i.e. different depending on gender)?
(b) State whether the assumption of normality in the test mentioned in (a) is met or not.
(4)
(c) Discuss how you would deal with outliers resulting from data entry error.
(2)
(d) State whether the assumption of homogeneity of variances is met or not.
(4)
(e) Explain how profile plots can be used to determine whether an interaction exists between two (5)
independent variables.
(f) Determine whether there is a statistically significant interaction effect between gender and
(5)
education level.
Gender Level of education
Male School
Residual for
conservation
College
Residual for
conservation
University
Residual for
conservation
Female School
Residual for
conservation
College
Residual for
conservation
University
Residual for
conservation
Kolmogorov-
Smirnov•
Statistic df
.143 9
interest
.157 9
interest
.213 10
interest
.112 10
interest
.112 10
interest
.139 10
interest
Sig.
.200·
.200·
.200·
.200·
.200·
.200·
Shapiro-Wilk
Statistic df
.981 9
.957 9
.915 10
.963 10
.963 10
.950 10
Sig.
.971
.761
.320
.819
.819
.668
Conservation interest
Based on Mean
Based on Median
Based on Median and
with adjusted df
Based on trimmed mean
Levene
Statistic
2.269
2.205
2.205
dfl
5
5
5
df2
52
52
27.511
Sig.
.061
.068
.083
2.263
5
52
.062
6

8 Page 8

▲back to top


Tests of Between-Subjects Effects
Dependent Variable: Conservation interest
Source
Corrected Model
Type Ill Sum of
Squares
df
5645.998"
5
Intercept
132091.906
1
gender
8.420
1
education_level
5446.697
2
gender* education_level
210.338
2
Error
747.644
52
Total
140265.750
58
Corrected Total
6393.642
57
a. R Squared= .883 (Adjusted R Squared= .872)
Mean Square
1129.200
132091.906
8.420
2723.348
105.169
14.378
F
78.538
9187.227
.586
189.414
7.315
Sig.
.000
Partial Eta
Squared
.883
.000 .994
.448 .011
.000 .879
.002 .220
QUESTION 9
A biologist investigates the effect of applying different amounts of fertilizer on the biomass of
[22)
grass on a rehabilitation site. Grass seed is sown uniformly over the land. Ten 1 m2 plots are
located randomly and a different mass of fertilizer is applied to each plot. After two months, grass
is harvested from each plot, dried and weighed. Use the SPSSoutputs provided to answer the
question that follow.
a) Describe the general relationship that exists between grass biomass and mass offertilizer.
(2)
Provide evidence for your answer.
b) Did the data meet the assumption of homoscedasticity? Explain your answer.
(4)
c) Did the data meet the assumption of normality? Explain your answer.
(3)
d) Did the data meet the assumption of no significant outliers? Explain your answer.
(2)
e) What proportion of the variance in the response variable is explained by the predictor
(4)
variable? Explain fully.
f) Determine whether the regression model results in a statistically significantly better
(4)
prediction of the dependent variable than if we just used the mean of the dependent
variable. Provide evidence for your explanation.
g) Compute a regression equation using the SPSSoutput provided to predict the grass biomass (5)
at the following fertilizer masses 95, 285 and 300 (g/ m2 )
7

9 Page 9

▲back to top


150
,00
N
...sE
0
0 150
E
..:0a
0
0 100
i5
50
Scatter Plot of Grass biomass (g/m2) by Mass of fertilizer (g/m2)
0
0
0
0
0
0
0
0
0
0
100
150
,00
,so
Mass of fertilizer (g/m2)
Model Summaryb
Std. Error of the
Model R
R Square Adjusted R Square Estimate
1
.960a
.922
.912
18.999
a. Predictors: (Constant), Mass of fertilizer (g/m2)
b. Dependent Variable: Grass biomass (g/m2)
Durbin-Watson
2.380
Scatterplot
Dependent Variable: Grass biomass (glm2)
,,.;
:,
.;
"'
0
0;l:: '
..N
0
,,
C
.!!! 0
CJ)
C
.0;
:l
0
&C): .,
0
0
0
0
-1.5
-1.0
-0.5
0.0
05
10
15
Regression Standardized Predicted Value
8

10 Page 10

▲back to top


Normal P-P Plot of Regression Standardized Residual
Dependent Variable: Grass biomass (g/m2)
1.0
0.8
..0
0
it
uE:, 0.6
"O
.u.'!,l 0.4
0
C.
wX
0.2
o.o~------------
0.0
0.2
0.4
0.6
0.8
Observed Cum Prob
IANOVA"
Model
Sum of Squares df
1
Regression 33946.694
1
Residual
2887.806
8
Total
36834.500
9
a. Dependent Variable: Grass biomass (g/m2)
b. Predictors: (Constant), Mass of fertilizer (g/m2)
Mean Square
33946.694
360.976
F
94.041
Sig.
<.0Olb
Coefficients•
Unstandardized
Coefficients
Standardized
Coefficients
Model
B
Std. Error
1
(Constant)
51.933
12.979
Mass of fertilizer .811
.084
(g/m2)
a. Dependent Variable: Grass biomass (g/m2)
Beta
.960
~.001
9.697
pig.
.004
<.001
95.0% Confidence
Interval for B
Lower
Upper
Bound
Bound
22.004
81.863
.618
1.004
9