


 |
FDA621S - FORECASTING AND DATA ANALYSIS - 2ND OPP - JAN 2020 |
|
|
1 Page 1 |
▲back to top |
NAMIBIA UNIVERSITY
OF SCIENCE AND TECHNOLOGY
FACULTY OF MANAGEMENT SCIENCES
DEPARTMENT OF MARKETING AND LOGISTICS
QUALIFICATION: BACHELOR OF LOGISTICS AND SUPPLY CHAIN MANAGEMENT
QUALIFICATION CODE: O7BLSC
COURSE CODE: FDA621S
SESSION: JANUARY 2020
DURATION: 3 HOURS
LEVEL: 6
COURSE NAME: FORECASTING AND DATA ANALYSIS
PAPER: THEORY
MARKS: 100
SECOND OPPORTUNITY EXAMINATION QUESTION PAPER
EXAMINER(S) | Ms. Emilia Salomo
Mr. Daniel Kandjimi
(FT & Dl)
(PT)
MODERATOR: | Ms. Gloria Tshoopara
INSTRUCTIONS
1. Answer ALL 4 questions in all sections
Read each question carefully
Write as legible and precise as possible
Indicate your class lecturer’s name on your answer sheet
THIS EXAMINATION QUESTION PAPER CONSISTS OF 4 PAGES (Including this front page)
|
|
2 Page 2 |
▲back to top |
QUESTION 1:
[20 MARKS]
1.1 With the use of practical examples explain the below forecasting concepts in your own words?
[20 marks]
a) Naive forecast
b) Weighted moving average
c) Delphi method
d) Demand management
e) Panel consensus
QUESTION 2
[10 MARKS]
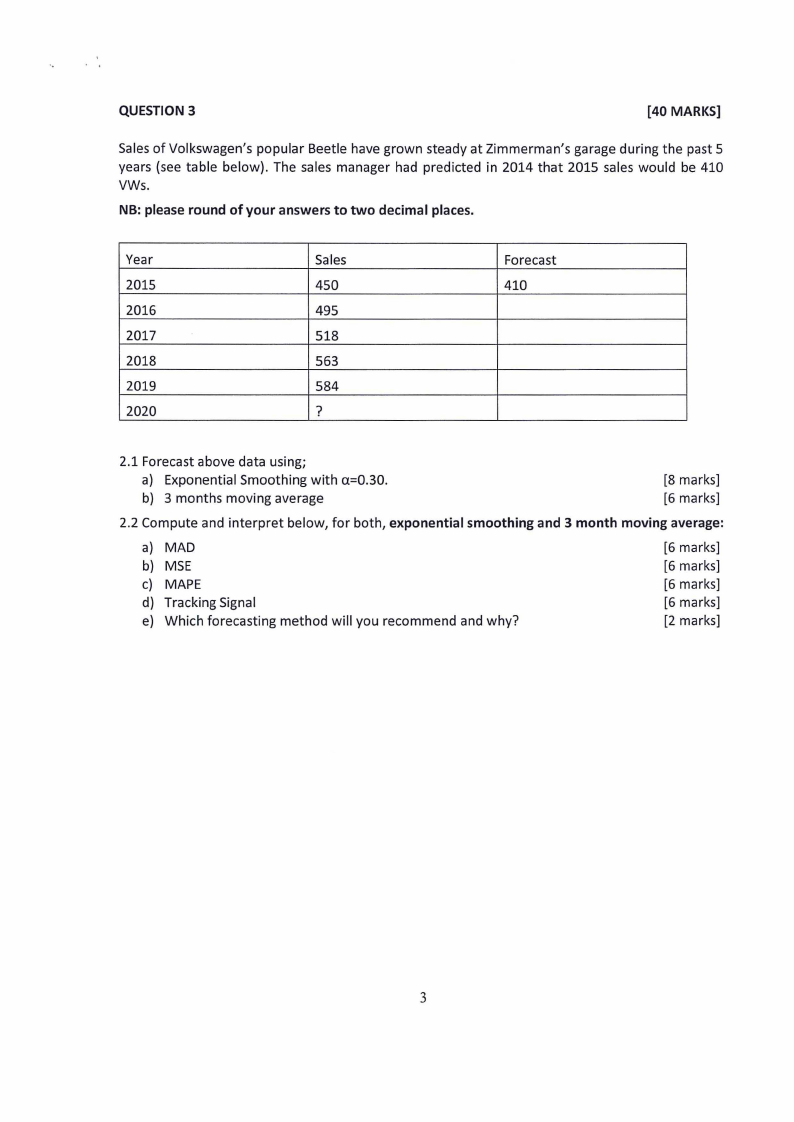
The below graph represent data analysis conducted to determine any correlation between the
selling price of the house and the house sales in respective geographic location.
Graph one shows result for correlation between the house sales for houses located in Klein
Windhoek and the selling price. While graph 2 shows result for correlation between the house sales
for houses located in Katutura and the selling price
Graph 1
Graph 2
(a) What forecasting method was used in the above scenario?
[1 mark]
(b) Interpret the results of each graph
{6 marks]
(c) What is your sales forecast for houses sales in Klein Windhoek when price is on average NS3
million, using below data?
[3 marks]
The Estate Agent provided you with below information;
Windhoek Price (X, in millions of dollars) is related to Sales (Y, in hundreds of thousands of
Namibian dollars) by the regression equation Y = 8.21 + 0.76 X.
|
|
3 Page 3 |
▲back to top |
QUESTION 3
[40 MARKS]
Sales of Volkswagen’s popular Beetle have grown steady at Zimmerman’s garage during the past 5
years (see table below). The sales manager had predicted in 2014 that 2015 sales would be 410
VWs.
NB: please round of your answers to two decimal places.
Year
Sales
Forecast
2015
450
410
2016
495
2017
518
2018
563
2019
584
2020
?
2.1 Forecast above data using;
a) Exponential Smoothing with a=0.30.
b) 3 months moving average
[8 marks]
[6 marks]
2.2 Compute and interpret below, for both, exponential smoothing and 3 month moving average:
a) MAD
b) MSE
c) MAPE
d) Tracking Signal
e) Which forecasting method will you recommend and why?
[6 marks]
[6 marks]
[6 marks]
[6 marks]
[2 marks]
|
|
4 Page 4 |
▲back to top |
QUESTION 4
[30 MARKS]
Mr. Shilongo has been running a small retail outlet in the northern town of Tsumeb selling Fast
Moving Consumers Goods (FMCGs), his business has experienced a rapid growth over the years and
inventory management has been a growing concern. He has since decided to offer students
internships as demand planners, you are one of the lucky student. You have suggested demand
forecasting as a solution to managing the inventory, however Mr. Shilongo have no clue where to
start however is keen on the idea.
(a) Explain to Mr. Shilongo the importance of Demand forecasting to his business?
[6 marks]
(b) With the practical examples help Mr Shilongo in drafting a detailed systematic forecasting
approach explaining the various steps involved in the forecasting processes.
[20 marks]
(c) What type of forecasting method/s is/are appropriate for Mr. Shilongo’s business? Justify your
answers
[4 marks]
GRAND TOTAL: 100 MARKS