


 |
GRS811S - GIS and REMORE SENSING IN PRACTICE - 1st Opp - JUNE 2022 |
|
|
1 Page 1 |
▲back to top |
nAm I BIA un IVERSITY
OF SCIEn CE Ano TECHnOLOGY
FACULTYOF HEALTH,APPLIEDSCIENCESAND NATURALRESOURCES
DEPARTMENTOF AGRICULTUREAND NATURAL RESOURCES
QUALIFICATION: Bachelor of Natural Resource Management Honours
.
QUALIFICATIONCODE: 09MNRM
LEVEL: 8
COURSECODE: GRS811S
COURSENAME: GIS and remote sensing in practice
DATE:June 2022
PAPER: THEORY
DURATION: 3 Hours
MARKS: 100
FIRSTOPPORTUNITY EXAMINATION QUESTION PAPER
EXAMINER(S)
MODERATOR:
Dr Vera De Cauwer
Ms Foibe Nelao Johannes
INSTRUCTIONS
1. Write clearly and neatly.
2. Number your answers clearly.
3. Make sure your student number appears on the answering script.
4. Include the formulas used for each calculation.
PERMISSIBLEMATERIALS
1. Calculator
THIS QUESTION PAPERCONSISTSOF 4 PAGES(Including this front page)
1
|
|
2 Page 2 |
▲back to top |
Question 1
[6]
What are the advantages of vector data versus raster data in a GIS?
Question 2
[12]
Convert the following coordinates to decimal format.
One of the coordinates has an error - indicate which coordinate, whether it is latitude or
longitude, and why it is wrong (do not convert the coordinate with the error).
1. 16° 18.9' S, 20° 54.8' E
2. S 25° 45.1251', E 19 ° 79.2581'
3. 18° 59' 55" s, 23° 4' 22" w
Question 3
[4]
Point A is situated at 19°05' S, 21°30' E and point B at 19°35' S, 21°30' E. What is the
distance in metric units between the two points? Explain (and show your calculations)
Question 4
[10]
Compare the use of a UAV with that of an aeroplane to collect remote sensing data by
describing the differences.
Question 5
[27]
Indicate if the following statements are True or False. If false, correct the statement.
1. Electromagnetic radiation with a long wavelength has a high frequency.
2. Visible light contains more energy than radio waves.
3. A vector line consists of minimum two nodes.
4. Thermal radiation from animals and humans is emitted in the visible light range.
5. Thermal radiation can be carried through a vacuum.
6. Satellite images record the light absorbed by objects.
7. Chlorophyll absorbs green light.
8. A ship can serve as a remote sensing platform.
9. RADARsystems detect electromagnetic radiation with a short wavelength.
10. The Sentinel sensor is operated by the European Space Agency.
11. The distance between two meridians of longitude is a constant (always the same).
12. Coordinates of latitude represent the X-axis for the grid of latitude and longitude lines
covering the world.
13. It is best to use satellite images of the warm, dry season to map vegetation in Namibia.
2
|
|
3 Page 3 |
▲back to top |
14. The SRTM data we used during the practical exercises (small_altitude.asc) represents
terrain elevation collected by a radar system.
15. Vector data can be imported into Google Earth if it is in gpx format.
16. If you want to share your GIS project with others, you only have to give them your
project file in qgz format.
17. It is advised to always use illumination from the southwest to display hill shades on a
map.
Question 6
[S]
In the practical exercises, you have identified and digitized vegetation on aerial photos.
What is the difference with identifying vegetation through image classification?
Question 7
[6]
Why did you learn to work with Terralncognita during the course, considering that you can
also access Google Earth and Bing images directly in QGIS with the QMS plugin? Give an
example of when you would use Terralncognita and how.
Question 8
[10]
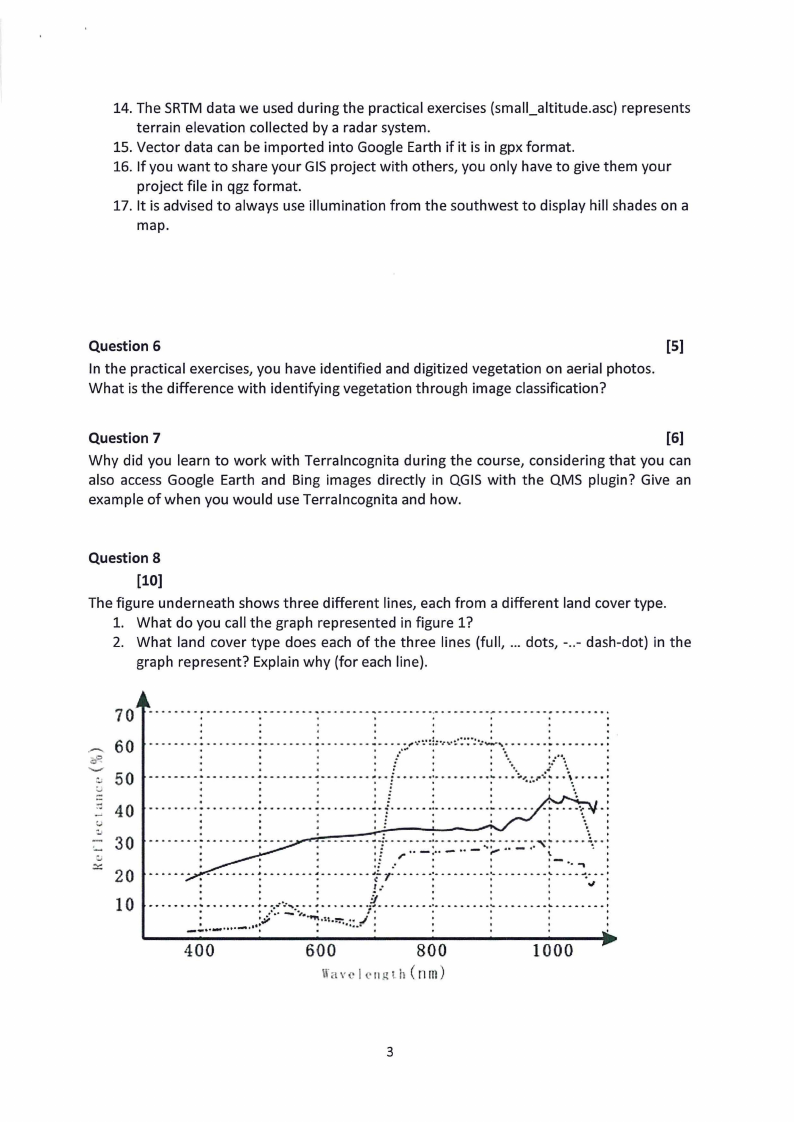
The figure underneath shows three different lines, each from a different land cover type.
1. What do you call the graph represented in figure 1?
2. What land cover type does each of the three lines (full, ... dots, -..- dash-dot) in the
graph represent? Explain why (for each line).
70
---~ 60
-¢o,
- 50
:.J
::
40 :'J
:..,
:.,
._ 30
20
10
- -. ----...- .-... -- - -- .- - - --- -- . - - - - - - - - ..- - - - - - - - -.--- - - - - - - - - - - - ...- -..- ....- .....
.I
I
t
•
I
.t
t
f
.t
I
.t
•
.I
I
--.-----:------------------------~-.!-...-·:.-.......... ·:·· ..- - - - . - ..: .......-- - -- ~-- . -- - ... ;_ ..- -- ..-- ~-· ..:......,.•...·~·:!:.-•.,•:..·:·:·;•:~,·.·.........
-~ .........
..
:
\\.,._._.,..\\-.:.f... :
I
I!
1"
f
t
•
•
I
'"
•
•
............I..............I..............,1.............I...,;•.........................I .............f........... .t
•
I
I
t:
•
I
f.
...
I
: ; : - - : - .. : : :- -. - -- -.....::.-:.. ----.-...--:--·---- ...-... -·.·.:.-..--.--...- .. ......\\._....:.
•
I
:
:f ••,. :
1
t
" "'"\\
:
• • • • • • • ! • • • • • • • • I • • • • _. • • • • • • • • • • • ~e:1..• • • • • • •:•• • • • • • • •:•• • • • • • • • • • • • -:•. • • :
:
:
:
! ...
:
:
:
.J :
"..... "• . ".. "... !t ..:::... ::,.:,:. :• ......... - i~!J.......... ·•:·.......... .;-... - ........ . ... - ......... t:
:
__
.............
..:~
-..
~·''•::";.!!./:
:
:
.
.
"
t
400
600
800
1000
Wa"e I e 11gt h (nm)
3
|
|
4 Page 4 |
▲back to top |
Question 9
[6]
What is a GIS metadata file? Give five types of information that can be stored in such a file.
Question 10
[4]
What is the difference between geographical and projected coordinates?
Question 11
[7]
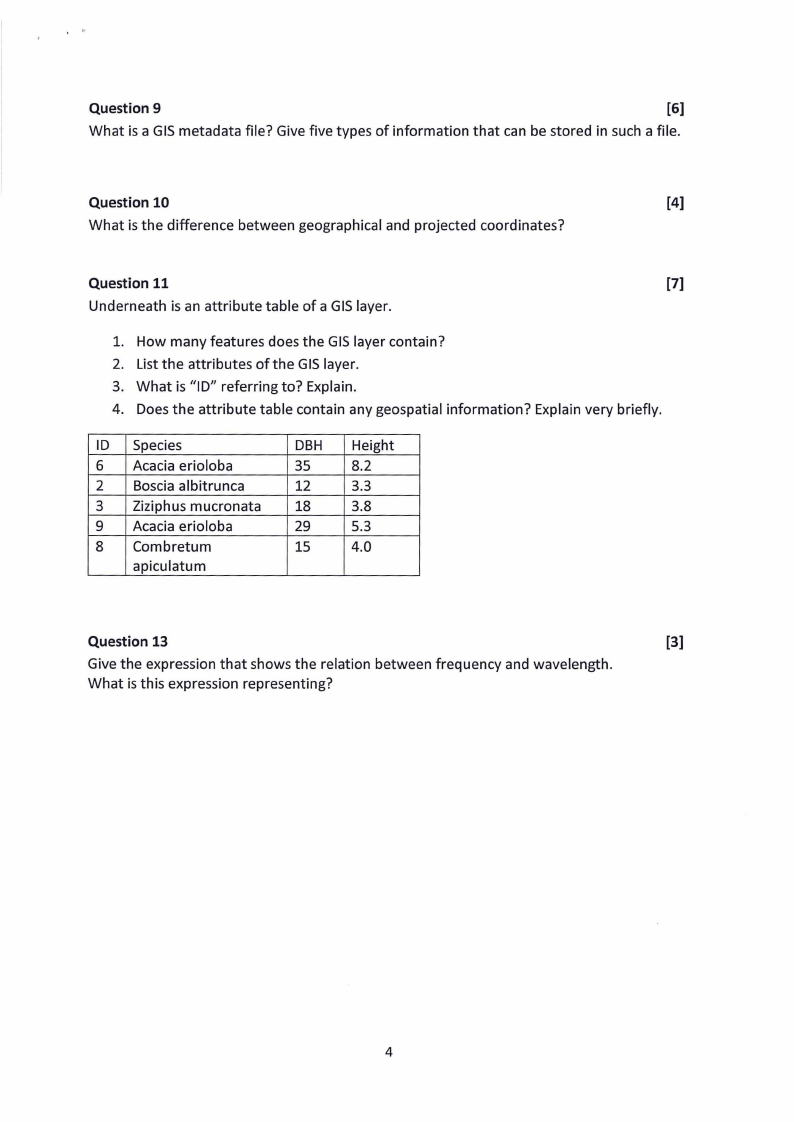
Underneath is an attribute table of a GIS layer.
1. How many features does the GIS layer contain?
2. List the attributes of the GIS layer.
3. What is "ID" referring to? Explain.
4. Does the attribute table contain any geospatial information? Explain very briefly.
ID Species
6 Acacia erioloba
2 Boscia albitrunca
3 Ziziphus mucronata
9 Acacia erioloba
8 Combretum
apiculatum
DBH Height
35 8.2
12 3.3
18 3.8
29 5.3
15
4.0
Question 13
[3]
Give the expression that shows the relation between frequency and wavelength.
What is this expression representing?
4