


 |
MSS511S - MATHEMATICS AND STATISTICS FOR SPATIAL SCIENCES - 1ST OPP - JUNE 2023 |
|
|
1 Page 1 |
▲back to top |
nAmlBIA UnlVERSITY
OF SCIEnCE Ano TECHnOLOGY
FACULTY OF HEALTH, NATURAL RESOURCES AND APPLIED SCIENCES
SCHOOL OF NATURAL AND APPLIED SCIENCES
DEPARTMENT OF MATHEMATICS, STATISTICS AND ACTUARIAL SCIENCE
QUALIFICATION:
I
QUALIFICATION
I CODE:
I COURSE CODE:
I SESSION:
I DURATION:
BACHELOR OF PROPERTY STUDIES/NATIONAL DIPLOMA IN
PROPERTY STUDIES/GEOMATICS
27DPRS, 27DLMR, I LEVEL: 5
27DLAD, 27BPRS
MSS511S
JUNE 2023
3 HOURS
I COURSE
NAME:
I PAPER:
I MARKS
MATHEMATICS AND STATISTICS I
FOR SPATIAL SCIENCES
THEORY
I
100
I
FIRST
I EXAMINER
I MODERATOR
OPPORTUNITY
EXAMINATION QUESTION PAPER
I Dr. Jacob Ong'ala
I Mr.Andrew Roux
INSTRUCTION
1. Answer all the questions
2. Show clearly all the steps in the calculations
3. All written work must be done in blue and black ink
4. You may refer to your notes or any other materials
PERMISSIBLE MATERIALS
Non-programmable calculator without cover
THIS QUESTION PAPER CONSISTS OF 5 PAGERS (including the front page)
1
|
|
2 Page 2 |
▲back to top |
SECTION A
QUESTION 1 - 13 MARKS
(a) Solve for f
51(2! -
3)
+
1
6(!
-
4)
+
2
15
=
0
[3 mks]
(b) Use completing the square method to solve the following quadratic equation
0 = x 2 - 2x - 8
(c) Solve the following systems of equation (You may use any method)
2x -3y=10
3x-4y =8
QUESTION 2 - 16 MARKS
[5 mks]
[5 mks]
(a) Evaluate the following expressions
. 3 + J(5 2 - 32 ) + 23 + 15-;- 3 + 2 X 7 - 1
(i) 1 + (4 x 6)-;- (3 x 4) 3 x v'4+ 8 - 32 + 1
.. 1 (11)2- - (-2+ -3)(-5X -2)
2 54 83
[5 mks]
[3 mks]
(b) Simplify the following expressions completely
(i) [(s + 2t) - (s + 3t)] - [(2s + 3t) - (-4s + 5t)]
(ii) (a2 v1bVc3)(foW5c)
[3 mks]
[3 mks]
(c) A training college has 480 students of which 150 are girls. Express this as a fraction in its
simplest form.
[2 mks]
QUESTION 3 - 08 MARKS
(a) A box of resistors increase in price from $N 45 to $N 52. Calculate the percentage increase.
[2 mks]
(b) A wooden pole is 208 m long. If you divide it in the ratio of 7:19, what will be length of
each piece.
[3 mks]
(c) If y is inversely proportional to x and y=15.3 when x=0.6. Determine
(i) Coefficient of proportionality k
(ii) The value of y when x=l.5
[2 mks]
[1 mks]
2
|
|
3 Page 3 |
▲back to top |
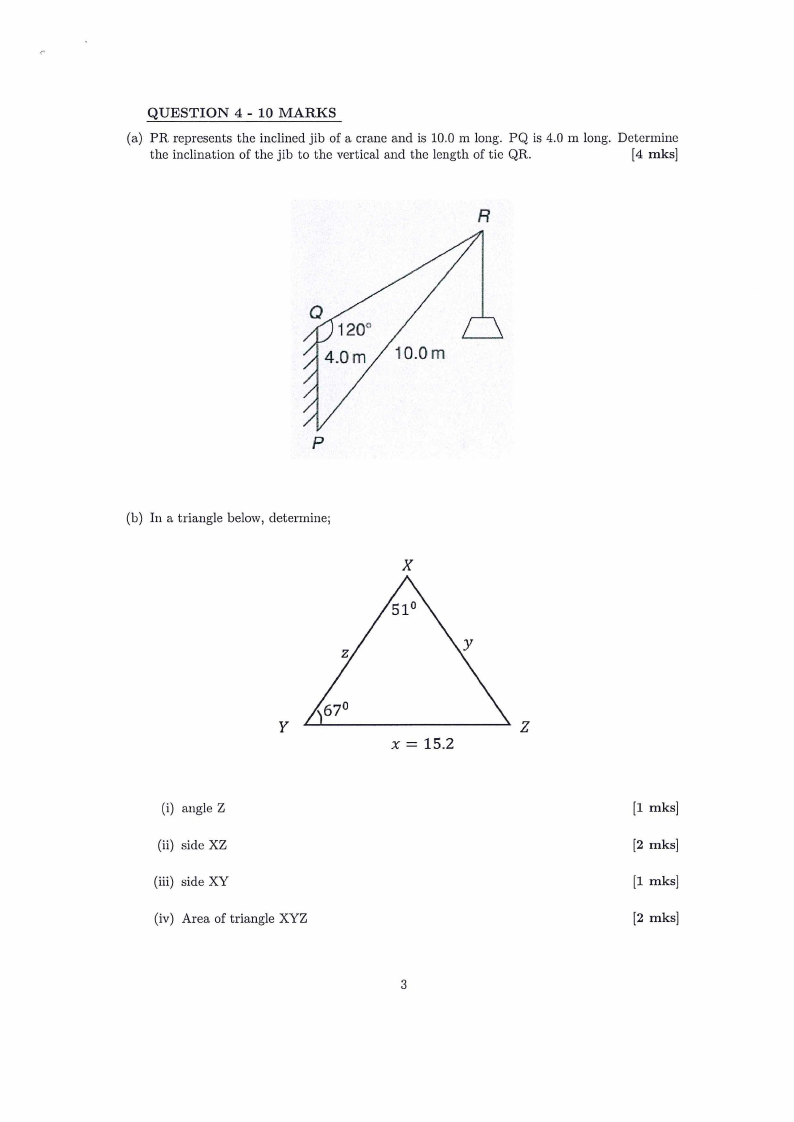
QUESTION 4 - 10 MARKS
(a) PR represents the inclined jib of a crane and is 10.0 m long. PQ is 4.0 m long. Determine
the inclination of the jib to the vertical and the length of tie QR.
[4 mks]
R
p
(b) In a triangle below, determine;
X
y
(i) angle Z
(ii) side XZ
(iii) side XY
(iv) Area of triangle XYZ
z
X = 15.2
3
[1 mks]
[2 mks]
[1 mks]
[2 mks]
|
|
4 Page 4 |
▲back to top |
SECTION B
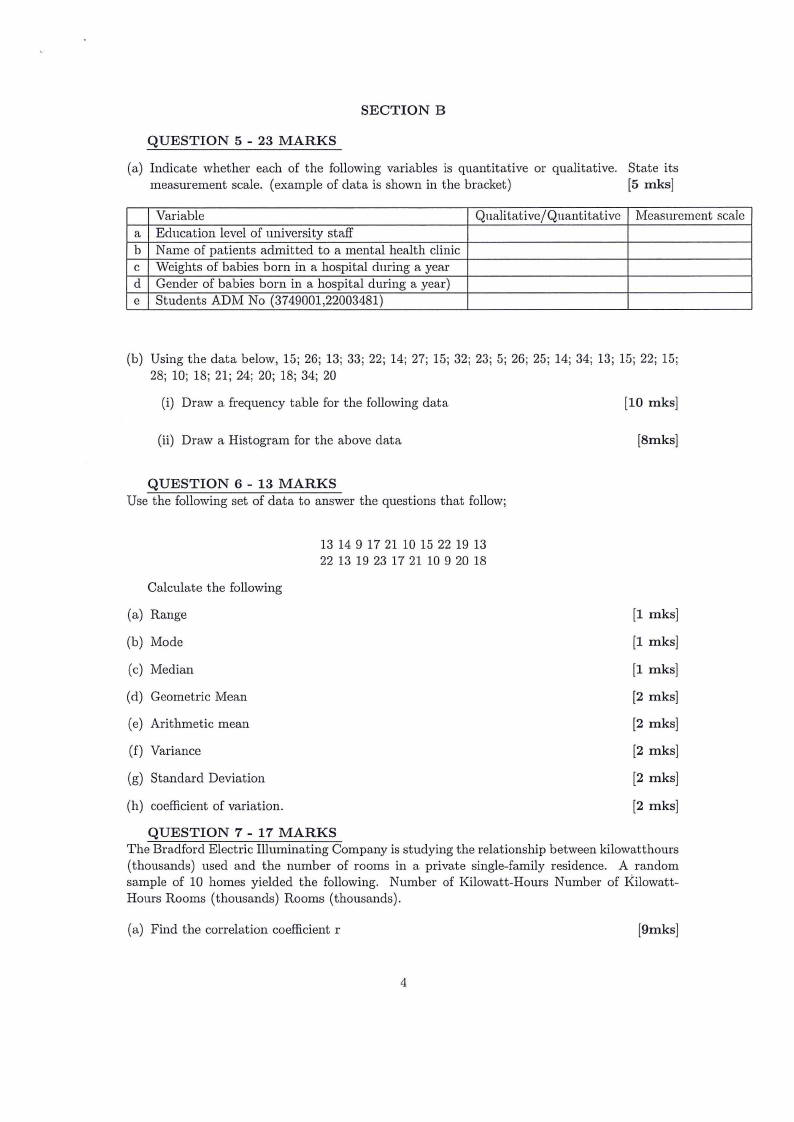
QUESTION 5 - 23 MARKS
(a) Indicate whether each of the following variables is quantitative or qualitative. State its
measurement scale. (example of data is shown in the bracket)
[5 mks]
Variable
Qualitative/Quantitative
a Education level of university staff
b Name of patients admitted to a mental health clinic
C Weights of babies born in a hospital during a year
d Gender of babies born in a hospital during a year)
e Students ADM No (3749001,22003481)
Measurement scale
(b) Using the data below, 15; 26; 13; 33; 22; 14; 27; 15; 32; 23; 5; 26; 25; 14; 34; 13; 15; 22; 15;
28; 10; 18; 21; 24; 20; 18; 34; 20
(i) Draw a frequency table for the following data
[10 mks]
(ii) Draw a Histogram for the above data
[8mks]
QUESTION 6 - 13 MARKS
Use the following set of data to answer the questions that follow;
13 14 9 17 21 10 15 22 19 13
22 13 19 23 17 21 10 9 20 18
Calculate the following
(a) Range
[1 mks]
(b) Mode
[1 mks]
(c) Median
[1 mks]
(d) Geometric Mean
[2 mks]
(e) Arithmetic mean
[2 mks]
(f) Variance
[2 mks]
(g) Standard Deviation
[2 mks]
(h) coefficient of variation.
[2 mks]
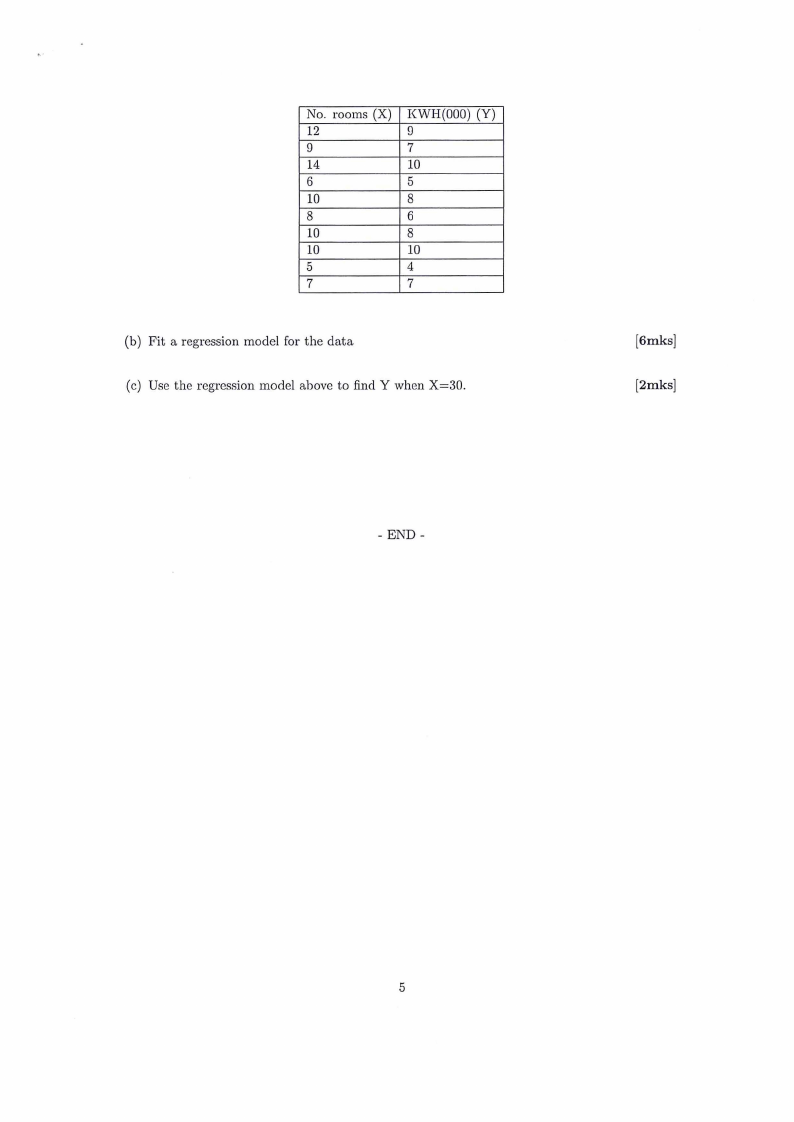
QUESTION 7 - 17 MARKS
The Bradford Electric Illuminating Company is studying the relationship between kilowatthours
(thousands) used and the number of rooms in a private single-family residence. A random
sample of 10 homes yielded the following. Number of Kilowatt-Hours Number of Kilowatt-
Hours Rooms (thousands) Rooms (thousands).
(a) Find the correlation coefficient r
[9mks]
4
|
|
5 Page 5 |
▲back to top |
No. rooms (X)
12
9
14
6
10
8
10
10
5
7
KWH(000) (Y)
!)
7
10
5
8
6
8
10
4
7
(b) Fit a regression model for the data
(c) Use the regression model above to find Y when X=30.
[6mks]
[2mks]
- END-
5