


 |
SAT802S - SAMPLING THEORY - 2ND OPP - JANUARY 2025 |
|
|
1 Page 1 |
▲back to top |
nArnl BIA un IVERSITY
OF SCIEnCE Ano TECHnOLOGY
FacultyofHealthN, atural
ResourceasndApplied
Sciences
Schoolof NaturalandApplied
Sciences
Departmentof Mathematics,
Statisticsand Actuarial Science
13JacksonKaujeuaStreet
Private Bag13388
Windhoek
NAMIBIA
T: +264612072913
E: msas@nust.na
W: www.nust.na
QUALIFICATION : BACHELOR OF SCIENCE HONOURS IN APPLIED STATISTICS
QUALIFICATION CODE: 08BSHS
LEVEL: 8
COURSE: SAMPLING THEORY
COURSECODE: SAT802S
DATE: JANUARY 2025
SESSION: 1
DURATION: 3 HOURS
MARKS: 100
EXAMINER:
MODERATOR:
SECOND OPPORTUNITY/ SUPPLEMENTARY: QUESTION PAPER
Mr. Jan Johannes Swartz
Prof. Opeoluwa Oyedele
INSTRUCTIONS:
1. Answer all questions on the separate answer sheet.
2. Please write neatly and legibly.
3. Do not use the left side margin of the exam paper. This must be allowed for the
examiner.
4. No books, notes and other additional aids are allowed.
5. Mark all answers clearly with their respective question numbers.
PERMISSIBLE MATERIALS:
1. Non-Programmable Calculator
ATTACHMENTS
1. Z - Table
2. T-Table
This paper consists of 4 pages including this front page
|
|
2 Page 2 |
▲back to top |
Question 1 [25 marks]
1.1. What is meant by the sampling distribution of a statistic?
[S]
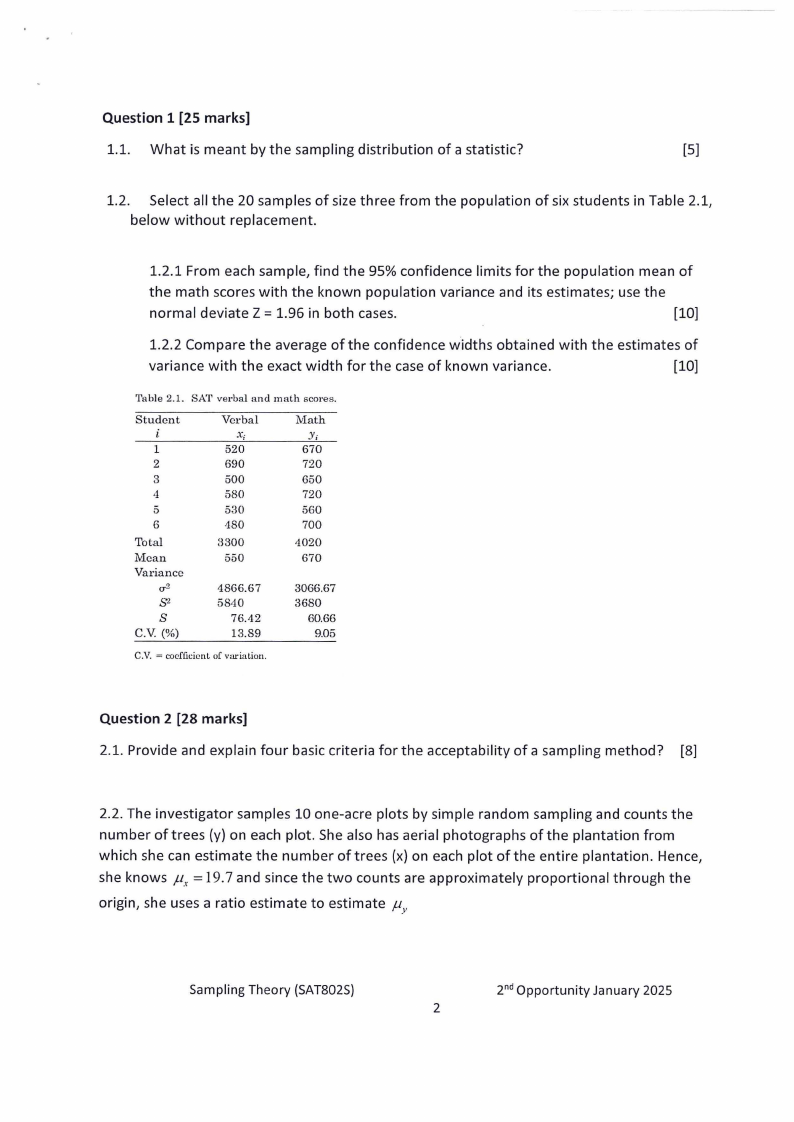
1.2. Select all the 20 samples of size three from the population of six students in Table 2.1,
below without replacement.
1.2.1 From each sample, find the 95% confidence limits for the population mean of
the math scores with the known population variance and its estimates; use the
normal deviate Z = 1.96 in both cases.
[10]
1.2.2 Compare the average of the confidence widths obtained with the estimates of
variance with the exact width for the case of known variance.
[10]
Table 2.1. SAT verbal and math scores.
Student
1
2
3
4
5
6
Total
Mean
Variance
rr2
s2
s
C.V (%)
Verbal
x,
520
690
500
580
530
-180
8300
550
4866.67
5840
76.-12
13.89
Math
)';
670
720
650
720
560
700
4020
670
3066.67
8680
60.66
9.05
C.V. = cocflicicnL of variaLion.
Question 2 [28 marks]
2.1. Provide and explain four basic criteria for the acceptability of a sampling method? [8]
2.2. The investigator samples 10 one-acre plots by simple random sampling and counts the
number of trees (y) on each plot. She also has aerial photographs of the plantation from
which she can estimate the number of trees (x) on each plot of the entire plantation. Hence,
she knows µx = 19.7 and since the two counts are approximately proportional through the
origin, she uses a ratio estimate to estimate µY
Sampling Theory (SAT802S)
2nd Opportunity January 2025
2
|
|
3 Page 3 |
▲back to top |
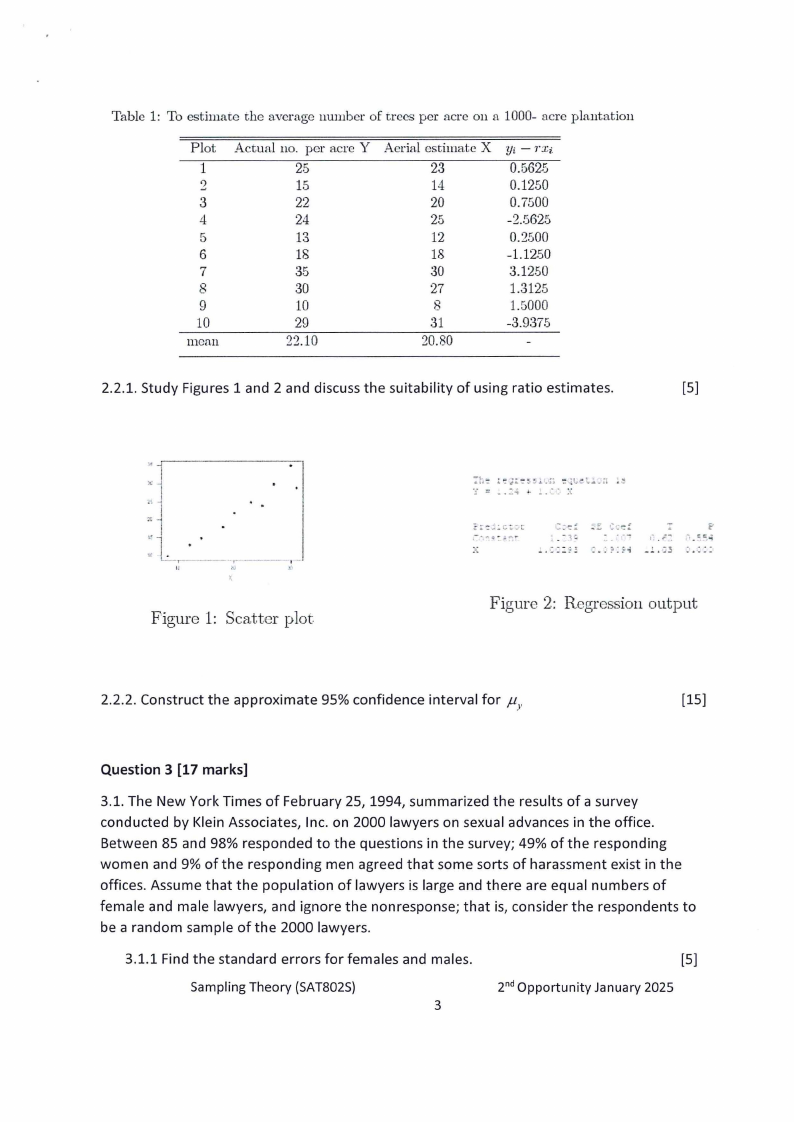
Table 1: To estimate the average number of trees per acre on a 1000- acre plantation
Plot
1
2
3
4
5
6
7
8
9
10
mean
Actual 110. per acre Y
25
15
22
24
13
18
35
30
10
29
22.10
Aerial est.imate X
23
14
20
25
12
18
30
27
8
31
20.80
Yi - 1"Xi
0.5625
0.1250
0.7,500
-2.5625
0.2500
-1.12.50
3.1250
1.312,5
l.[)000
-3.9375
2.2.1. Study Figures 1 and 2 and discuss the suitability of using ratio estimates.
[5]
z
'----,---
~--- ,,.-
Figure 1: Scatter plot.
Figure 2: Regression output
2.2.2. Construct the approximate 95% confidence interval for µY
[15]
Question 3 [17 marks]
3.1. The New York Times of February 25, 1994, summarized the results of a survey
conducted by Klein Associates, Inc. on 2000 lawyers on sexual advances in the office.
Between 85 and 98% responded to the questions in the survey; 49% of the responding
women and 9% of the responding men agreed that some sorts of harassment exist in the
offices. Assume that the population of lawyers is large and there are equal numbers of
female and male lawyers, and ignore the nonresponse; that is, consider the respondents to
be a random sample of the 2000 lawyers.
3.1.1 Find the standard errors for females and males.
Sampling Theory (SAT802S)
3
[5]
2nd Opportunity January 2025
|
|
4 Page 4 |
▲back to top |
3.2. To estimate the percentage of people that carries a viral infection which produces AIDS,
128 people are examined and 72 of them are found to be infected. Calculate the standard
error of the estimated proportion and compute a 95% confidence interval for the
population proportion?
[7]
3.3. If no information of P (proportion} is provided when determining the sample size of a
population, find the error of the estimation e for n = 2000, Consider a= 0.05 for both
cases.
[5]
Question 4 [30 marks]
4.1.
[10]
Let there exist a populati,on
l.J = {l, 2, 3} '.Vit.h tbe following design:
Give t. nc first-order inch ··ion proba.1.Jilitics. Give the ,.t,niance-covaria;ncc
.:na-
t:rix .6.. of :indicator ·variabl<~s for inclusion in the sm:np e. Give the variauce
-rnatrix of chc~ unbiased est.irnat,or for the total.
4.2. Between the 100 computer corporations in Namibia, the average of employee sizes for
the largest 10 and smallest 10 corporations were known to be 300 and 100, respectively.
For a sample of 20 from the remaining 80 corporations, the mean and standard deviation
were 250 and 110, respectively. For the total employee size of the 80 corporations, find the
a} Estimate of the total,
[3]
b} Standard error of the estimate, and
[3]
c} 95% confidence limits.
[5]
4.3. Write a short description on the importance of the normal distribution in sampling
theory
[5]
4.4. List 4 properties of the normal probability distribution.
[4]
**************************END OFEXAMINATION*****************************
Sampling Theory (SAT802S)
2nd Opportunity January 2025
4
|
|
5 Page 5 |
▲back to top |
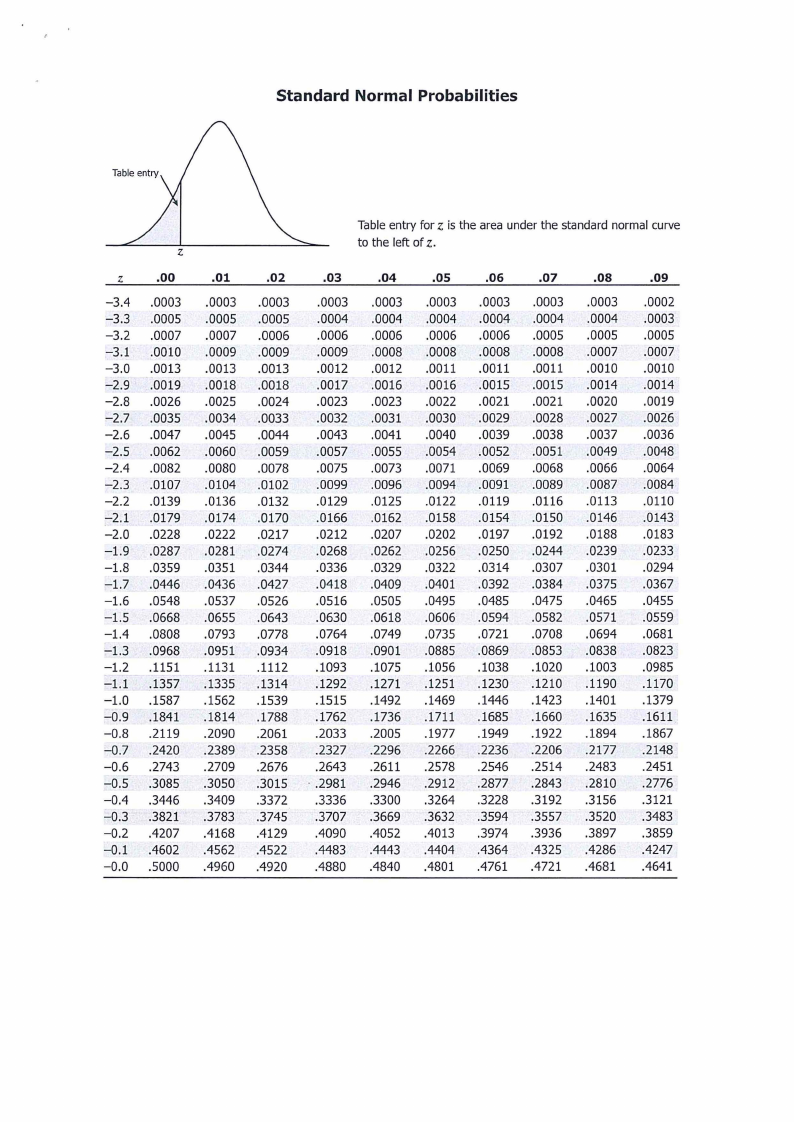
Standard Normal Probabilities
Table entry for z is the area under the standard normal curve
z
to the le~ of z.
z
.00
-3.4 .0003
-3.3 .0005
-3.2 .0007
-3.1 .0010
-3.0 .0013
-2.9 .0019
-2.8 .0026
-2.7 .0035
-2.6 .0047
-2.5 .0062
-2.4 .0082
-2.3 .0107
-2.2 .0139
-2.1 .0179
-2.0 .0228
-1.9 .0287
-1.8 .0359
-1.7 .0446
-1.6 .0548
-1.5 .0668
-1.4 .0808
-1.3 .0968
-1.2 .1151
-1.1 .1357
-1.0 .1587
-0.9 .1841
-0.8 .2119
-0.7 .2420
-0.6 .2743
-0.5 .3085
-0.4 .3446
-0.3 .3821
-0.2 .4207
-0.1 .4602
-0.0 .5000
.01
.0003
.0005
.0007
.0009
.0013
.0018
.0025
.0034
.0045
.0060
.0080
.0104
.0136
.0174
.0222
.0281
.0351
.0436
.0537
.0655
.0793
.0951
.1131
.1335
.1562
.1814
.2090
.2389
.2709
.3050
.3409
.3783
.4168
.4562
.4960
.02
.0003
.0005
.0006
.0009
.0013
.0018
.0024
.0033
.0044
.0059
.0078
.0102
.0132
.0170
.0217
.0274
.0344
.0427
.0526
.0643
.0778
.0934
.1112
.1314
.1539
.1788
.2061
.2358
.2676
.3015
.3372
.3745
.4129
.4522
.4920
.03
.0003
.0004
.0006
.0009
.0012
.0017
.0023
.0032
.0043
.0057
.0075
.0099
.0129
.0166
.0212
.0268
.0336
.0418
.0516
.0630
.0764
.0918
.1093
.1292
.1515
.1762
.2033
.2327
.2643
· .2981
.3336
.3707
.4090
.4483
.4880
.04
.0003
.0004
.0006
.0008
.0012
.0016
.0023
.0031
.0041
.0055
.0073
.0096
.0125
.0162
.0207
.0262
.0329
.0409
.0505
.0618
.0749
.0901
.1075
.1271
.1492
.1736
.2005
.2296
.2611
.2946
.3300
.3669
.4052
.4443
.4840
.OS
.0003
.0004
.0006
.0008
.0011
.0016
.0022
.0030
.0040
.0054
.0071
.0094
.0122
.0158
.0202
.0256
.0322
.0401
.0495
.0606
.0735
.0885
.1056
.1251
.1469
.1711
.1977
.2266
.2578
.2912
.3264
.3632
.4013
.4404
.4801
.06
.0003
.0004
.0006
.0008
.0011
.0015
.0021
.0029
.0039
.0052
.0069
.0091
.0119
.0154
.0197
.0250
.0314
.0392
.0485
.0594
.0721
.0869
.1038
.1230
.1446
.1685
.1949
.2236
.2546
.2877
.3228
.3594
.3974
.4364
.4761
.07
.0003
.0004
.0005
.0008
.0011
.0015
.0021
.0028
.0038
.0051
.0068
.0089
.0116
.0150
.0192
.0244
.0307
.0384
.0475
.0582
.0708
.0853
.1020
.1210
.1423
.1660
.1922
.2206
.2514
.2843
.3192
.3557
.3936
.4325
.4721
.08
.0003
.0004
.0005
.0007
.0010
.0014
.0020
.0027
.0037
.0049
.0066
.0087
.0113
.0146
.0188
.0239
.0301
.0375
.0465
.0571
.0694
.0838
.1003
.1190
.1401
.1635
.1894
.2177
.2483
.2810
.3156
.3520
.3897
.4286
.4681
.09
.0002
.0003
.0005
.0007
.0010
.0014
.0019
.0026
.0036
.0048
.0064
.0084
.0110
.0143
.0183
.0233
.0294
.0367
.0455
.0559
.0681
.0823
.0985
.1170
.1379
.1611
.1867
.2148
.2451
.2776
.3121
.3483
.3859
.4247
.4641
|
|
6 Page 6 |
▲back to top |
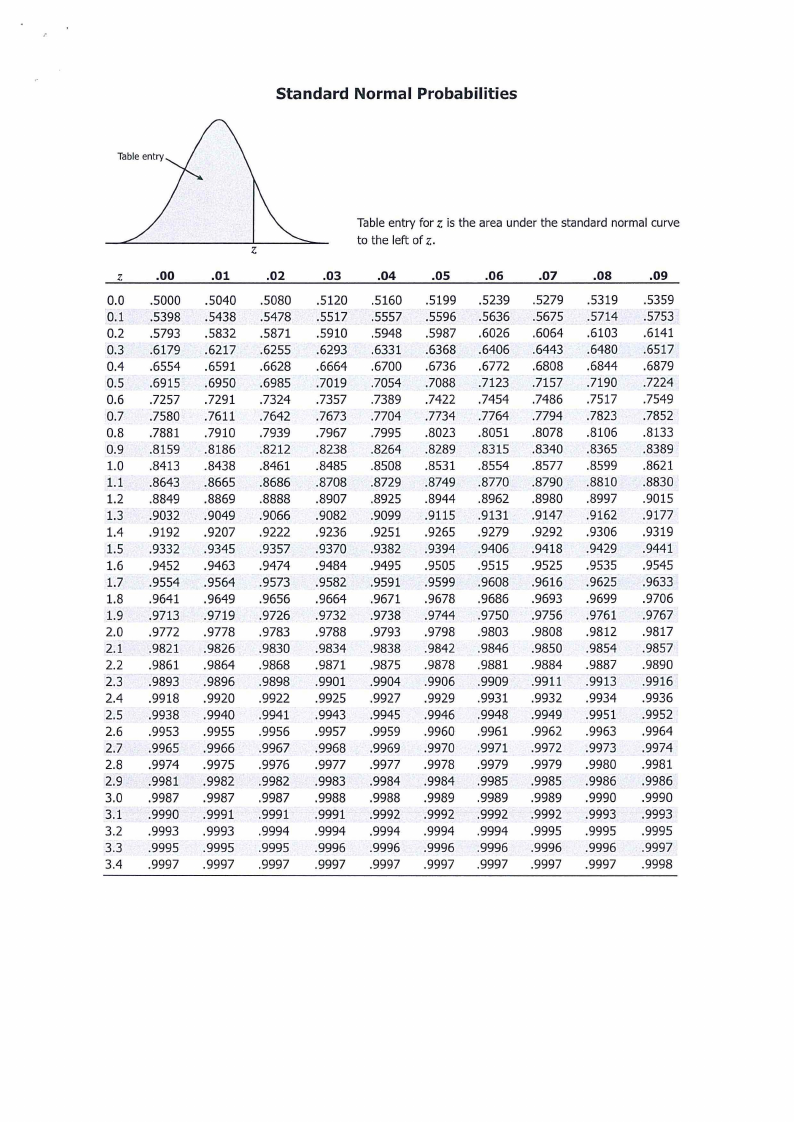
Standard Normal Probabilities
Table entry for z is the area under the standard normal curve
z
to the le~ of z.
z
.00
.01
.02
.03
.04
.OS
.06
.07
.08
.09
0.0 .5000 .5040 .5080 .5120 .5160 .5199 .5239 .5279 .5319 .5359
0.1 .5398 .5438 .5478 .5517 .5557 .5596 .5636 .5675 .5714 .5753
0.2 .5793 .5832 .5871 .5910 .5948 .5987 .6026 .6064 .6103 .6141
0.3 .6179 .6217 .6255 .6293 .6331 .6368 .6406 .6443 .6480 .6517
0.4 .6554 .6591 .6628 .6664 .6700 .6736 .6772 .6808 .6844 .6879
0.5 .6915 .6950 .6985 .7019 .7054 .7088 .7123 .7157 .7190 .7224
0.6 .7257 .7291 .7324 .7357 .7389 .7422 .7454 .7486 .7517 .7549
0.7 .7580 .7611 .7642 .7673 .7704 .7734 .7764 .7794 .7823 .7852
0.8 .7881 .7910 .7939 .7967 .7995 .8023 .8051 .8078 .8106 .8133
0.9 .8159 .8186 .8212 .8238 .8264 .8289 .8315 .8340 .8365 .8389
1.0 .8413 .8438 .8461 .8485 .8508 .8531 .8554 .8577 .8599 .8621
1.1 .8643 .8665 .8686 .8708 .8729 .8749 .8770 .8790 .8810 .8830
1.2 .8849 .8869 .8888 .8907 .8925 .8944 .8962 .8980 .8997 .9015
1.3 .9032 .9049 .9066 .9082 .9099 .9115 .9131 .9147 .9162 .9177
1.4 .9192 .9207 .9222 .9236 .9251 .9265 .9279 .9292 .9306 .9319
1.5 .9332 .9345 .9357 .9370 .9382 .9394 .9406 .9418 .9429 .9441
1.6 .9452 .9463 .9474 .9484 .9495 .9505 .9515 .9525 .9535 .9545
1.7 .9554 .9564 .9573 .9582 .9591 .9599 .9608 .9616 .9625 .9633
1.8 .9641 .9649 .9656 .9664 .9671 .9678 .9686 .9693 .9699 .9706
1.9 .9713 .9719 .9726 .9732 .9738 .9744 .9750 .9756 .9761 .9767
2.0 .9772 .9778 .9783 .9788 .9793 .9798 .9803 .9808 .9812 .9817
2.1 .9821 .9826 .9830 .9834 .9838 .9842 .9846 .9850 .9854 .9857
2.2 .9861 .9864 .9868 .9871 .9875 .9878 .9881 .9884 .9887 .9890
2.3 .9893 .9896 .9898 .9901 .9904 .9906 .9909 .9911 .9913 .9916
2.4 .9918 .9920 .9922 .9925 .9927 .9929 .9931 .9932 .9934 .9936
2.5 .9938 .9940 .9941 .9943 .9945 .9946 .9948 .9949 .9951 .9952
2.6 .9953 .9955 .9956 .9957 .9959 .9960 .9961 .9962 .9963 .9964
2.7 .9965 .9966 .9967 .9968 .9969 .9970 .9971 .9972 .9973 .9974
2.8 .9974 .9975 .9976 .9977 .9977 .9978 .9979 .9979 .9980 .9981
2.9 .9981 .9982 .9982 .9983 .9984 .9984 .9985 .9985 .9986 .9986
3.0 .9987 .9987 .9987 .9988 .9988 .9989 .9989 .9989 .9990 .9990
3.1 .9990 .9991 .9991 .9991 .9992 .9992 .9992 .9992 .9993 .9993
3.2 .9993 .9993 .9994 .9994 .9994 .9994 .9994 .9995 .9995 .9995
3.3 .9995 .9995 .9995 .9996 .9996 .9996 .9996 .9996 .9996 .9997
3.4 .9997 .9997 .9997 .9997 .9997 .9997 .9997 .9997 .9997 .9998
|
|
7 Page 7 |
▲back to top |
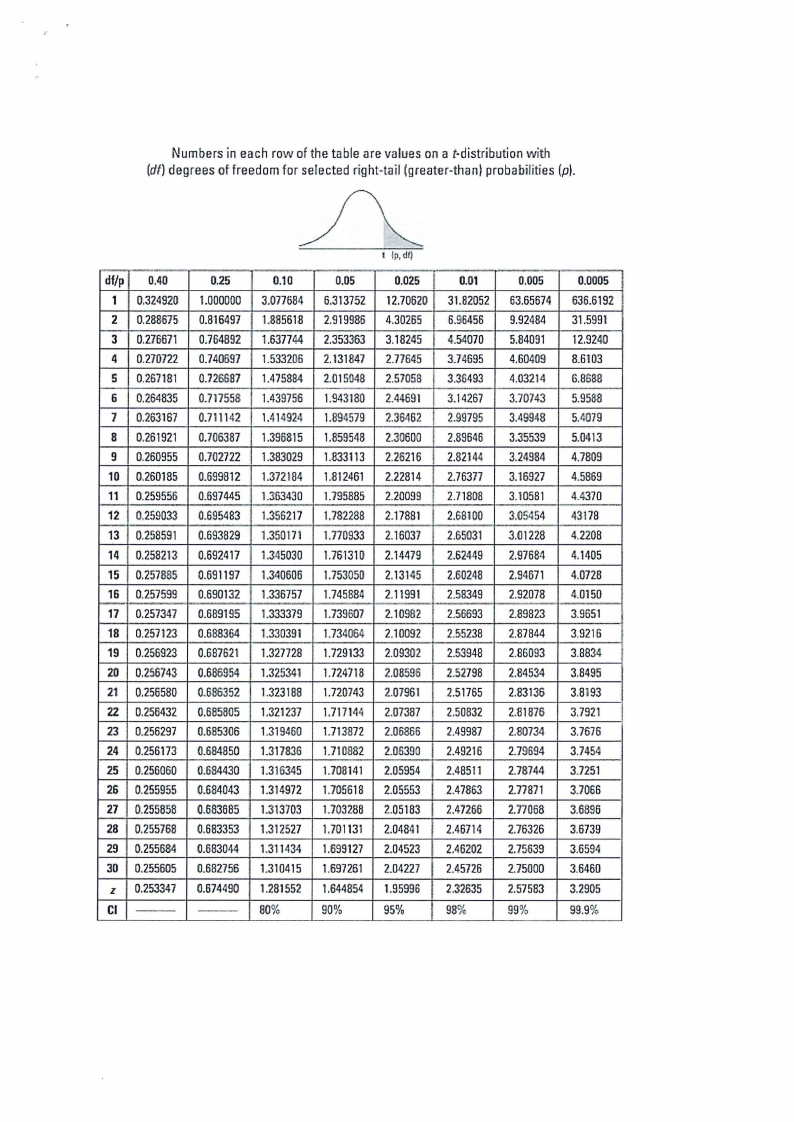
Numbers in each row of the table are values on a t-distributioo with
(df) degrees of freedom tor selected right-tail (greater-than) probabilities (p).
df/p· 0.40
0.25
1 j 0.324920 1.000000
2 0.288675 0.816497
3 0.276671 0.764892
4 0.270722 0.740697
5 0.267181 0.726887
.
6 0.264835 0.717558
7 0.263167 0.711142
8 0.261921 0.706387
9 0.260955 0.702722
10 0.260185 0.699812
1t • 0.259556 0.697445
12 . 0.259033 0.695483
13 0.258591 0.693829
14 0,258213 0.692417
15 0.257885 0.691197
16 0.257599 0.690132
17 0.257347 0.689195
18 0.257123 0.688364
19 0.256923 0.687621
20 0.256743 0.686954
21 0.256580 0.686352
22 0.256432 0.685805
23 0.256297 0.685306
24 0.256173 0.684850
25 ' 0.256060 0.684430
26 i 0.255955 0.684043
27 ' 0.255858 0.683685
28 0.255768 0.6B3353
29 0.255684 0.683044
30 0.255605 0.6B2756
z 0.253347 0.674490
Cl --
--
0.10
0.05
0.025
0.01
3.077mM 6.313752 12.70620 31.82052
1.885618 2.919986 4.30265 6,96456
1.637744 2.353363 3.18245 4.54070
1.53:3206 2.131847 2.77645 3.74695
1.475884 2.015048 2.5705B 3.36493
1.439756 1.943180 2.44691 3.14267
1.414924 1.894579 2.36462 2.99795
1.396815 1.859548 2.30600 2.89646
1.383029 1.833113 2.26216 2.82144
1.372.184 1.812461 2.22814 2.76377
1.363430 1.795885 2.20099 2.71808
1.356217 1.782288. 2.17881 2.6Bl00
1.350171 1.770933 2.16037 2.65031
1.3,15030 1.761310 2.14479 2.62449
1.340606 1.753050 2.13145 2.60248
1.336757 1.745884 2.11991 2..58349
1.333379 1.739607 2.10982 2.56693
1.330391 1.734il64 2.10092 2.55238
1.3277213 1.729133 2.09302 2.53948
l.325341 1.72471a 2.08596 2.52798
1.32318:S 1.720743 2.07961 2.51765
1.321237 1.717144 2.07387 2.50832
1.319460 1.713872 2.06866 2.49987
1.31783'6 1.710882 2.0539{) 2.49216
1.316345 1.708141 2.05954 2.48511
l.314972 1.705618 2.05553 2.47863
1.31370'3 1.703288 2.05183 2.47266
1.312527
1.3114J-4
1.310415
1.701131
1.699127
1.697261
2.048•11 2.467M
I 2.04523 2.46202
2.04227 2.45726
1.281552 1.644854 Ul5996 2.32635
80%
90%
95%
98%
0.005
0.0005
6.3.6567~ 636.6192
9.92484 31.5991
5.84091 12.9240
4.60409 8.6103
4.03214 6.8688
3.70743 5.9588
3.49948 5.4079
3.35539 5.0ill3
3,24984 4.7809
3.16927 4.5869
3.10581 4.4370
3.05454 43178
3.01228 4.2208
2.97684 4.1405
2.94671 4.0728
2.92078 4.0150
2.89823 3.9651
2.87844 3.9216
2.86093 3.8834
2.84534 3,6495
2.83136 3.8193
2.81876 3.7921
2.80734 3.7676
2.79694 3.7454
2.78744 3.7251
2,77871 3.7066
2.77068 3.6896
2.76326 3,6739
2.75639 3,6594
2.75000 3.6460
2.57583 3.2905
99%
99.9%