|
FSL811S- FINANCIAL STRATEGIES FOR LOGISTICS AND SUPPLY CHAIN OPTIMISATION- 2ND OPP- MAY 2024 |
|
|
1 Page 1 |
▲back to top |
nAm I BI A un IVE RSITY
OFSCIEnCEAno TECHno LOGY
FACULTYOF COMMERCE,HUMAN SCIENCESAND EDUCATION
DEPARTMENTOF MARKETING,LOGISTICSAND SPORTMANAGEMENT
QUALIFICATION: BACHELOR OF LOGISTICS & SUPPLY CHAIN MANAGEMENT HONOURS
QUALIFICATION CODE: 08BSLH
COURSE CODE: FSL811 S
SESSION: MAY 2024
LEVEL: 8
COURSE NAME: FINANCIAL STRATEGIES FOR
LOGISTICS AND & SUPPLY CHAIN OPTIMISATION
PAPER: THEORY AND CALCULATIONS
DURATION: 3 HOURS
MARKS: 100
SECOND OPPORTUNITY FINAL ASSESSMENT QUESTION PAPER
EXAMINER
MR. LAMECK ODADA
MODERATOR MR. JOHANNES NDJULUWA
INSTRUCTIONS
1. This question paper consists of FOUR (4) questions.
2. Answer ALL FOUR (4) questions in blue or black ink only. NO PENCIL.
3. Start each question on a new page, number the answers correctly and clearly.
4. Write clearly, neatly and show all your workings/calculations/assumptions.
5. Unless otherwise stated, work with four (4) decimal places in all your calculations and
only round off final answers to two (2) decimal places.
6. Questions relating to this assessment may be raised in the initial 30 minutes after the
start of the examination. Thereafter, candidates must use their initiative to deal with any
perceived error or ambiguities and any assumptions made by the candidate should be
clearly stated.
PERMISSIBLEMATERIALS
• Silent, non-programmable calculators
THISASSESSMENTCONSISTSOF_9_ PAGES(including this cover page, but not tables)
|
|
2 Page 2 |
▲back to top |
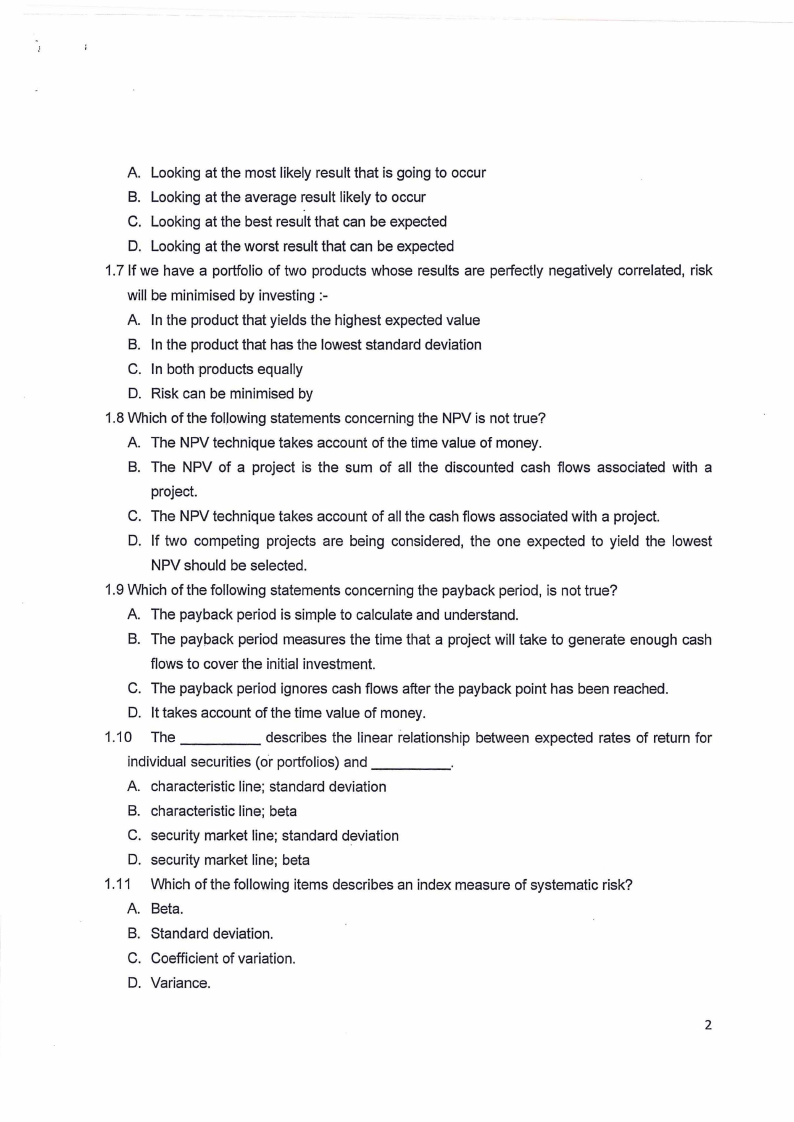
A Looking at the most likely result that is going to occur
8. Looking at the average result likely to occur
C. Looking at the best result that can be expected
D. Looking at the worst result that can be expected
1.7 If we have a portfolio of two products whose results are perfectly negatively correlated, risk
will be minimised by investing :-
A In the product that yields the highest expected value
8. In the product that has the lowest standard deviation
C. In both products equally
D. Risk can be minimised by
1.8 Which of the following statements concerning the NPV is not true?
A The NPV technique takes account of the time value of money.
8. The NPV of a project is the sum of all the discounted cash flows associated with a
project.
C. The NPV technique takes account of all the cash flows associated with a project.
D. If two competing projects are being considered, the one expected to yield the lowest
NPV should be selected.
1.9 Which of the following statements concerning the payback period, is not true?
A The payback period is simple to calculate and understand.
8. The paypack period measures the time that a project will take to generate enough cash
flows to cover the initial investment.
C. The payback period ignores cash flows after the payback point has been reached.
D. It takes account of the time value of money.
1.1O The _____
describes the linear relationship between expected rates of return for
individual securities (or portfolios) and ____
_
A characteristic line; standard deviation
8. characteristic line; beta
C. security market line; standard deviation
D. security market line; beta
1.11 Which of the following items describes an index measure of systematic risk?
A Beta.
B. Standard deviation.
C. Coefficient of variation.
D. Variance.
2
|
|
3 Page 3 |
▲back to top |
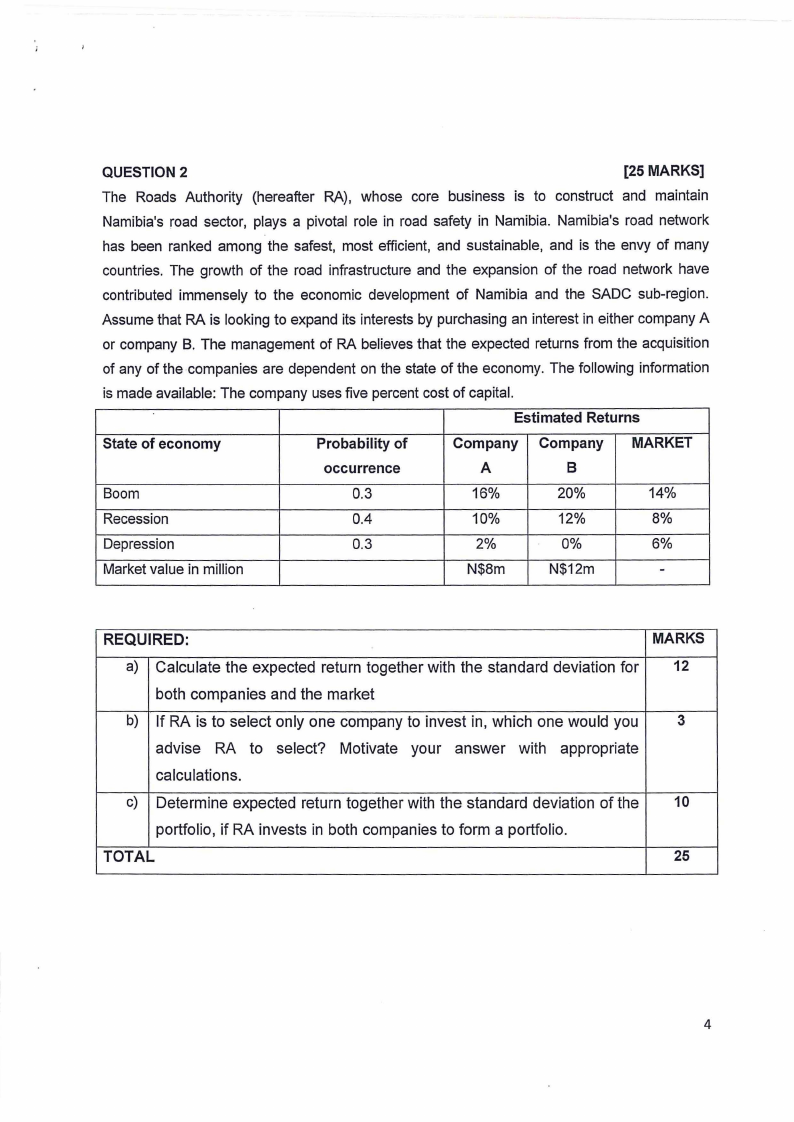
QUESTION 2
[25 MARKS]
The Roads Authority (hereafter RA), whose core business is to construct and maintain
Namibia's road sector, plays a pivotal role in road safety in Namibia. Namibia's road network
has been ranked among the safest, most efficient, and sustainable, and is the envy of many
countries. The growth of the road infrastructure and the expansion of the road network have
contributed immensely to the economic development of Namibia and the SADC sub-region.
Assume that RA is looking to expand its interests by purchasing an interest in either company A
or company B. The management of RA believes that the expected returns from the acquisition
of any of the companies are dependent on the state of the economy. The following information
is made available: The company uses five percent cost of capital.
Estimated Returns
State of economy
Probability of
Company Company MARKET
occurrence
A
8
Boom
0.3
16%
20%
14%
Recession
0.4
10%
12%
8%
Depression
0.3
2%
0%
6%
Market value in million
N$8m
N$12m
-
REQUIRED:
MARKS
a) Calculate the expected return together with the standard deviation for 12
both companies and the market
b) If RA is to select only one company to invest in, which one would you
3
advise RA to select? Motivate your answer with appropriate
calculations.
c) Determine expected return together with the standard deviation of the 10
portfolio, if RA invests in both companies to form a portfolio.
TOTAL
25
4
|
|
4 Page 4 |
▲back to top |
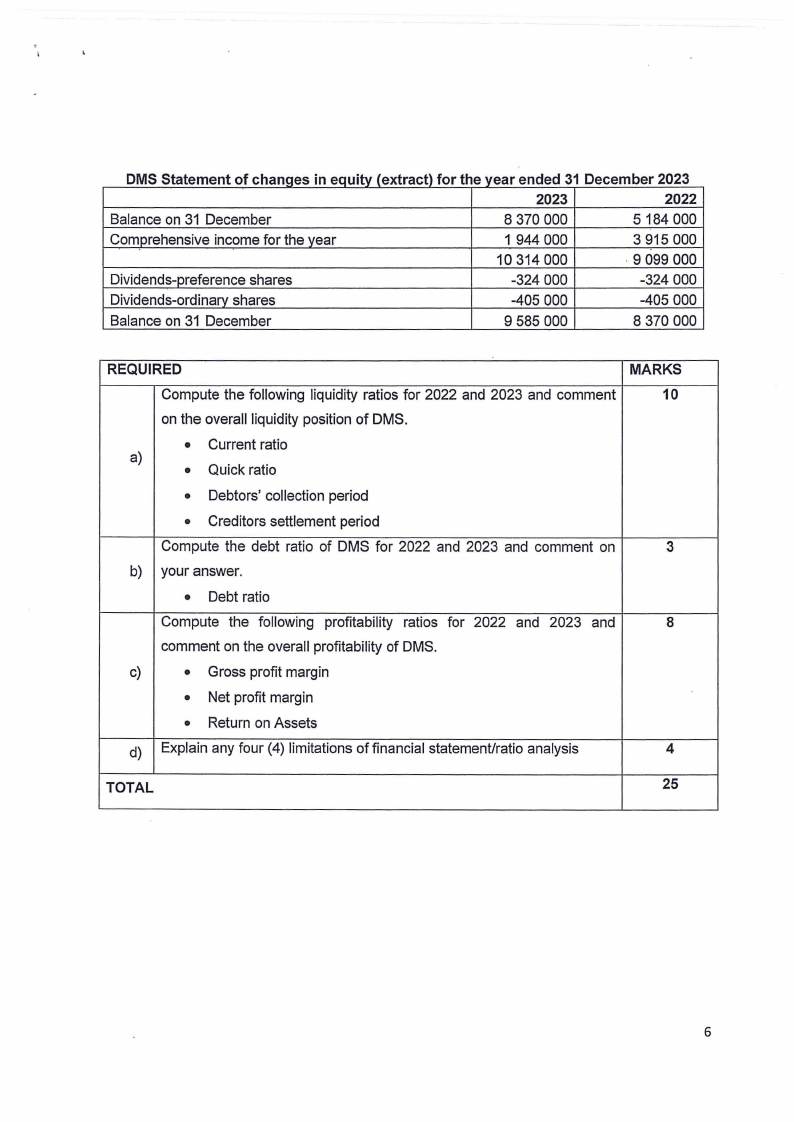
OMS Statement of changes in equity (extract) for the year ended 31 December 2023
2023
2022
Balance on 31 December
8 370 000
5 184 000
Comprehensive income for the year
1 944 000
3 915 000
10 314 000
· 9 099 000
Dividends-preference shares
-324 000
-324 000
Dividends-ordinary shares
-405 000
-405 000
Balance on 31 December
9 585 000
8 370 000
REQUIRED
MARKS
Compute the following liquidity ratios for 2022 and 2023 and comment
10
on the overall liquidity position of OMS.
• Current ratio
a)
• Quick ratio
• Debtors' collection period
• Creditors settlement period
Compute the debt ratio of OMS for 2022 and 2023 and comment on
3
b) your answer.
• Debt ratio
Compute the following profitability ratios for 2022 and 2023 and
8
comment on the overall profitability of OMS.
c)
• Gross profit margin
• Net profit margin
• Return on Assets
d) Explain any four (4) limitations of financial statement/ratio analysis
4
TOTAL
25
6
|
|
5 Page 5 |
▲back to top |
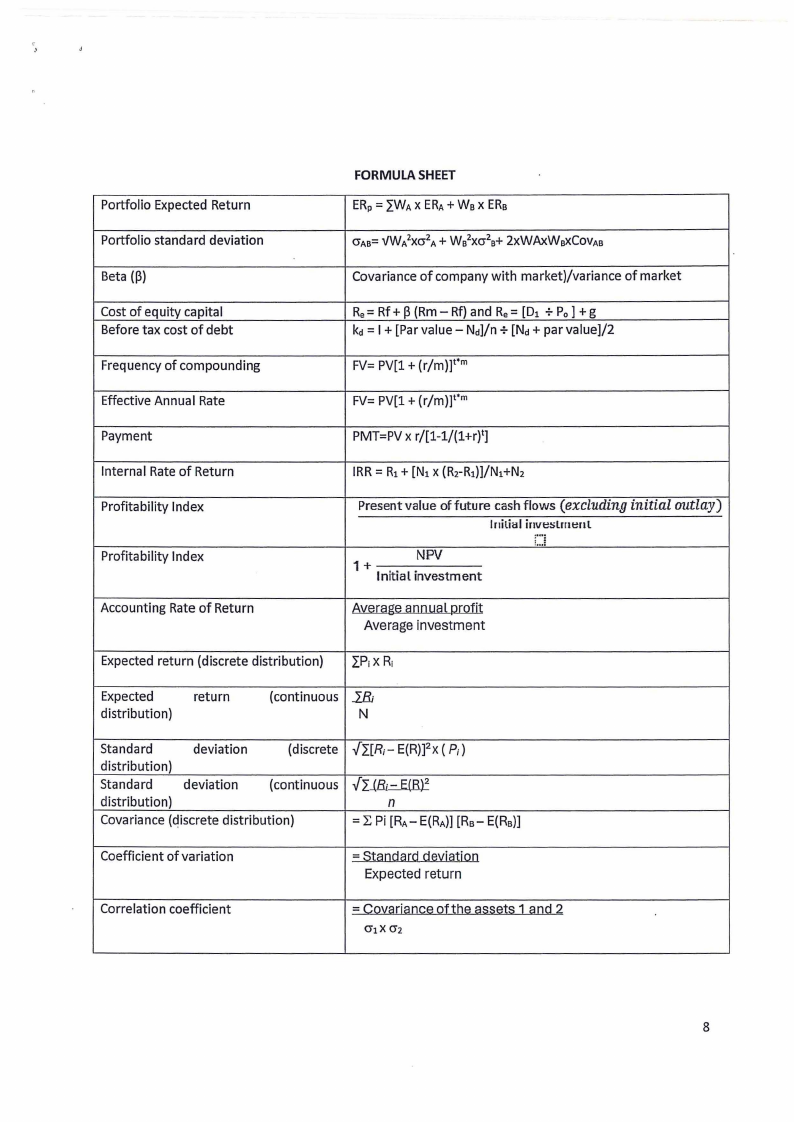
Portfolio Expected Return
Portfolio standard deviation
FORMULASHEET
ERp= "'j_WAX ERA+Ws X ERs
O"As=vW/xcr 2A+ Ws2Xcr2s+ 2xWAx.WsXCOVAB
Beta (~)
Covariance of company with market)/variance of market
Cost of equity capital
Before tax cost of debt
Re= Rf+~ (Rm - Rf) and Re= [D1 + Po] + g
kd =I+ [Par value- Nd]/n +[Nd+ par value]/2
Frequency of compounding
FV= PV[l + (r/m)] 1*m
Effective Annual Rate
FV= PV[l + (r/m)] 1*m
Payment
PMT=PV x r/[1-1/(1+r) 1]
Internal Rate of Return
Profitability Index
Profitability Index
Accounting Rate of Return
IRR= R1+ [N1 x (R2-R1)]/N1+N2
Present value of future cash flows (excluding initial outlay)
lr1ilial inve:;lmtml
1•••:
NPV
1+
Initial investment
Average investment
Expected return (discrete distribution)
"'i..PiXRi
Expected
distribution)
return
(continuous .lli
N
Standard
deviation
(discrete
distribution)
Standard
deviation
(continuous
distribution)
Covariance (discrete distribution)
../"i.[R;- E(R)]2x ( P;)
../"i.J&::~E.(B.).:
n
= L Pi [RA- E(RA)][Rs- E(Rs)]
Coefficient of variation
=
Expected return
Correlation coefficient
=
oHbe assets 1 2
0"1X 0"2
8
|
|
6 Page 6 |
▲back to top |