


 |
DSA822S - DATA SCIENCE AND ANALYTICS - 2ND OPP - JAN 2024 |
|
|
1 Page 1 |
▲back to top |
n Am I BI A u n IVER s I TY
OF SCIEnCE Ano TECHnOLOGY
FACULTY OF COMPUTING AND INFORMATICS
DEPARTMENT OF INFORMATICS
QUALIFICATIONS: BACHELOROF INFORMATICS HONOURS(BUSINESS,WEB)
QUALIFICATION CODE: 08BIFB; 08BIHW LEVEL: 8
COURSE CODE: DSA821S
COURSE: DATA SCIENCEAND ANALYTICS
DATE: JANUARY 2024
SESSION: 1
DURATION: 2 HOURS
MARKS: 70
SUPPLEMENTARY/SECOND OPPORTUNITY EXAMINATION QUESTION PAPER
EXAMINERS:
Mr Eliazer Mbaeva
MODERATOR(S):
Mrs Emilia Shikeenga
THIS EXAMINATION PAPER CONSISTS OF 4 PAGES
(INCLUDING THIS FRONT PAGE)
INSTRUCTIONS FOR THE CANDIDATE
1. Answer all questions.
2. When writing, consider the following: The style should be to inform rather than
impress.
3. Information should be brief and accurate.
4. Please ensure that your writing is legible, neat and presentable.
|
|
2 Page 2 |
▲back to top |
SECTIONA
Question 1
Choose the correct answer from each of the options given.
{1 x 5 = 5 marks)
1.1. Data has been collected on visitors' viewing habits at a bank's website. Which
technique is used to identify pages commonly viewed during the same visit to the
website?
a. Clustering
b. Classification
c. Association Rules
d. Regression
1.2. Which of the following step is performed by data scientist after acquiring the data?
a. Data Integration
b. Data Replication
c. Data Cleansing
d. All the above
1.3. Which of the following is one of the key data science skills?
a. Machine Learning
b. Statistics
c. Data Visualization
d. All the above
1.4. Which of the following is the process of evaluating data through analytical and
statistical tools?
a. Data Mining
b. Data Exploration
c. Data Analysis
d. Data Visualization
1.5. Which type of data is generated by POSterminal in a busy supermarket each day?
a. Source
b. Processed
c. Synchronized
d. All the above
2
|
|
3 Page 3 |
▲back to top |
Question 2
State whether the following statements are True or False.
2.1 A model only works with dependent variables.
{1 x 5 = 5 marks)
2.2 Dependent variable represents an outcome.
2.3 Specifying a regression model involves selecting a dependent variable_only.
2.4 The type of dependent variable determines the type of regression, linear or logistic.
2.5 Modelling step creates a representative model inferred from the data.
SECTION B
Question 1
1.1. Define the following concepts:
a. Data Science
b. Data Mining
c. Clustering
d. Classification
e. Machine Learning
1.2. State and describe three (3) main components of Hadoop.
1.3. State the difference between supervised and un-supervised learning.
1.4. State and define the 5 Vs of Big Data.
{10 marks)
(6 marks)
(4 marks)
(10 marks}
3
|
|
4 Page 4 |
▲back to top |
SECTIONC
Question 1
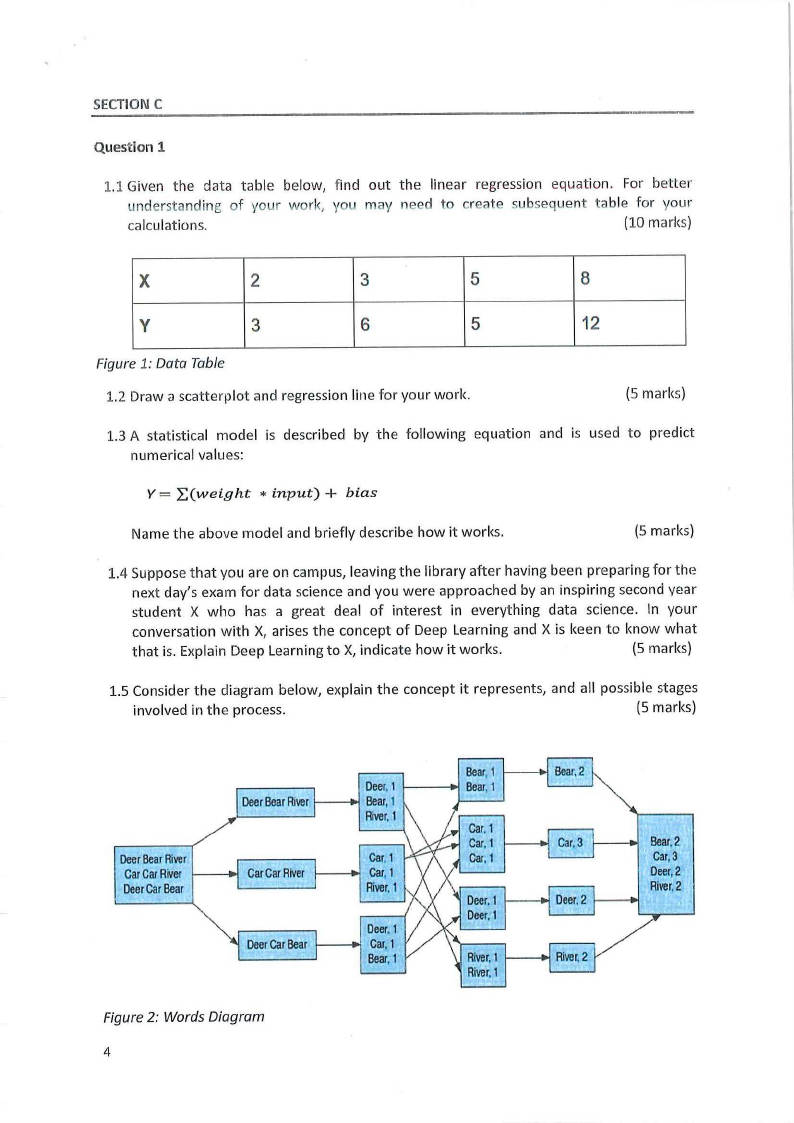
1.1 Given the data table below, find out the linear regression equation. For better
understanding of your work, you may need to create subsequent table for your
calculations.
(10 marks)
X
2
3
5
8
y
3
6
5
12
Figure 1: Data Table
1.2 Draw a scatterplot and regression line for your work.
(5 marks)
1.3 A statistical model is described by the following equation and is used to predict
numerical values:
Y = "'£.(weight *input)+ bias
Name the above model and briefly describe how it works.
(5 marks)
1.4 Suppose that you are on campus, leaving the library after having been preparing for the
next day's exam for data science and you were approached by an inspiring second year
student X who has a great deal of interest in everything data science. In your
conversation with X, arises the concept of Deep Learning and X is keen to know what
that is. Explain Deep Learning to X, indicate how it works.
(5 marks)
1.5 Consider the diagram below, explain the concept it represents, and all possible stages
involved in the process.
(5 marks)
DeeBr eaRr iver
CarCarRiver
DeeCr arBear
DeerBeaRr iver
CarCarRiver
DeerCarBear
Deer1.
Bear1,
River1,
Car1.
Car1,
Rive1r,
Deer1.
Car,1
Bear1,
Figure 2: Words Diagram
4
Bear1
Bear1,
Car1,
Car,1
Car1,
Deer1.
Deer1,
Ftive1r,
River1.
Bear2,
Car,3
Deer2.
Riwr.2
Bear2,
Car,3
Deer2,
Rive2r,