


 |
SQC802S - STATISTICAL QUALITY CONTROL - 1ST OPP - NOVEMBER 2023 |
|
|
1 Page 1 |
▲back to top |
nAml BIA UnlVERSITY
OF SCIEnCE AnDTECHnOLOGY
FacultyofHealthN, atural
ResourceasndApplied
Sciences
Schoool f NaturalandApplied
Sciences
Departmentof Mathematics.
StatisticsandActuarialScience
13JacksonKaujeuaStreet
Private Bag13388
Windhoek
NAMIBIA
T: +264612072913
E: msas@nust.na
W: www.nust.na
I QUALIFICATION:
QUALIFICATION
I CODE:
I COURSE:
I DATE:
I DURATION:
BACHELOR OF SCIENCE HONOURS IN APPLIED MATHEMAT-1
ICS AND STATISTICS
0SBSHS
I LEVEL: 8
I
STATISTICAL QUALITY CONTROL
NOVEMBER 2023
3 HOURS
I I COURSE SQC802S
CODE:
I SESSION: 1
I
I MARKS: 100
I
FIRST OPPORTUNITY
I EXAMINER
I MODERATOR
EXAMINATION
QUESTION PAPER
I Dr. Jacob Ong'ala
I Dr Isak Neema
INSTRUCTION
1. Answer all questions on the separate answer sheet.
2. Please write neatly and legibly.
3. Do not use the left side margin of the exam paper. This must be allowed for the examiner.
4. No books, notes and other additional aids are allowed.
5. Mark all answers clearly with their respective question numbers.
PERMISSIBLE MATERIALS
1. Non-Programmable Calculator
ATTACHEMENTS
1. Factors for calculation of control charts
2. Normal distribution centered at the target (T)
3. Standard Normal Table
THIS QUESTION PAPER CONSISTS OF 4 PAGES (including the front page)
1
|
|
2 Page 2 |
▲back to top |
QUESTION ONE - 30 MARKS
(a) Select one specific product and one service of your choice, and discuss how the eight dimen-
sions of quality impact its overall acceptance by consumers
[8 mks]
(b) Quality and process improvement occurs most effectively on a project-by-project basis.
DMAIC is a structured five-step problem-solving procedure that can be used to success-
fully complete projects by proceeding through and implementing solutions that are designed
to solve root causes of quality and process problems, and to establish best practices to en-
sure that the solutions are permanent and can be replicated in other relevant business
operations. Explain the five steps in DMAIC process (stating clearly the goalandactivities
in each step)
[10 mks]
(c) State 4 advantages and 2 disadvantages of acceptance sampling
(d) Describe the following sampling plans
(i) single-sampling plan
(ii) Double-sampling plan
(iii) Multiple-sampling plan
QUESTION TWO - 25 MARKS
[6 mks]
[2 mks]
[2 mks]
[2 mks]
(a) Suppose that we have a product (produced under 3-sigma) consisting of an assembly of 100
independent components or parts and all 100 of these parts must be non-defective for the
product to function satisfactorily. What is the probability that any specific unit of product
is non-defective
[3 mks]
(b) Why would a typical automobile company manufacturing particular vehicles with about
100,000 components each use six-sigma instead of five-sigma for assessing their quality per-
formance?
[5 mks]
(c) Consider the Shewhart .r control chart with two-sigma limits
(i) Find the probability that a single point falls outside the limits when the process is in
control
[2 mks]
(ii) what sample number will produce an out-of control signal
[2 mks]
(iii) Calculate the standard deviation of the average run length
[2 mks]
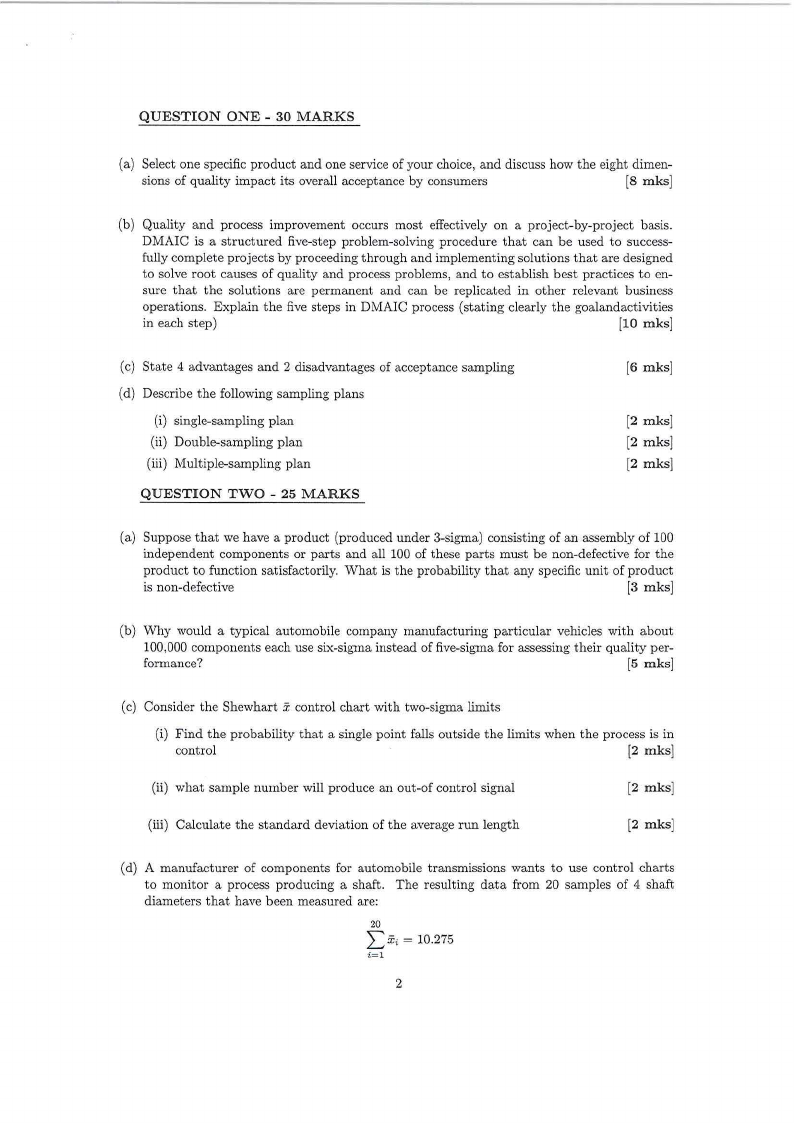
(d) A manufacturer of components for automobile transmissions wants to use control charts
to monitor a process producing a shaft. The resulting data from 20 samples of 4 shaft
diameters that have been measured are:
LXi 20
= 10.275
i=l
2
|
|
3 Page 3 |
▲back to top |
and
:2E0 R;=1.012
i=l
(i) Find the control limits that should be used on the x and R control charts.
[6 mks]
(ii) Find the probability of detecting a shift of 0.80- in thefirst sample if the process is
monitored under 3 sigma.
[3 mks]
(iii) What is the expected number of samples that must be taken before the shift is de-
tected .
[2 mks]
QUESTION THREE - 24 MARKS
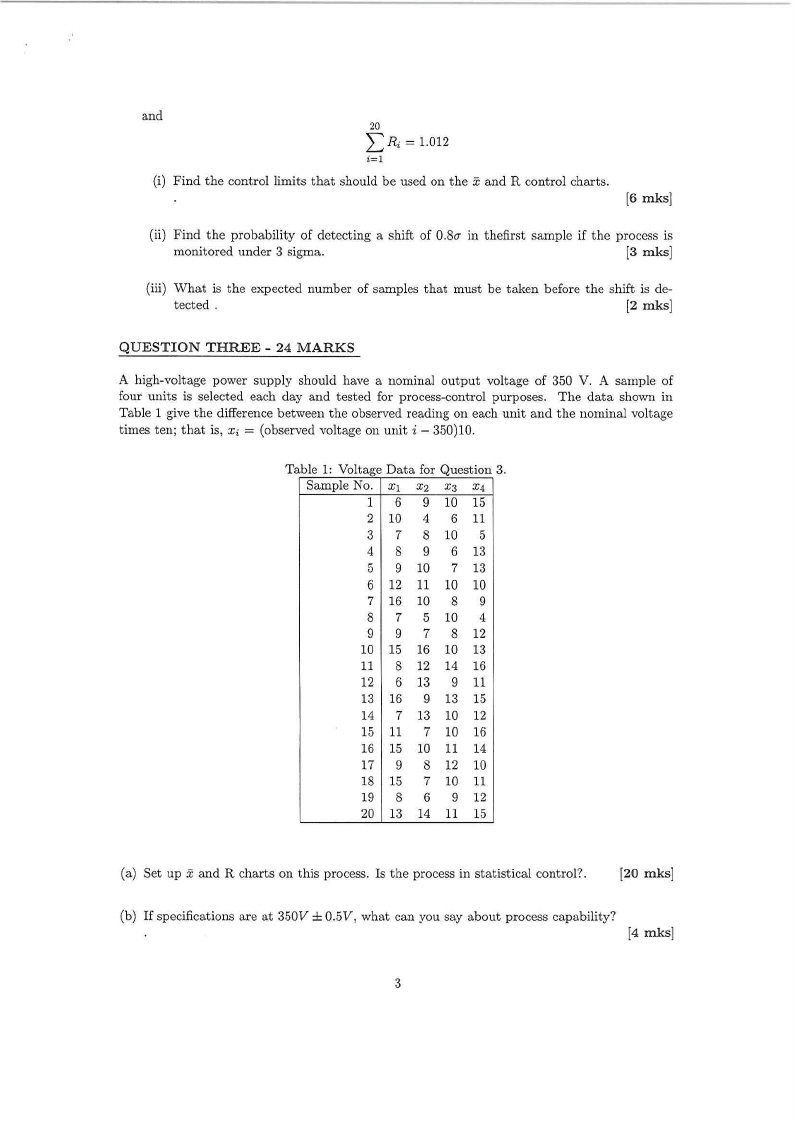
A high-voltage power supply should have a nominal output voltage of 350 V. A sample of
four units is selected each day and tested for process-control purposes. The data shown in
Table 1 give the difference between the observed reading on each unit and the nominal voltage
times ten; that is, x; = (observed voltage on unit 'i - 350)10.
Tabl e 1 ¥ oIta.e;eD ata for Quest1on 3.
Sample No. X1 x2 X3 X4
1 6 9 10 15
2 10 4 6 11
3 7 8 10 5
4 8 9 6 13
5 9 10 7 13
6 12 11 10 10
7 16 10 8 9
8 7 5 10 4
9 9 7 8 12
10 15 16 10 13
11 8 12 14 16
12 6 13 9 11
13 16 9 13 15
14 7 13 10 12
15 11 7 10 16
16 15 10 11 14
17 9 8 12 10
18 15 7 10 11
19 8 6 9 12
20 13 14 11 15
(a) Set up x and R charts on this process. Is the process in statistical control?.
[20 mks]
(b) If specifications are at 350V ± 0.5V, what can you say about process capability?
[4 mks]
3
|
|
4 Page 4 |
▲back to top |
QUESTION FOUR - 21 MARKS
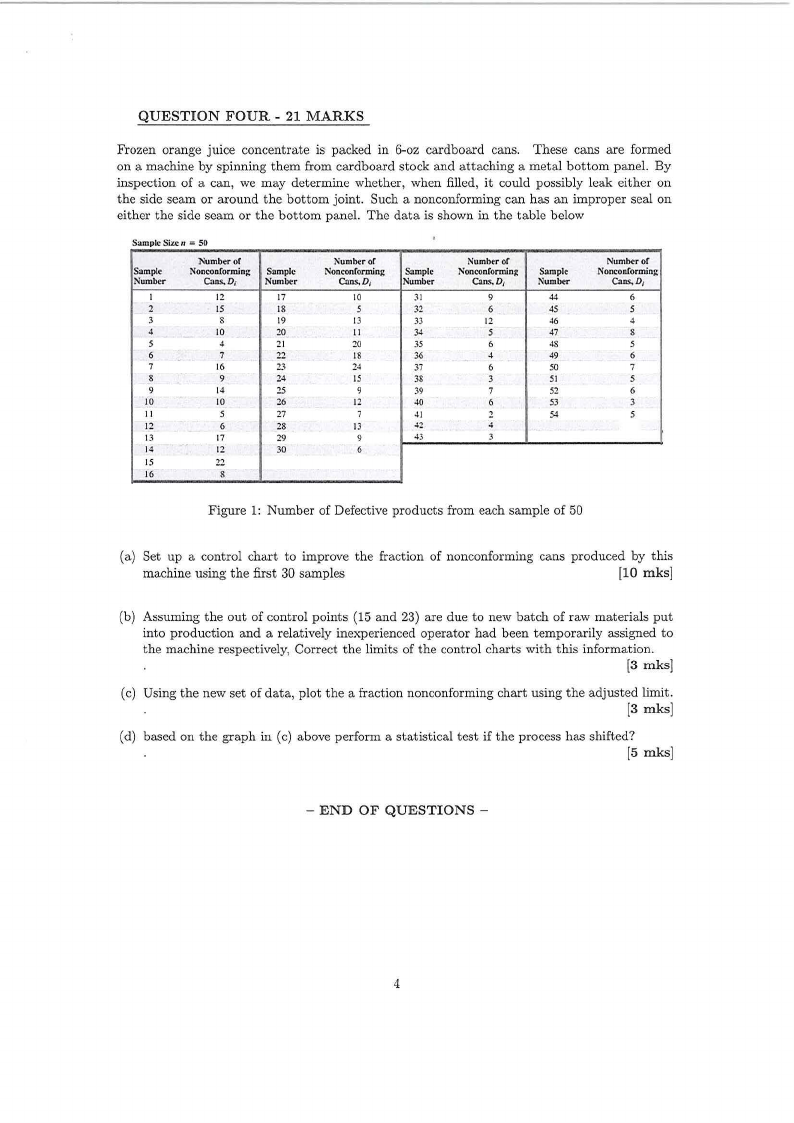
Frozen orange juice concentrate is packed in 6-oz cardboard cans. These cans are formed
on a machine by spinning them from cardboard stock and attaching a metal bottom panel. By
inspection of a can, we may determine whether, when filled, it could possibly leak either on
the side seam or around the bottom joint. Such a nonconforming can has an improper seal on
either the side seam or the bottom panel. The data is shown in the table below
= Sample Size n 50
Sample
Number
l
2
3
4
5
6
7
8
9
JO
II
12
13
14
15
16
Number of
Nonconforming
Cans.D,
12
15
8
10
4
7
16
9
14
10
5
6
17
12
22
8
Sample
Number
17
18
19
20
21
22
23
24
25
26
27
28
29
30
Number of
Nonconforming
Cans.D 1
10
5
13
11
20
18
24
15
9
12
7
13
9
6
Sample
Number
31
32
33
34
35
36
37
38
39
40
41
-12
-13
Number or
Nonconforming
Cans,D,
9
6
12
5
6
4
6
3
7
6
2
-I
3
Sample
Number
44
45
46
47
48
49
50
51
52
53
54
Number or
Nonconforming
Can.s,D1
6
5
4
s
5
6
7
5
6
3
5
Figure 1: Number of Defective products from each sample of 50
(a) Set up a control chart to improve the fraction of nonconforming cans produced by this
machine using the first 30 samples
[10 mks]
(b) Assuming the out of control points (15 and 23) are due to new batch of raw materials put
into production and a relatively inexperienced operator had been temporarily assigned to
the machine respectively, Correct the limits of the control charts with this information.
[3 mks]
(c) Using the new set of data, plot the a fraction nonconforming chart using the adjusted limit.
[3 mks]
(d) based on the graph in (c) above perform a statistical test if the process has shifted?
[5 mks]
- END OF QUESTIONS -
4
|
|
5 Page 5 |
▲back to top |
·-·---------------..-.·----------------
Churt rorA,·rnag~
0111rt for Stund.urdlkvlutiou."
Ob>crvutlons Fuctorsror
,, ", In
Sumplc.n
Control Llmll•
A,
!.l~I !.SSO 2.659
3 1.732 1.0~ 1.954
J
1.500 0.7~9 t.628
s 1.3J2 0.577 1.427
6 1.1:?S 0.4S3 1.287
7 1.134 0.419 1.182
8 1.061 0.373 1.099
9 1.000 0.3n 1.032
10 0.949 0.308 0.975
JI 0.905 0.:?85 0.927
12 0,'!66 0.266 0.886
13 0.832 0.2J9 o.sso
14 0.802 o.:35 0.817
IS 0.775 0~3 0.789
16 0.750 0.21:? 0.763
17 0.728 o.w:i 0.739
18 0.707 0.19-1 0.718
19 0,688 0.1~7 0.698
20 0.671 0.IXO 0.680
21 0.6SS 0.173 0.663
0.6-10 0.167 0.647
23 0.626 0.162 0.633
2-l 0.612 0.157 0.619
:?S 0.600 0.153 0.606
Focton:for
Center Unc
<,
1/c4
0.7979 1.2533
0.8S62 l.1~8J
0.9213 I .OSS-1
0.9-100 1.0638
0.9515 1.0510
0.959-1 1.0423
0.%50 1.0363
0.9693 1.0317
o.9n1 1.0281
0.97SJ 1.0:52
0.9776 1.0229
0.9794 1.0210
0,98IO 1.019-1
0.9S.23 1.0180
0.9835 l.016S
0.98-IS 1.0157
0.985-: I.OIJ8
0.986: 1.0140
0.9869 1.0133
U.9876 1.0126
0.9882 1.0119
0.9887 1.0114
0.9~9:? 1.0109
0.9896 !.OIOS
Fuctun:fur ControlUmib
n, n, n, n.
0
3.267 0
~.606
0
2.568 0
:!..176
0
.2.::?66 ()
:!.OS~
0
2.069 0
1.964
0.030 1.970 0.029 l.87J
0.118 1.882 0,113 1.K06
0.185 I.SIS 0.179 1.751
0.239 1.761 0.2'.t! 1.707
0.284 1.716 0.276 1.669
0.321 1.679 0313 1.637
0354 1.646 O.JJ6 1.610
0.382 1.618 0,37-l 1.585
0.J06 1.59-1 0.3'>'1 1.563
0.--l.:!M1.572 0.4.:!I I.S-1-l
0.JJ8 I.SS:! O.-l-10 1526
0.-166 1.S.l-1 0.J58 I.SIi
0.-182 I.SI& 0.-175 1.-196
0.-197 1.503 0.-l\\lO 1.483
0.51() J.J')O 11.SOJ 1.470
0.523 1.-177 0516
0.SJ4 1.-166 0.52X 1.-1'18
0.545 1.-155 0.539 1.-138
0.555 1.JJ5 0.5-19 IA:!9
0.565 1.-135 0.559 I.J20
Fiu:torsfor
C'!nkrUoc-
d,
lld,
1.128 0.8865
1.69':- 0.5\\1()7
::?.05-9 0.4857
2.:t26 0.4299
2.SJJ 039-16
2.704 03698
2.8J7 0.3512
:?.970 03367
3.078 0.32J9
3.173 03152
3.2SS 0.3069
3-136 0~8
3.-107 0.:?935
3.472 0.2Sls0
3.532 o.:&31
3.588 0.2787
3.6-lO 0.27-17
3.689 0.2711
3.i35 0.2677
3.778 0.1647
3.819 0.2618
3.858 0.:?592
3.,'95 0.2567
3.9.11 0~
Churt for R.ancc.-s
Ful'10Nfe>l'Control UmiL-.
d_, o, o, o, D,
0.853 0
o.xss ()
0.8SO 0
0,864 0
3.686 0
4.JSS 0
4.6?8 0
J.918 0
3.267
:?.574
.2.:!8.2
2.1 IJ
0.8-18 0
5.078 0
2.QO.I
0.833 0""04 5.2().1 0.076 1.924
0.8W 0.388 5.306 0.136 1.864
0.808 05J7 S.393 0.1114 1.Xl6
0.797 0.687 S.469 0.~1 1.777
0.787 0.811 5.S3S 0.256 1.74-l
0.778 0.922 5.59-1 0.183 1.717
0.770 1.025 5.647 0_\\07 1.693
0.763 1.118 S.696 0.3::!~ 1.672
0.756 1.W3 5.741 0.3J7 1.653
0.750 l.:!:S:? 5.782 0_'63 1.637
0.74-l 1.356 5.820 0.378 1.6::!:!
0.739 l.-l24 S.856 0.391 1.608
0.734 1.-187 5.891 O.-I03 1.597
0.7::?9 1.549 5.9'.!:1 0.-115 1.585
0,72-l 1.605 5.951 0.4:!.5 1575
0.7:?0 1.659 5.979 0.434 1.566
0.716 1.710 6.006 0,JJ3 1.557
0.11: 1.759 6.031 0.-151 1.548
0.70ii 1.806 6.056 OAS9 1.541
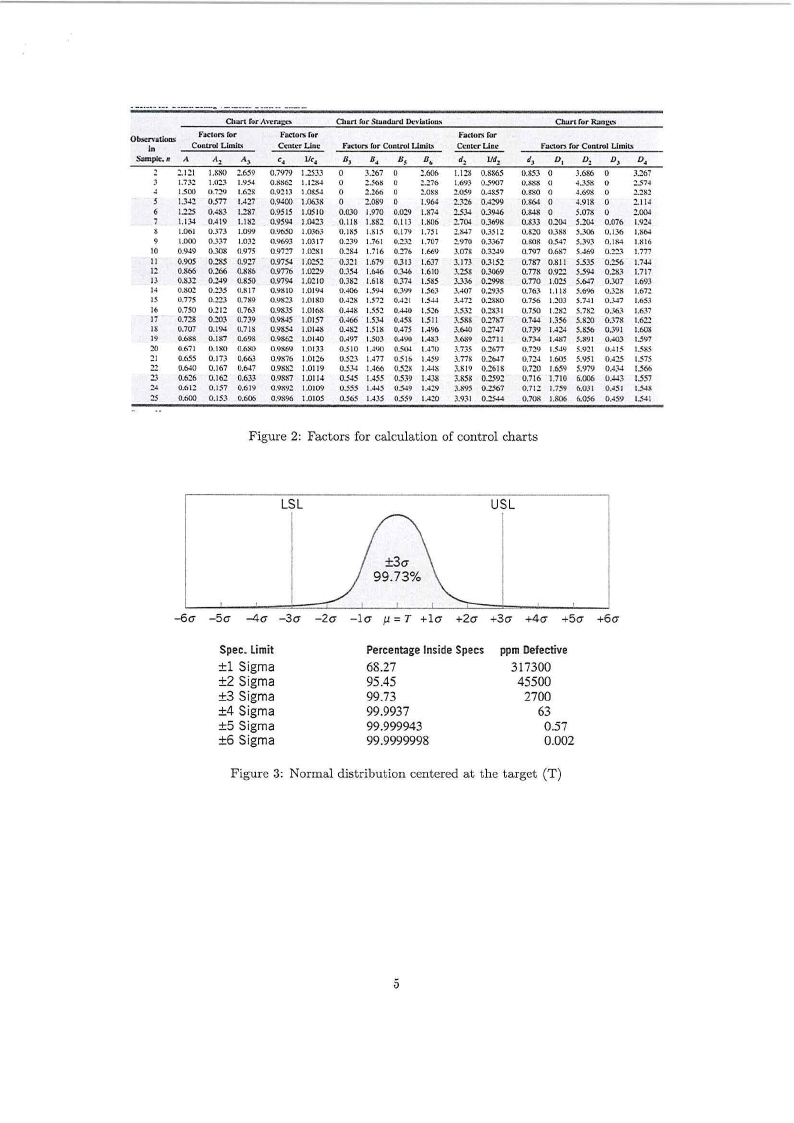
Figure 2: Factors for calculation of control charts
LSL
USL
-6er -Ser --4er -3er -2er -ler µ = T +ler +2er +3er +4er +Ser +6er
Spec. Limit
±1 Sigma
±2 Sigma
±3 Sigma
±4 Sigma
±5 Sigma
±6 Sigma
PercentageInside Specs
68.27
95.45
99.73
99.9937
99.999943
99.9999998
ppm Defective
317300
45500
2700
63
0.57
0.002
Figure 3: Normal distribution centered at the target (T)
5
|
|
6 Page 6 |
▲back to top |
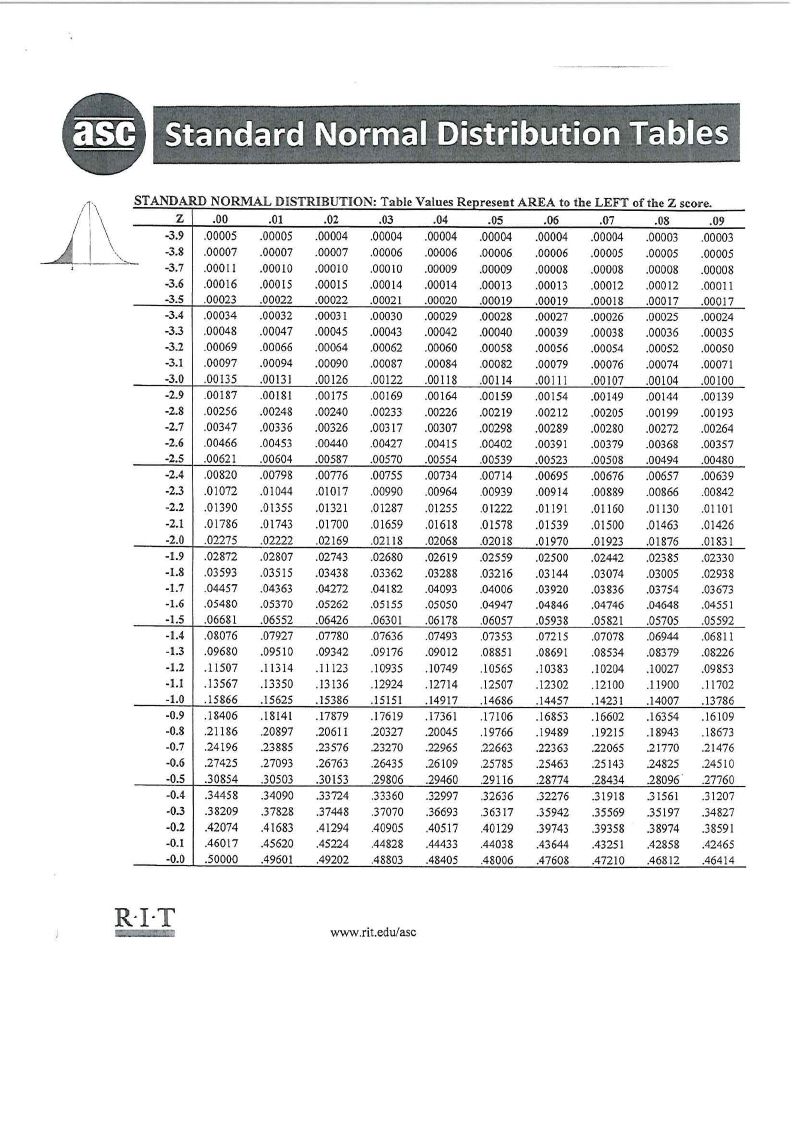
Standard Normal Distribution Tab,es
ARDNO RMAL DISTRIBUTION: Table Values Represent AREA to the LEFT of the Z score.
z .00
.01
.02
.03
.04
.OS
.06
.07
.08
.09
-3.9 .00005 .00005 .00004 .00004 .00004 .00004 .00004 .00004 .00003 .00003
-3.8 .00007 .00007 .00007 .00006 .00006 .00006 .00006 .00005 .00005 .00005
-3.7 .OOO1l .00010 .00010 .00010 .00009 .00009 .00008 .00008 .00008 .00008
-3.6 .00016 .00015 .00015 .00014 .00014 .00013 .00013 .00012 .00012 .0001 l
-3.5 .00023 .00022 .00022 .00021 .00020 .00019 .00019 .00018 .00017 .00017
-3.4 .00034 .00032 .00031 .00030 .00029 .00028 .00027 .00026 .00025 .00024
-3.3 .00048 .00047 .00045 .00043 .00042 .00040 .00039 .00038 .00036 .00035
-3.2 .00069 .00066 .00064 .00062 .00060 .00058 .00056 .00054 .00052 .00050
-3.1 .00097 .00094 .00090 .00087 .00084 .00082 .00079 .00076 .00074 .00071
-3.0 .00135 .0013] .00126 .00122 .00118 .00114 .00111 .00107 .00104 .00100
-2.9 .00187 .00181 .00175 .00169 .00164 .00159 .00154 .00149 .00144 .00139
-2.8 .00256 .00248 .00240 .00233 .00226 .00219 .00212 .00205 .00199 .00193
-2.7 .00347 .00336 .00326 .00317 .00307 .00298 .00289 .00280 .00272 .00264
-2.6 .00466 .00453 .00440 .00427 .00415 .00402 .00391 .00379 .00368 .00357
-2.5 .00621 .00604 .00587 .00570 .00554 .00539 .00523 .00508 .00494 .00480
-2.4 .00820 .00798 .00776 .00755 .00734 .00714 .00695 .00676 .00657 .00639
-2.3 .Gl072 .01044 .01017 .00990 .00964 .00939 .00914 .00889 .00866 .00842
-2.2 .01390 .01355 .01321 .01287 .01255 .01222 .01191 .01160 .01130 .01101
-2.1 .01786 .01743 .01700 .01659 .01618 .01578 .01539 .01500 .01463 .01426
-2.0 .02275 .02222 .02169 .02118 .02068 .02018 .01970 .01923 .01876 .01831
-1.9 .02872 .02807 .02743 .02680 .02619 .02559 .02500 .02442 .02385 .02330
-1.8 .03593 .03515 .03438 .03362 .03288 .03216 .03144 .03074 .03005 .02938
-1.7 .04457 .04363 .04272 .04182 .04093 .04006 .03920 .03836 .03754 .03673
-1.6 .05480 .05370 .05262 .05155 .05050 .04947 .04846 .04746 .04648 .04551
-1.5 .06681 .06552 .06426 .06301 .06178 .06057 .05938 .05821 .05705 .05592
-1.4 .08076 .07927 .07780 .07636 .07493 .07353 .07215 .07078 .06944 .06811
-1.3 .09680 .09510 .09342 .09176 .09012 .08851 .08691 .08534 .08379 .08226
-1.2 .11507 .11314 .11123 .10935 .10749 .10565 .10383 .10204 .10027 .09853
-1.1 .13567 .13350 .13136 .12924 .12714 .12507 .12302 .12100 .11900 .11702
-1.0 .15866 .15625 .15386 .15151 .14917 .14686 .14457 .14231 .14007 .13786
-0.9 .18406 .18141 .17879 .17619 .17361 .17106 .16853 .16602 .16354 .16109
-0.8 .21186 .20897 .20611 .20327 .20045 .19766 .19489 .19215 .18943 .18673
-0.7 .24196 .23885 .23576 .23270 .22965 .22663 .22363 .22065 .21770 .21476
-0.6 .27425 .27093 .26763 .26435 .26109 .25785 .25463 .25143 .24825 .24510
-0.5 .30854 .30503 .30153 .29806 .29460 .29116 .28774 .28434 .28096' .27760
-0.4 .34458 .34090 .33724 .33360 .32997 .32636 .32276 .31918 .31561 .31207
-0.3 .38209 .37828 .37448 .37070 .36693 .36317 .35942 .35569 .35197 .34827
-0.2 .42074 .41683 .41294 .40905 .40517 .40129 .39743 .39358 .38974 .38591
-0.1 .46017 .45620 .45224 .44828 .44433 .44038 .43644 .43251 .42858 .42465
-0.0 .50000 .49601 .49202 .48803 .48405 .48006 .47608 .47210 .46812 .46414
R·I·T
www .rit.edu/asc
|
|
7 Page 7 |
▲back to top |
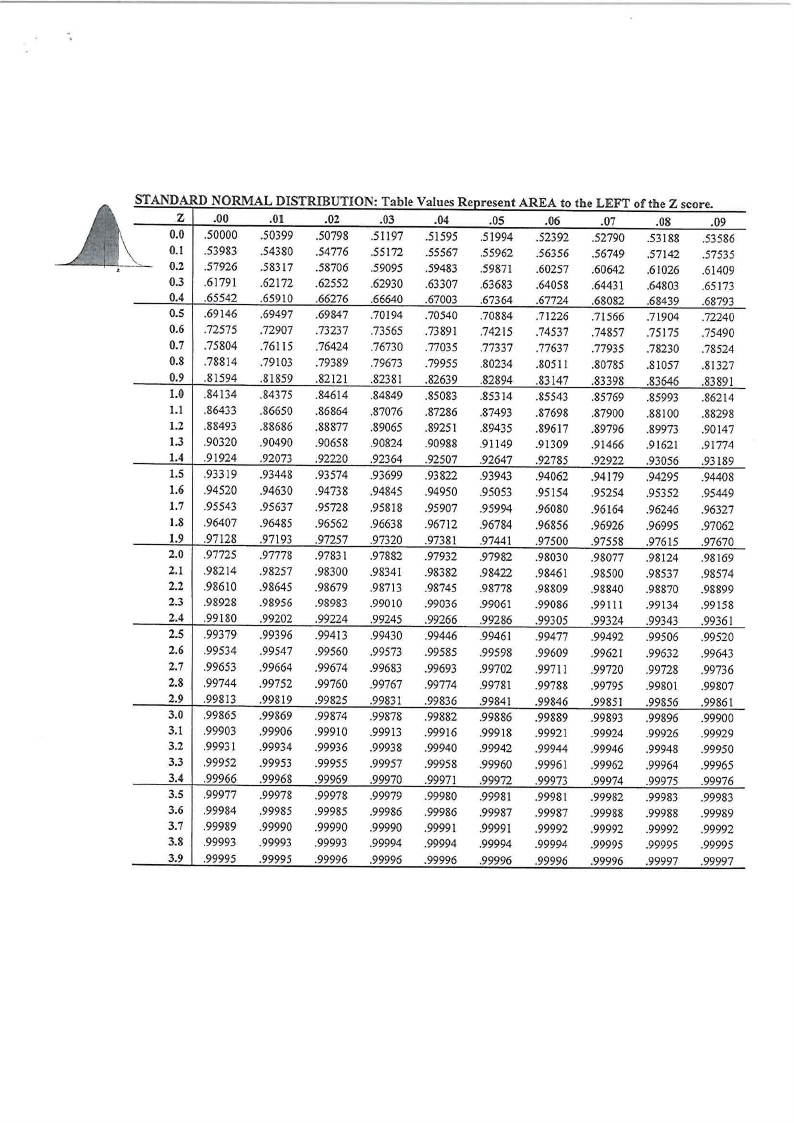
STANDARD NORMAL DISTRIBUTION : Table VaIues Renresent AREA tot he LEFT of the Z score.
z .00
.01
.02
.03
.04
.OS
.06
.07
.08
.09
0.0 .50000 .50399 .50798 .51197 .51595 .51994 .52392 .52790 .53188 .53586
-
0.1 .53983
0.2 .57926
.54380
.58317
.54776
.58706
.55172
.59095
.55567
.59483
.55962
.59871
.56356
.60257
.56749
.60642
.57142
.61026
.57535
.61409
0.3 .61791
0.4 .65542
.62172
.65910
.62552
.66276
.62930
.66640
.63307
.67003
.63683
.67364
.64058
.67724
.6443 l
.68082
.64803
.68439
.65173
.68793
0.5 .69146 .69497 .69847 .70194 .70540 .70884 .71226 .71566 .71904 .72240
0.6 .72575 .72907 .73237 .73565 .73891 .74215 .74537 .74857 .75175 .75490
0.7 .75804 .76 l 15 .76424 .76730 .77035 .77337 .77637 .77935 .78230 .78524
0.8 .78814 .79103 .79389 .79673 .79955 .80234 .80511 .80785 .81057 .81327
0.9 .81594 .81859 .82121 .82381 .82639 .82894 .83147 .83398 .83646 .83891
1.0 .84134 .84375 .84614 .84849 .85083 .85314 .85543 .85769 .85993 .86214
1.) .86433 .86650 .86864 .87076 .87286 .87493 .87698 .87900 .88100 .88298
1.2 .88493 .88686 .88877 .89065 .89251 .89435 .89617 .89796 .89973 .90147
1.3 .90320 .90490 .90658 .90824 .90988 .91149 .91309 .91466 .91621 .91774
1.4 .91924 .92073 .92220 .92364 .92507 .92647 .92785 .92922 .93056 .93189
1.5 .93319 .93448 .93574 .93699 .93822 .93943 .94062 .94179 .94295 .94408
1.6 .94520 .94630 .94738 .94845 .94950 .95053 .95154 .95254 .95352 .95449
1.7 .95543 .95637 .95728 .95818 .95907 .95994 .96080 .96164 .96246 .96327
1.8 .96407 .96485 .96562 .96638 .96712 .96784 .96856 .96926 .96995 .97062
1.9 .97128 .97193 .97257 .97320 .97381 .97441 .97500 .97558 .97615 .97670
2.0 .97725 .97778 .97831 .97882 .97932 .97982 .98030 .98077 .98124 .98169
2.1 .98214 .98257 .98300 .98341 .98382 .98422 .98461 .98500 .98537 .98574
2.2 .98610 .98645 .98679 .98713 .98745 .98778 .98809 .98840 .98870 .98899
2.3 .98928 .98956 .98983 .99010 .99036 .99061 .99086 .99111 .99134 .99158
2.4 .99180 .99202 .99224 .99245 .99266 .99286 .99305 .99324 .99343 .99361
2.5 .99379 .99396 .99413 .99430 .99446 .99461 .99477 .99492 .99506 .99520
2.6 .99534 .99547 .99560 .99573 .99585 .99598 .99609 .99621 .99632 .99643
2.7 .99653 .99664 .99674 .99683 .99693 .99702 .99711 .99720 .99728 .99736
2.8 .99744 .99752 .99760 .99767 .99774 .99781 .99788 .99795 .99801 .99807
2.9 .99813 .99819 .99825 .99831 .99836 .99841 .99846 .99851 .99856 .99861
3.0 .99865 .99869 .99874 .99878 .99882 .99886 .99889 .99893 .99896 .99900
3.1 .99903 .99906 .99910 .99913 .99916 .99918 .99921 .99924 .99926 .99929
3.2 .9993 I .99934 .99936 .99938 .99940 .99942 .99944 .99946 .99948 .99950
3.3 .99952 .99953 .99955 .99957 .99958 .99960 .99961 .99962 .99964 .99965
3.4 .99966 .99968 .99969 .99970 .99971 .99972 .99973 .99974 .99975 .99976
3.5 .99977 .99978 .99978 .99979 .99980 .99981 .99981 .99982 .99983 .99983
3.6 .99984 .99985 .99985 .99986 .99986 .99987 .99987 .99988 .99988 .99989
3.7 .99989 .99990 .99990 .99990 .99991 .99991 .99992 .99992 .99992 .99992
3.8 .99993 .99993 .99993 .99994 .99994 .99994 .99994 .99995 .99995 .99995
3.9 .99995 .99995 .99996 .99996 .99996 .99996 .99996 .99996 .99997 .99997