


 |
RME620S - BASIC RESEARCH METHODOLOGY - 2ND OPP - JUNE 2024 |
|
|
1 Page 1 |
▲back to top |
n Am I BI A u n I VE RS ITV
OF SCIEnCE Ano TECHnOLOGY
FACULTYOF HEALTH,NATURAL RESOURCESAND APPLIEDSCIENCES
DEPARTMENT OF AGRICULTURAL SCIENCES AND AGRIBUSINESS
QUALIFICATION: BACHELOR OF SCIENCE IN AGRICULTURE
QUALIFICATION CODE: 07BAGA
LEVEL: 7
COURSE CODE: RME620S
COURSE NAME: BASICRESEARCHMETHODOLOGY
DATE: JULY 2024
DURATION: 3 HOURS
MARKS: 100
SECONDOPPORTUNITY/ SUPPLEMENTARYEXAMINATION QUESTION PAPER
EXAMINER{S) Dr Thinah Moyo
MODERATOR: Dr Tendai Nzuma
INSTRUCTIONS
1. Answer ALL five (5) questions.
2. Please write neatly and legibly.
3. Number the answers clearly.
4. Show all your working.
PERMISSIBLEMATERIALS
1. Examination question paper
2. Answer book
3. Calculators
THIS QUESTION PAPER CONSISTS OF 4 PAGES (Including this front page)
1
|
|
2 Page 2 |
▲back to top |
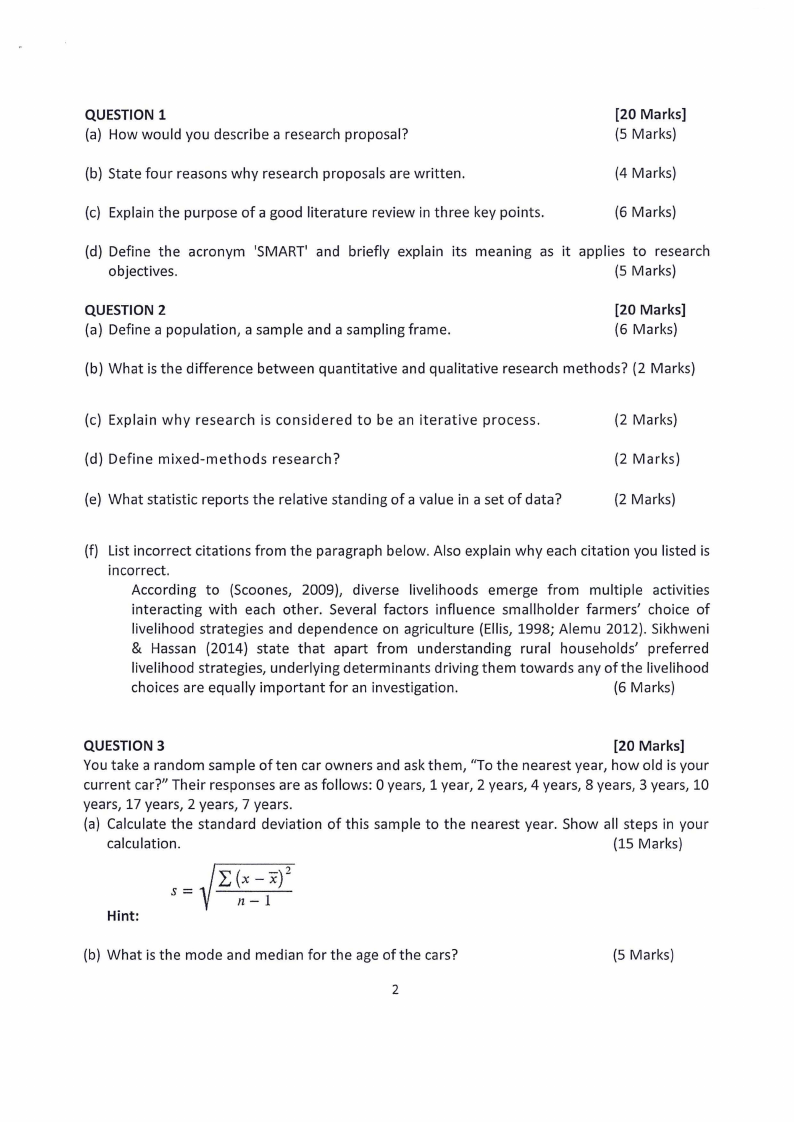
QUESTION 1
(a) How would you describe a research proposal?
[20 Marks]
(5 Marks)
(b) State four reasons why research proposals are written.
(4 Marks)
(c) Explain the purpose of a good literature review in three key points.
(6 Marks)
(d) Define the acronym 'SMART' and briefly explain its meaning as it applies to research
objectives.
(5 Marks)
QUESTION 2
(a) Define a population, a sample and a sampling frame.
[20 Marks]
(6 Marks)
(b) What is the difference between quantitative and qualitative research methods? (2 Marks)
(c) Explain why research is considered to be an iterative process.
(d) Define mixed-methods research?
(e) What statistic reports the relative standing of a value in a set of data?
(2 Marks)
(2 Marks)
(2 Marks)
(f) List incorrect citations from the paragraph below. Also explain why each citation you listed is
incorrect.
According to (Scoones, 2009), diverse livelihoods emerge from multiple activities
interacting with each other. Several factors influence smallholder farmers' choice of
livelihood strategies and dependence on agriculture (Ellis, 1998; Alemu 2012). Sikhweni
& Hassan (2014) state that apart from understanding rural households' preferred
livelihood strategies, underlying determinants driving them towards any of the livelihood
choices are equally important for an investigation.
(6 Marks)
QUESTION 3
[20 Marks]
You take a random sample of ten car owners and ask them, "To the nearest year, how old is your
current car?" Their responses are as follows: 0 years, 1 year, 2 years, 4 years, 8 years, 3 years, 10
years, 17 years, 2 years, 7 years.
(a) Calculate the standard deviation of this sample to the nearest year. Show all steps in your
lL(, calculation.
s=
X - X)'
(15 Marks)
n-1
Hint:
(b) What is the mode and median for the age of the cars?
(5 Marks)
2
|
|
3 Page 3 |
▲back to top |

QUESTION 4
[20 Marks]
(a) A Real Estate Agent tells you that the average cost of houses in a town is NAD2,176,000. You
want to know how much the prices of the houses may vary from this average. What
measurement do you need?
(2 Marks)
A. standard deviation
B. interquartile range
C. variance
D. percentile
(b) To the nearest thousandth, what is the mean of the following data set? 0.003, 0.045, 0.58,
0.687, 1.25, 10.38, 11.252, 12.001
(2 Marks)
(c) To the nearest tenth, what is the median of the following data set? 18, 21, 17, 18, 16, 15.5,
12, 17, 10, 21, 17.
·
(2 Marks)
(d) Define a percentile.
(2 Marks)
(e) Identify which of the following options is a quantitative variable and explain why.(2 Marks)
A. the colour of an automobile
B. a person's region of residence
C. a person's postal code
D. a person's height, recorded in centimetres
E. choices (C) and (D)
(f) From the scenario in (e) above, which variables are qualitative and why?
A. the colour of an automobile
B. a person's region of residence
C. a person's postal code
(6 Marks)
(g) You took a survey of 100 people and found that 60% of them like chocolate and 40% do not.
Which of the following results presentations gives the distribution of the "chocolate versus no
chocolate" variable?
(4 Marks)
A. a table of the results
B. a pie chart of the results
C. a bar graph of the results
D. a sentence describing the results
E. all of the above
QUESTION 5
(a) State and describe 5 common data distribution patterns in statistics.
[20 Marks]
(10 Marks)
(b) If the formula for a regression line is y= 9x + 17. Describe the components of this line and the
interpretation thereof.
(5 Marks)
3
|
|
4 Page 4 |
▲back to top |
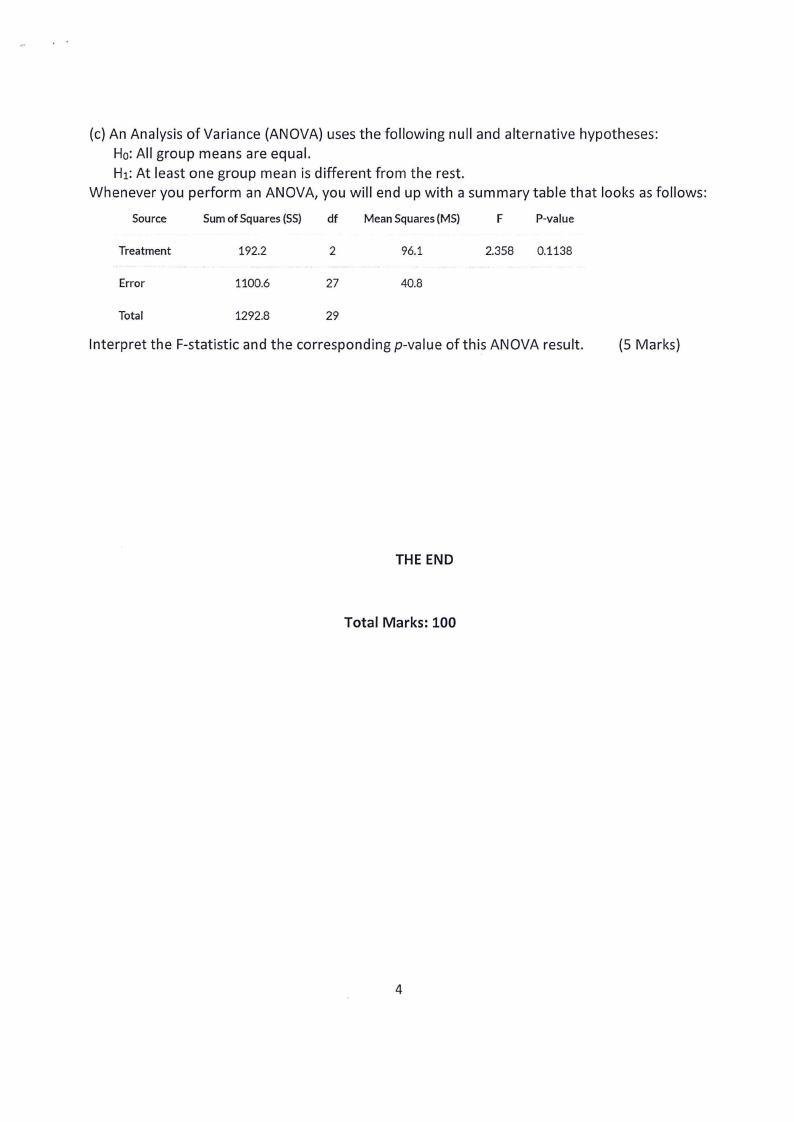
(c) An Analysis of Variance (ANOVA) uses the following null and alternative hypotheses:
Ho:All group means are equal.
H1:At least one group mean is different from the rest.
Whenever you perform an ANOVA, you will end up with a summary table that looks as follows:
Source
Sumof Squares(SS) df Mean Squares (MS)
F
P-value
Treatment
192.2
2
96.1
2.358 0.1138
Error
1100.6
27
40.8
Total
1292.8
29
Interpret the F-statistic and the corresponding p-value of this ANOVA result.
(5 Marks)
THE END
Total Marks: 100
4