


 |
SIN601S - STATISTICAL INFERENCE 2 - 2ND -JANUARY 2025 |
|
|
1 Page 1 |
▲back to top |

nAmt BIA UntVERS ITY
OF SCIEnCE Ano TECHnOLOGY
FacultyofHealth,Natural
ResourceasndApplied
Sciences
Schoool f NaturalandApplied
Sciences
Departmentof Mathematics,
StatisticsandActuarialScience
13JacksonKaujeuaStreet
Private Bag13388
Windhoek
NAMIBIA
T: +264612072913
E: msas@nust.na
W: www.nust.na
QUALIFICATION: BACHELOR of SCIENCE IN APPLIED MATHEMATICS AND STATISTICS
QUALIFICATION CODE: 07BSAM
COURSE:STATISTICAL INFERENCE 2
LEVEL:6
COURSECODE: SIN601S
DATE: JANUARY 2025
DURATION: 3 HOURS
SESSION: 1
MARKS: 100
SECOND OPPORTUNITY/ SUPPLEMENTARY: EXAMINATION QUESTION PAPER
EXAMINER:
MODERATOR:
Dr J MWANYEKANGE
Dr D. B. GEMECHU
INSTRUCTIONS:
1. Answer all questions on the separate answer sheet.
2. Write your answers neatly and legibly.
3. Do not use the left side margin of the exam paper. This must be allowed for the examiner.
4. No books, notes and other additional aids are allowed.
5. Mark all answers clearly with their respective question numbers.
PERMISSIBLE MATERIALS
1. Non-Programmable Calculator without a cover
ATTACHEMENTS
1. Z table
2. Chi-square and t table
This paper consists of 3 pages including this front page
|
|
2 Page 2 |
▲back to top |
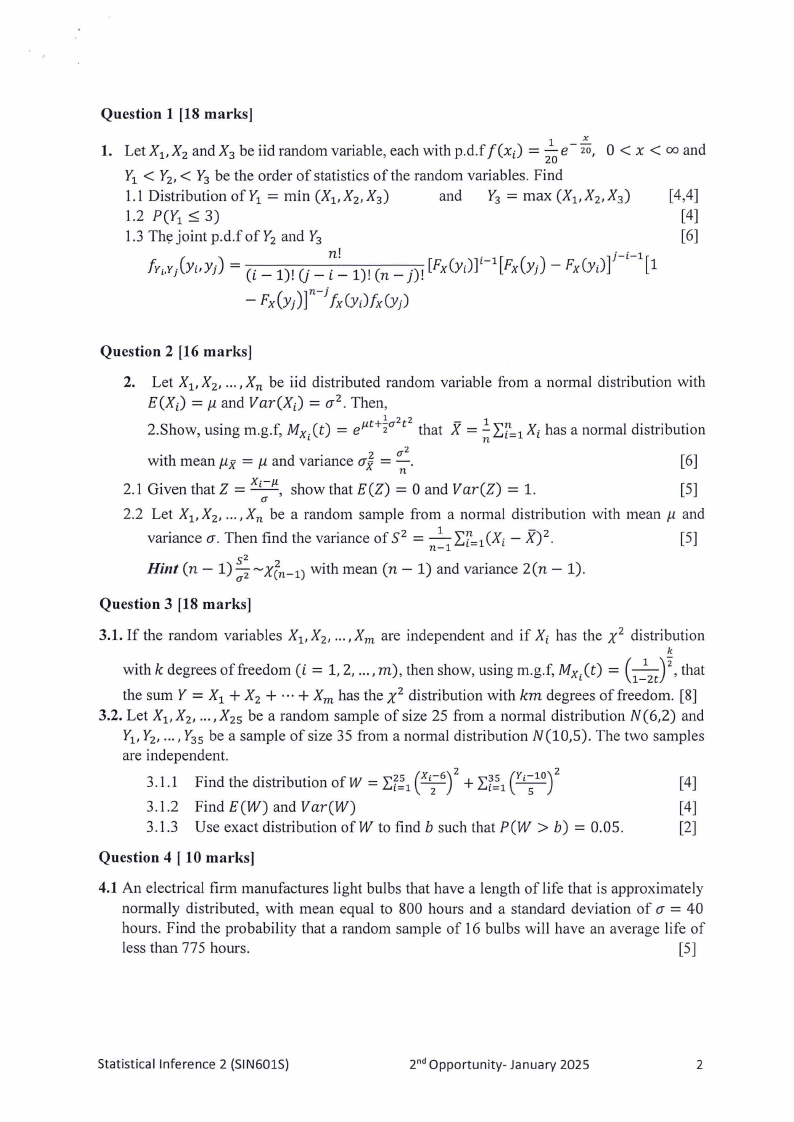
Question 1 [18 marks]
:0, 1.
Let Xi, X2 and X3 be iid random variable, each with p.d.f f (xa
= 2..e-
20
0 < x < oo and
Y1 < Y2 , < Y3 be the order of statistics of the random variables. Find
1.1 Distribution ofY1 = min (Xi,X 2 ,X 3 )
and Y3 = max (Xi,X 2 ,X 3 )
[4,4]
1.2 P(Y1 :::;;3)
[4]
u-;~ 1.3 Th~ joint p.d.f of Y2 and Y3
fY;,Y/Yi,Yj) = (i -1)!
1
1)! (n _ j)! [Fx(yJ]i-l[Fx(Yj) - Fx(yi)f-i- [1
[6]
- Fx(Yj)r-j fx(YJfx(yj)
Question 2 [16 marks]
2. Let X1, X2 , ... , Xn be iid distributed random variable from a normal distribution with
E(Xi) =µand Var(Xi) = a 2 . Then,
2.Show, using m.g.f, Mx., (t)
=
1
eµt+za
22
t that
X
=
1
-n
Li--i Xi
has
a
normal
distribution
2
with mean µx =µand variance a} = ~n-
[6]
2.1 Given that Z = xi-µ' show that E(Z) = 0 and Var(Z) = 1.
[5]
a
2.2 Let Xi, X2, ••• , Xn be a random sample from a normal distribution with mean µ and
1 variance
a. Then find the variance
of S 2
=
- 1-Z:
n-1
=1 (Xi
-
X) 2 .
[5]
Hint (n - 1) ;: ~x[n-l)with mean (n - 1) and variance 2(n - 1).
Question 3 [18 marks]
3.1. If the random variables Xi, X2 , ... , Xm are independent and if Xi has the x2 distribution
k
with k degrees of freedom (i = 1, 2, ... , m), then show, using m.g.f, Mx.(t)
!
= (-1-21t-)
2, that
the sum Y = X1 + X2 + ...+ Xm has the x 2 distribution with km degrees of freedom. [8]
3.2. Let Xi, X2, .•. , X25 be a random sample of size 25 from a normal distribution N (6,2) and
Yi, Y2, ... , Y35 be a sample of size 35 from a normal distribution N(l0,5). The two samples
are independent.
(x;;)2 }2 3.1.1 Find the distribution of W = If! 1
It! 6 +
10
1 (Y;~
[4]
3.1.2 Find E(W) and Var(W)
[4]
3.1.3 Use exact distribution of W to find b such that P(W > b) = 0.05.
[2]
Question 4 [ 10 marks]
4.1 An electrical firm manufactures light bulbs that have a length of life that is approximately
normally distributed, with mean equal to 800 hours and a standard deviation of a = 40
hours. Find the probability that a random sample of 16 bulbs will have an average life of
less than 775 hours.
[5]
Statistical Inference 2 (SIN601S)
2nd Opportunity- January 2025
2
|
|
3 Page 3 |
▲back to top |
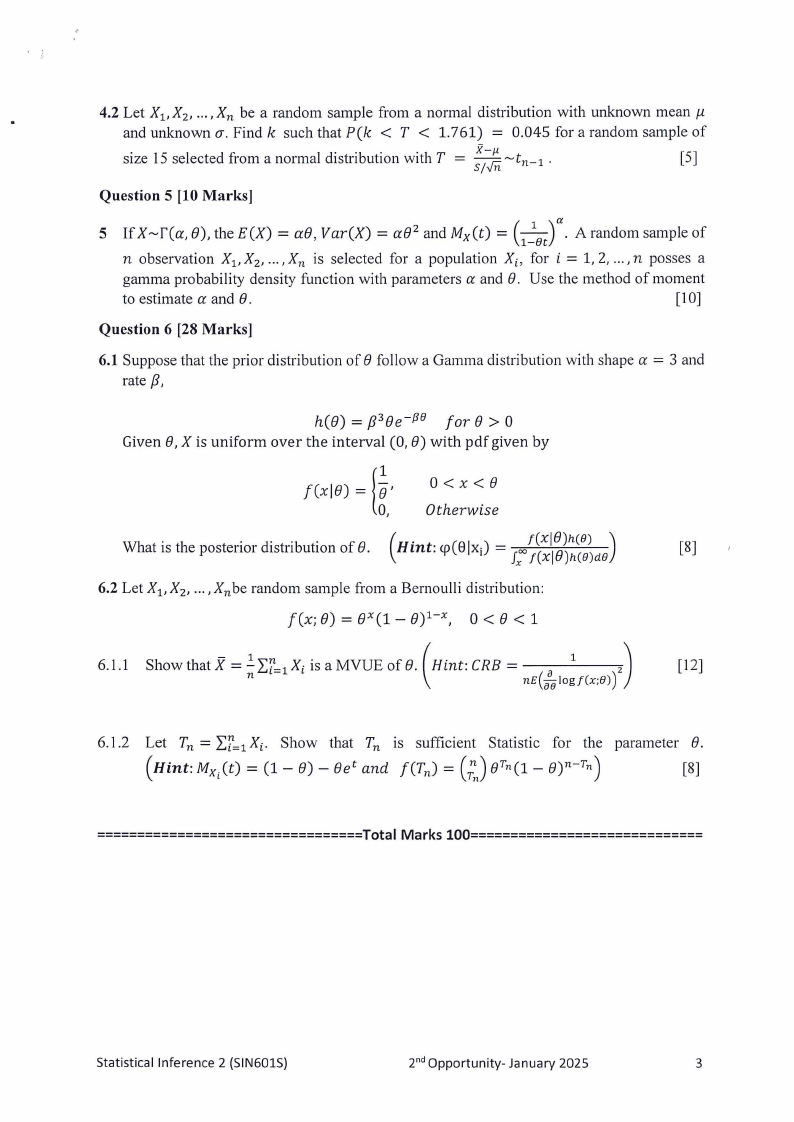
4.2 Let Xi, X2, •.• , Xn be a random sample from a normal distribution with unknown mean µ
and unknown a. Find k such that P(k < T < 1.761) = 0.045 for a random sample of
size 15 selected from a normal distribution with T
x-µ
-s~;-t Jn n-1 ·
[5]
Question 5 [10 Marks]
-)a. 5 If X ~f(a, 0), the E(X) = a0, Var(X) = a0 2 and Mx(t) = (-1-01t
A random sample of
n observation Xi, X2, ••• , X11 is selected for a population Xi, for i = 1, 2, ... , n posses a
gamma probability density function with parameters a and 0. Use the method of moment
to estimate a and 0.
[10]
Question 6 [28 Marks]
6.1 Suppose that the prior distribution of 0 follow a Gamma distribution with shape a = 3 and
rate {3,
h(0) = f33 0e-P 0 for 0 > 0
Given 0, Xis uniform over the interval (0, 0) with pdf given by
!¼, f(xl0) =
0<x<0
0, Otherwise
What is the posterior distribution of 0. (Hint· · m't' (Slx·1) = Jx"tt((°xxll08))hh((0e))de )
[8]
6.2 Let Xi, X2 , .•. , Xnbe random sample from a Bernoulli distribution:
f(x; 0) = 0x(l - 8) 1-x, 0 < 0 < 1
6.1.1 Show that X = Lt=iXiis a MVUE of 0. (Hint: CRB = a 1
2) [12]
n
nE(ae log f(x;0))
6.1.2 Let Tn = Li=l Xi. Show that Tn is sufficient Statistic for the parameter 0.
( Hint: MxJt) = (1 - 0) - 0et and f(Tn) = (~) 0Tn(l - 8) 11-Tn)
[8]
=================================TotMal arkslOO=============================
Statistical Inference 2 (SIN601S}
2nd Opportunity- January 2025
3
|
|
4 Page 4 |
▲back to top |
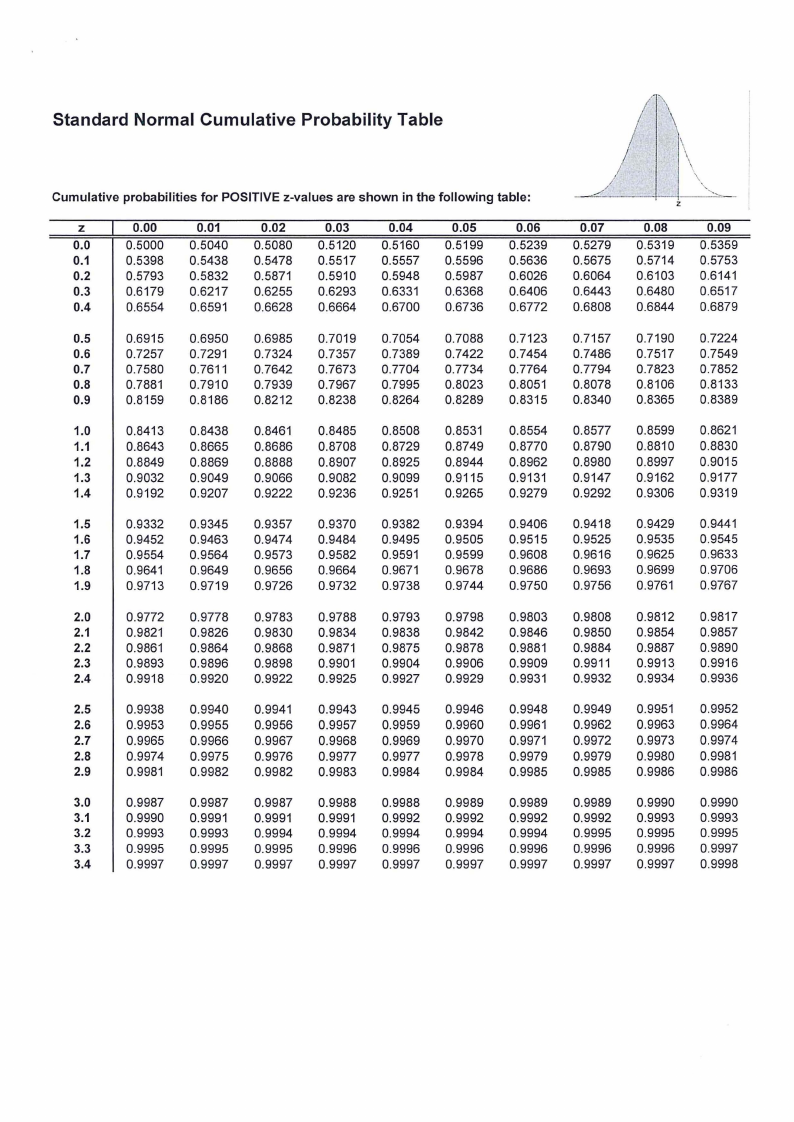
Standard Normal Cumulative Probability Table
Cumulative probabilities for POSITIVE z-values are shown in the following table:
z
0.00
0.01
0.02
0.03
0.04
0.05
0.06
0.0
0.5000 0.5040 0.5080 0.5120 0.5160 0.5199 0.5239
0.1
0.5398 0.5438 0.5478 0.5517 0.5557 0.5596 0.5636
0.2
0.5793 0.5832 0.5871 0.5910 0.5948 0.5987 0.6026
0.3
0.6179 0.6217 0.6255 0.6293 0.6331 0.6368 0.6406
0.4
0.6554 0.6591 0.6628 0.6664 0.6700 0.6736 0.6772
0.5
0.6915 0.6950 0.6985 0.7019 0.7054 0.7088 0.7123
0.6
0.7257 0.7291 0.7324 0.7357 0.7389 0.7422 0.7454
0.7
0.7580 0.7611 0.7642 0.7673 0.7704 0.7734 0.7764
0.8
0.7881 0.7910 0.7939 0.7967 0.7995 0.8023 0.8051
0.9
0.8159 0.8186 0.8212 0.8238 0.8264 0.8289 0.8315
1.0
0.8413 0.8438 0.8461 0.8485 0.8508 0.8531 0.8554
1.1
0.8643 0.8665 0.8686 0.8708 0.8729 0.8749 0.8770
1.2
0.8849 0.8869 0.8888 0.8907 0.8925 0.8944 0.8962
1.3
0.9032 0.9049 0.9066 0.9082 0.9099 0.9115 0.9131
1.4
0.9192 0.9207 0.9222 0.9236 0.9251 0.9265 0.9279
1.5
0.9332 0.9345 0.9357 0.9370 0.9382 0.9394 0.9406
1.6
0.9452 0.9463 0.9474 0.9484 0.9495 0.9505 0.9515
1.7
0.9554 0.9564 0.9573 0.9582 0.9591 0.9599 0.9608
1.8
0.9641 0.9649 0.9656 0.9664 0.9671 0.9678 0.9686
1.9
0.9713 0.9719 0.9726 0.9732 0.9738 0.9744 0.9750
2.0
0.9772 0.9778 0.9783 0.9788 0.9793 0.9798 0.9803
2.1
0.9821 0.9826 0.9830 0.9834 0.9838 0.9842 0.9846
2.2
0.9861 0.9864 0.9868 0.9871 0.9875 0.9878 0.9881
2.3
0.9893 0.9896 0.9898 0.9901 0.9904 0.9906 0.9909
2.4
0.9918 0.9920 0.9922 0.9925 0.9927 0.9929 0.9931
2.5
0.9938 0.9940 0.9941 0.9943 0.9945 0.9946 0.9948
2.6
0.9953 0.9955 0.9956 0.9957 0.9959 0.9960 0.9961
2.7
0.9965 0.9966 0.9967 0.9968 0.9969 0.9970 0.9971
2.8
0.9974 0.9975 0.9976 0.9977 0.9977 0.9978 0.9979
2.9
0.9981 0.9982 0.9982 0.9983 0.9984 0.9984 0.9985
3.0
0.9987 0.9987 0.9987 0.9988 0.9988 0.9989 0.9989
3.1
0.9990 0.9991 0.9991 0.9991 0.9992 0.9992 0.9992
3.2
0.9993 0.9993 0.9994 0.9994 0.9994 0.9994 0.9994
3.3
0.9995 0.9995 0.9995 0.9996 0.9996 0.9996 0.9996
3.4
0.9997 0.9997 0.9997 0.9997 0.9997 0.9997 0.9997
I '\\
\\
\\
/
\\
z ' ----·
0.07
0.5279
0.5675
0.6064
0.6443
0.6808
0.08
0.5319
0.5714
0.6103
0.6480
0.6844
0.09
0.5359
0.5753
0.6141
0.6517
0.6879
0.7157
0.7486
0.7794
0.8078
0.8340
0.7190
0.7517
0.7823
0.8106
0.8365
0.7224
0.7549
0.7852
0.8133
0.8389
0.8577
0.8790
0.8980
0.9147
0.9292
0.8599
0.8810
0.8997
0.9162
0.9306
0.8621
0.8830
0.9015
0.9177
0.9319
0.9418
0.9525
0.9616
0.9693
0.9756
0.9429
0.9535
0.9625
0.9699
0.9761
0.9441
0.9545
0.9633
0.9706
0.9767
0.9808
0.9850
0.9884
0.9911
0.9932
0.9812
0.9854
0.9887
0.9913
0.9934
0.9817
0.9857
0.9890
0.9916
0.9936
0.9949
0.9962
0.9972
0.9979
0.9985
0.9951
0.9963
0.9973
0.9980
0.9986
0.9952
0.9964
0.9974
0.9981
0.9986
0.9989
0.9992
0.9995
0.9996
0.9997
0.9990
0.9993
0.9995
0.9996
0.9997
0.9990
0.9993
0.9995
0.9997
0.9998
|
|
5 Page 5 |
▲back to top |
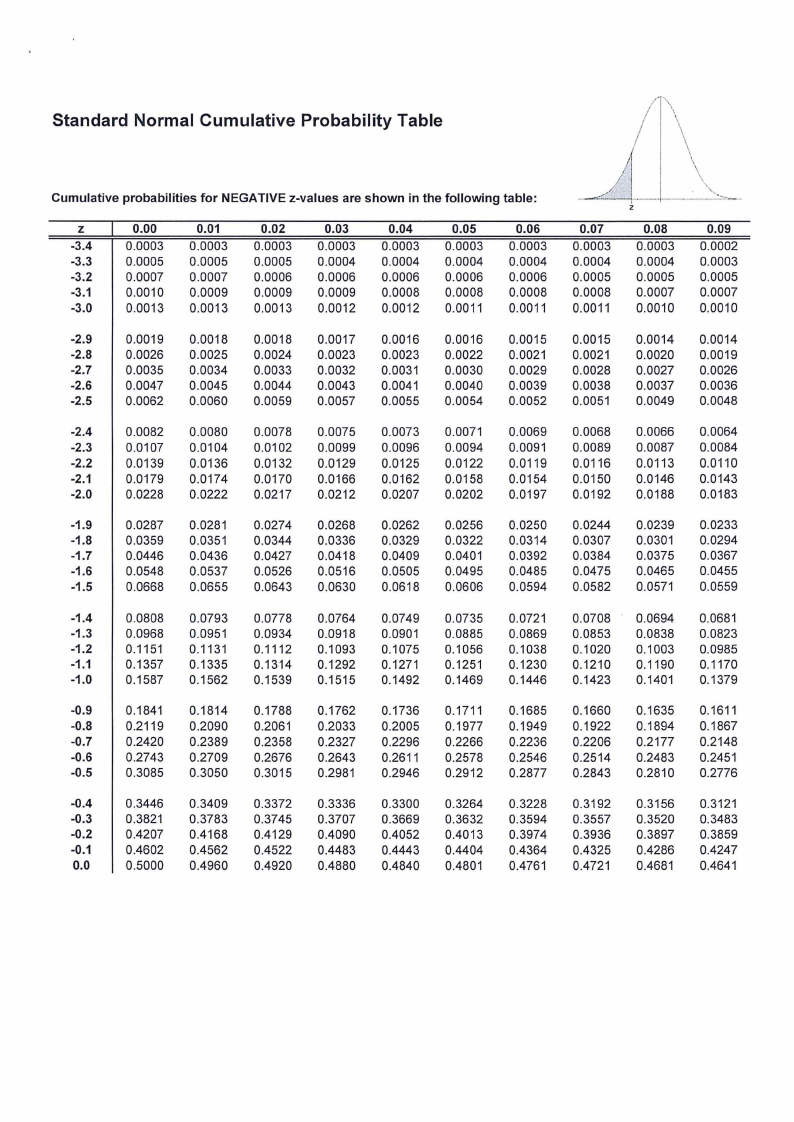
Standard Normal Cumulative Probability Table
Cumulative probabilities for NEGATIVE z-values are shown in the following table:
z
0.00
0.01
0.02
0.03
0.04
0.05
0.06
-3.4
0.0003 0.0003 0.0003 0.0003 0.0003 0.0003 0.0003
-3.3
0.0005 0.0005 0.0005 0.0004 0.0004 0.0004 0.0004
-3.2 0.0007 0.0007 0.0006 0.0006 0.0006 0.0006 0.0006
-3.1 0.0010 0.0009 0.0009 0.0009 0.0008 0.0008 0.0008
-3.0
0.0013 0.0013 0.0013 0.0012 0.0012 0.0011 0.0011
-2.9 0.0019 0.0018 0.0018 0.0017 0.0016 0.0016 0.0015
-2.8 0.0026 0.0025 0.0024 0.0023 0.0023 0.0022 0.0021
-2.7
0.0035 0.0034 0.0033 0.0032 0.0031 0.0030 0.0029
-2.6
0.0047 0.0045 0.0044 0.0043 0.0041 0.0040 0.0039
-2.5
0.0062 0.0060 0.0059 0.0057 0.0055 0.0054 0.0052
-2.4 0.0082 0.0080 0.0078 0.0075 0.0073 0.0071 0.0069
-2.3 0.0107 0.0104 0.0102 0.0099 0.0096 0.0094 0.0091
-2.2 0.0139 0.0136 0.0132 0.0129 0.0125 0.0122 0.0119
-2.1 0.0179 0.0174 0.0170 0.0166 0.0162 0.0158 0.0154
-2.0 0.0228 0.0222 0.0217 0.0212 0.0207 0.0202 0.0197
-1.9 0.0287 0.0281 0.0274 0.0268 0.0262 0.0256 0.0250
-1.8 0.0359 0.0351 0.0344 0.0336 0.0329 0.0322 0.0314
-1.7 0.0446 0.0436 0.0427 0.0418 0.0409 0.0401 0.0392
-1.6 0.0548 0.0537 0.0526 0.0516 0.0505 0.0495 0.0485
-1.5
0.0668 0.0655 0.0643 0.0630 0.0618 0.0606 0.0594
-1.4
0.0808 0.0793 0.0778 0.0764 0.0749 0.0735 0.0721
-1.3
0.0968 0.0951 0.0934 0.0918 0.0901 0.0885 0.0869
-1.2
0.1151 0.1131 0.1112 0.1093 0.1075 0.1056 0.1038
-1.1
0.1357 0.1335 0.1314 0.1292 0.1271 0.1251 0.1230
-1.0
0.1587 0.1562 0.1539 0.1515 0.1492 0.1469 0.1446
-0.9
0.1841 0.1814 0.1788 0.1762 0.1736 0.1711 0.1685
-0.8
0.2119 0.2090 0.2061 0.2033 0.2005 0.1977 0.1949
-0.7
0.2420 0.2389 0.2358 0.2327 0.2296 0.2266 0.2236
-0.6
0.2743 0.2709 0.2676 0.2643 0.2611 0.2578 0.2546
-0.5
0.3085 0.3050 0.3015 0.2981 0.2946 0.2912 0.2877
-0.4
0.3446 0.3409 0.3372 0.3336 0.3300 0.3264 0.3228
-0.3
0.3821 0.3783 0.3745 0.3707 0.3669 0.3632 0.3594
-0.2
0.4207 0.4168 0.4129 0.4090 0.4052 0.4013 0.3974
-0.1
0.4602 0.4562 0.4522 0.4483 0.4443 0.4404 0.4364
0.0
0.5000 0.4960 0.4920 0.4880 0.4840 0.4801 0.4761
0.07
0.0003
0.0004
0.0005
0.0008
0.0011
/'\\
I
I
I \\\\ ·,,,_
z
0.08
0.0003
0.0004
0.0005
0.0007
0.0010
0.09
0.0002
0.0003
0.0005
0.0007
0.0010
0.0015
0.0021
0.0028
0.0038
0.0051
0.0014
0.0020
0.0027
0.0037
0.0049
0.0014
0.0019
0.0026
0.0036
0.0048
0.0068
0.0089
0.0116
0.0150
0.0192
0.0066
0.0087
0.0113
0.0146
0.0188
0.0064
0.0084
0.0110
0.0143
0.0183
0.0244
0.0307
0.0384
0.0475
0.0582
0.0239
0.0301
0.0375
0.0465
0.0571
0.0233
0.0294
0.0367
0.0455
0.0559
0.0708
0.0853
0.1020
0.1210
0.1423
0.0694
0.0838
0.1003
0.1190
0.1401
0.0681
0.0823
0.0985
0.1170
0.1379
0.1660
0.1922
0.2206
0.2514
0.2843
0.1635
0.1894
0.2177
0.2483
0.2810
0.1611
0.1867
0.2148
0.2451
0.2776
0.3192
0.3557
0.3936
0.4325
0.4721
0.3156
0.3520
0.3897
0.4286
0.4681
0.3121
0.3483
0.3859
0.4247
0.4641
|
|
6 Page 6 |
▲back to top |
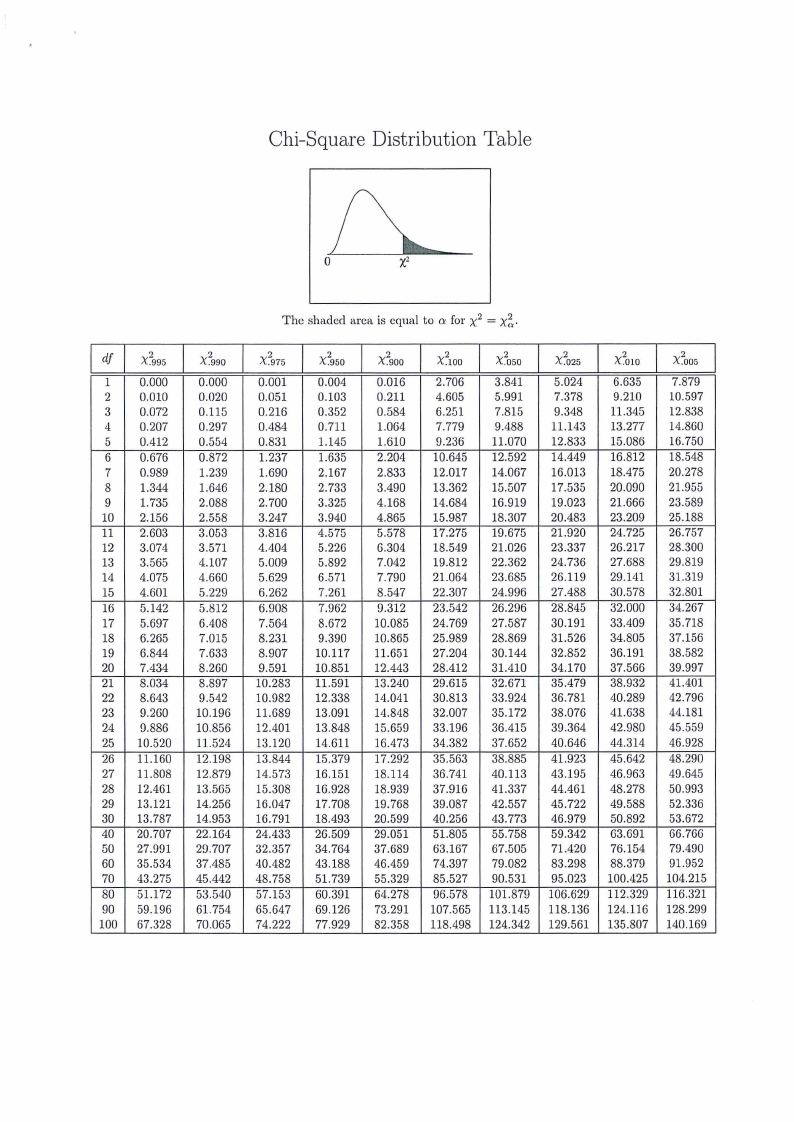
Chi-Square Distribution Table
o
x2
The shaded area is equal to a for x2 = x~.
df
X~995
1 0.000
2 0.010
3 0.072
4 0.207
5 0.412
6 0.676
7 0.989
8 1.344
9 1.735
10 2.156
11 2.603
12 3.074
13 3.565
14 4.075
15 4.601
16 5.142
17 5.697
18 6.265
19 6.844
20 7.434
21 8.034
22 8.643
23 9.260
24 9.886
25 10.520
26 11.160
27 11.808
28 12.461
29 13.121
30 13.787
40 20.707
50 27.991
60 35.534
70 43.275
80 51.172
90 59.196
100 67.328
X
2
990
0.000
0.020
0.115
0.297
0.554
0.872
1.239
1.646
2.088
2.558
3.053
3.571
4.107
4.660
5.229
5.812
6.408
7.015
7.633
8.260
8.897
9.542
10.196
10.856
11.524
12.198
12.879
13.565
14.256
14.953
22.164
29.707
37.485
45.442
53.540
61.754
70.065
X2975
0.001
0.051
0.216
0.484
0.831
1.237
1.690
2.180
2.700
3.247
3.816
4.404
5.009
5.629
6.262
6.908
7.564
8.231
8.907
9.591
10.283
10.982
11.689
12.401
13.120
13.844
14.573
15.308
16.047
16.791
24.433
32.357
40.482
48.758
57.153
65.647
74.222
X~950
0.004
0.103
0.352
0.711
1.145
1.635
2.167
2.733
3.325
3.940
4.575
5.226
5.892
6.571
7.261
7.962
8.672
9.390
10.117
10.851
11.591
12.338
13.091
13.848
14.611
15.379
16.151
16.928
17.708
18.493
26.509
34.764
43.188
51.739
60.391
69.126
77.929
X2goo
0.016
0.211
0.584
1.064
1.610
2.204
2.833
3.490
4.168
4.865
5.578
G.304
7.042
7.790
8.547
9.312
10.085
10.865
11.651
12.443
13.240
14.041
14.848
15.659
16.473
17.292
18.114
18.939
19.768
20.599
29.051
37.689
46.459
55.329
64.278
73.291
82.358
X~100
2.706
4.605
6.251
7.779
9.236
10.645
12.017
13.362
14.684
15.987
17.275
18.549
19.812
21.064
22.307
23.542
24.769
25.989
27.204
28.412
29.615
30.813
32.007
33.196
34.382
35.563
36.741
37.916
39.087
40.256
51.805
63.167
74.397
85.527
96.578
107.565
118.498
X 2oso
3.841
5.991
7.815
9.488
11.070
12.592
14.067
15.507
16.919
18.307
19.675
21.026
22.362
23.685
24.996
26.296
27.587
28.869
30.144
31.410
32.671
33.924
35.172
36.415
37.652
38.885
40.113
41.337
42.557
43.773
55.758
67.505
79.082
90.531
101.879
113.145
124.342
X~o2s
5.024
7.378
9.348
11.143
12.833
14.449
16.013
17.535
19.023
20.483
21.920
23.337
24.736
26.119
27.488
28.845
30.191
31.526
32.852
34.170
35.479
36.781
38.076
39.364
40.646
41.923
43.195
44.461
45.722
46.979
59.342
71.420
83.298
95.023
106.629
118.136
129.561
X~OlO
6.635
9.210
11.345
13.277
15.086
16.812
18.475
20.090
21.666
23.209
24.725
26.217
27.688
29.141
30.578
32.000
33.409
34.805
36.191
37.566
38.932
40.289
41.638
42.980
44.314
45.642
46.963
48.278
49.588
50.892
63.691
76.154
88.379
100.425
112.329
124.116
135.807
X~oo5
7.879
10.597
12.838
14.860
16.750
18.548
20.278
21.955
23.589
25.188
26.757
28.300
29.819
31.319
32.801
34.267
35.718
37.156
38.582
39.997
41.401
42.796
44.181
45.559
46.928
48.290
49.645
50.993
52.336
53.672
66.766
79.490
91.952
104.215
116.321
128.299
140.169
|
|
7 Page 7 |
▲back to top |
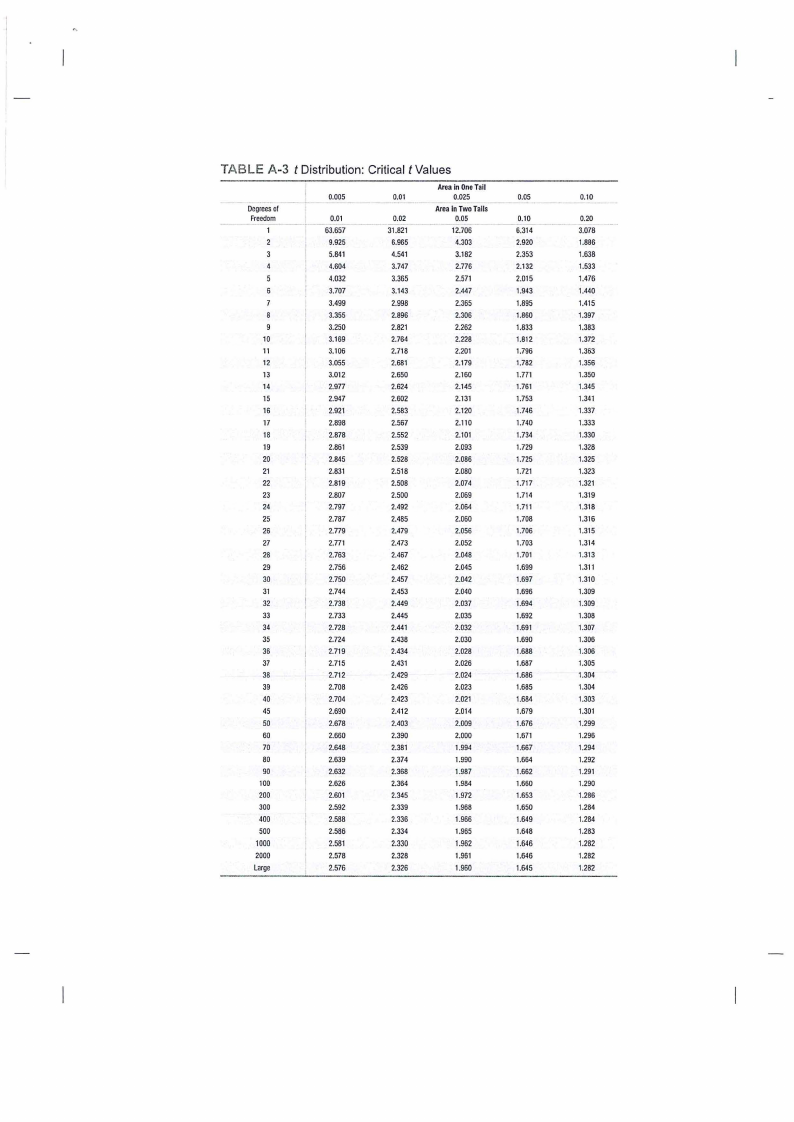
TABLE A-3 t Distribution: Critical t Values
Degreeos f
Fr-e-e--d-om
6
10
11
12
13
14
15
16
17
18
19
20
21
22
23
24
25
26
27
28
29
30
31
32
33
34
35
36
37
38
39
40
45
so
60
70
80
90
100
200
300
400
500
1000
2000
Large
0.005
0.01
63.657
9.925
5.841
4.604
4.032
3.707
3.499
3.355
3.250
3.169
3,106
3.055
3.012
2.977
2.947
2.921
2.898
2.878
2.861
2.845
2.831
2.819
2.807
2.797
2.787
2.779
2.771
2.763
2.756
2.750
2.744
2.738
2.733
2.728
2.724
2.719
2.715
2.712
2,708
2.704
2.690
2.678
2.660
2.648
2.639
2.632
2.626
2.601
2.592
2.588
2.586
2.581
2,578
2.576
--··-·-• 0.01
0.02
31.821
6.965
4.541
3.747
3.365
3.143
2.998
2.896
2.821
2,764
2.718
2,681
2.650
2.624
2.602
2.583
2.567
2.552
2.539
2.528
2.518
2,508
2.500
2.492
2.485
2.479
2.473
2.467
2.462
2.457
2.453
2.449
2.445
2.441
2.438
2.434
2.431
2.429
2.426
2.423
2.412
2.403
2.390
2.381
2.374
2.368
2.364
2.345
2.339
2.336
2.334
2.330
2.328
2.326
AreaIn OneTall
0.025
AreaIn TwoTails
0.05
12.706
4.303
3.182
2.776
2.571
2.447
2.365
2.306
2.262
2.228
2.201
2.179
2.160
2.145
2.131
2.120
2.110
2.101
2.093
2.086
2.080
2.074
2.069
2.064
2.060
2.056
2.052
2.048
2.045
2.042
2.040
2.037
2.035
2.032
2.030
2.028
2.026
2.024
2.023
2.021
2.014
2.009
2.000
1.994
1.990
1.987
1.984
1.972
1.968
1.966
1.965
1.962
1.961
1.960
0.05
0.10
6,314
2.920
2.353
2.132
2.015
1.943
1.895
1.860
1.833
1.812
1.796
1,782
1.771
1.761
1.753
1.746
1,740
1.734
1.729
1.725
1.721
1.717
1.714
1,711
1.708
1.706
1.703
1,701
1.699
1.697
1.696
1.694
1.692
1.691
1.690
1.688
1.687
1.686
1.685
1.684
1.679
1.676
1.671
1.667
1.664
1.662
1.660
1.653
1.650
1.649
1.648
1.646
1.646
1.645
-- -- 0.-1-0
0.20
3.078
1.886
1.638
1.533
1.476
1,440
1.415
1.397
1.383
1.372
1.363
1.356
1.350
1.345
1,341
1,337
1.333
1.330
1.328
1.325
1.323
1.321
1.319
1.318
1.316
1.315
1.314
1.313
1.311
1.310
1,309
1.309
1.308
1.307
1.306
1.306
1.305
1.304
1.304
1.303
1.301
1.299
1.296
1.294
1.292
1.291
1.290
1.286
1.284
1.284
1.283
1.282
1.282
1.282