


 |
MMO702S- MATHEMATICAL MODELLING 2- JAN 2020pdf |
|
|
1 Page 1 |
▲back to top |
e
NAMIBIA UNIVERSITY
OF SCIENCE AND TECHNOLOGY
FACULTY OF HEALTH AND APPLIED SCIENCES
DEPARTMENT OF MATHEMATICS AND STATISTICS
QUALIFICATION: Bachelor of Science in Applied Mathematics and Statistics
QUALIFICATION CODE: 07BAMS
LEVEL: 7
COURSE CODE: MMO702S
COURSE NAME: MATHEMATICAL MODELLING 2
SESSION: JANUARY 2020
DURATION: 3 HOURS
PAPER: THEORY
MARKS: 100
SECOND OPPORTUNITY/SUPPLEMENTARY EXAMINATION QUESTION PAPER
EXAMINER
PROF. S. A. REJU
MODERATOR:
PROF. O. D. MAKINDE
INSTRUCTIONS
1. Attempt ALL the questions.
2. All written work must be done in blue or black ink and sketches must
be done in pencil.
3. Use of COMMA is not allowed as a DECIMAL POINT.
Marks will not be awarded for answers obtained without showing the
necessary steps leading to them (the answers).
PERMISSIBLE MATERIALS
1. Non-programmable calculator without a cover.
THIS QUESTION PAPER CONSISTS OF 4 PAGES (including this front page)
Page 1 of4
|
|
2 Page 2 |
▲back to top |
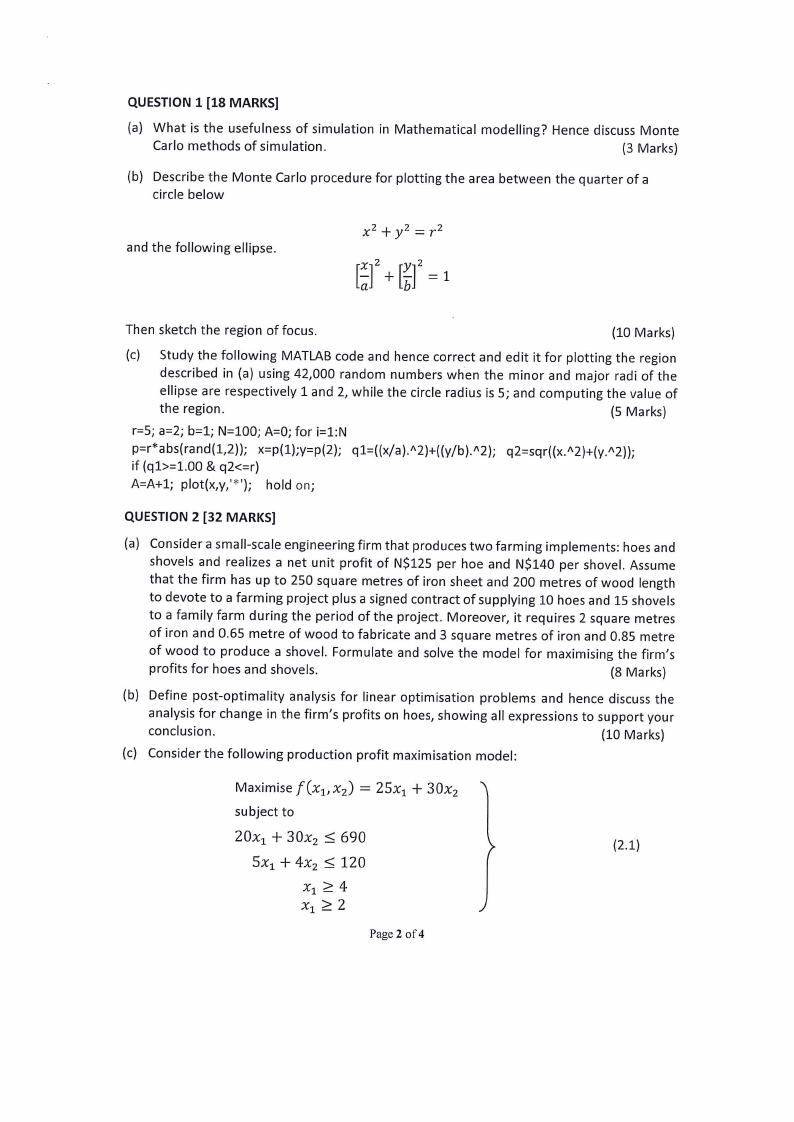
QUESTION 1 [18 MARKS]
(a) What is the usefulness of simulation in Mathematical modelling? Hence discuss Monte
Carlo methods of simulation.
(3 Marks)
(b) Describe the Monte Carlo procedure for plotting the area between the quarter of a
circle below
and the following ellipse.
fl 2 +&] 2 =3
Then sketch the region of focus.
(10 Marks)
(c) Study the following MATLAB code and hence correct and edit it for plotting the region
described in (a) using 42,000 random numbers when the minor and major radi of the
ellipse are respectively 1 and 2, while the circle radius is 5; and computing the value of
the region.
(S Marks)
r=5; a=2; b=1; N=100; A=0; for i=1:N
p=r*abs(rand(1,2)); x=p(1);y=p(2); q1=((x/a).2)+((y/b).2);
if (q1>=1.00 & q2<=r)
A=A+1; plot(x,y,'*'); hold on;
q2=sqr((x.42)+(y.42));
QUESTION 2 [32 MARKS]
(a) Consider a small-scale engineering firm that produces two farming implements: hoes and
shovels and realizes a net unit profit of NS125 per hoe and NS$140 per shovel. Assume
that the firm has up to 250 square metres of iron sheet and 200 metres of wood length
to devote to a farming project plus a signed contract of supplying 10 hoes and 15 shovels
to a family farm during the period of the project. Moreover, it requires 2 square metres
of iron and 0.65 metre of wood to fabricate and 3 square metres of iron and 0.85 metre
of wood to produce a shovel. Formulate and solve the model for maximising the firm’s
profits for hoes and shovels.
(8 Marks)
(b) Define post-optimality analysis for linear optimisation problems and hence discuss the
analysis for change in the firm’s profits on hoes, showing all expressions to support your
conclusion.
(10 Marks)
(c) Consider the following production profit maximisation model:
Maximise f (x1, x2) = 25x, + 30x,
subject to
20x, + 30x, < 690
2.4)
Sx, + 4x, < 120
x, 24
x, 22
Page 2 of4
|
|
3 Page 3 |
▲back to top |
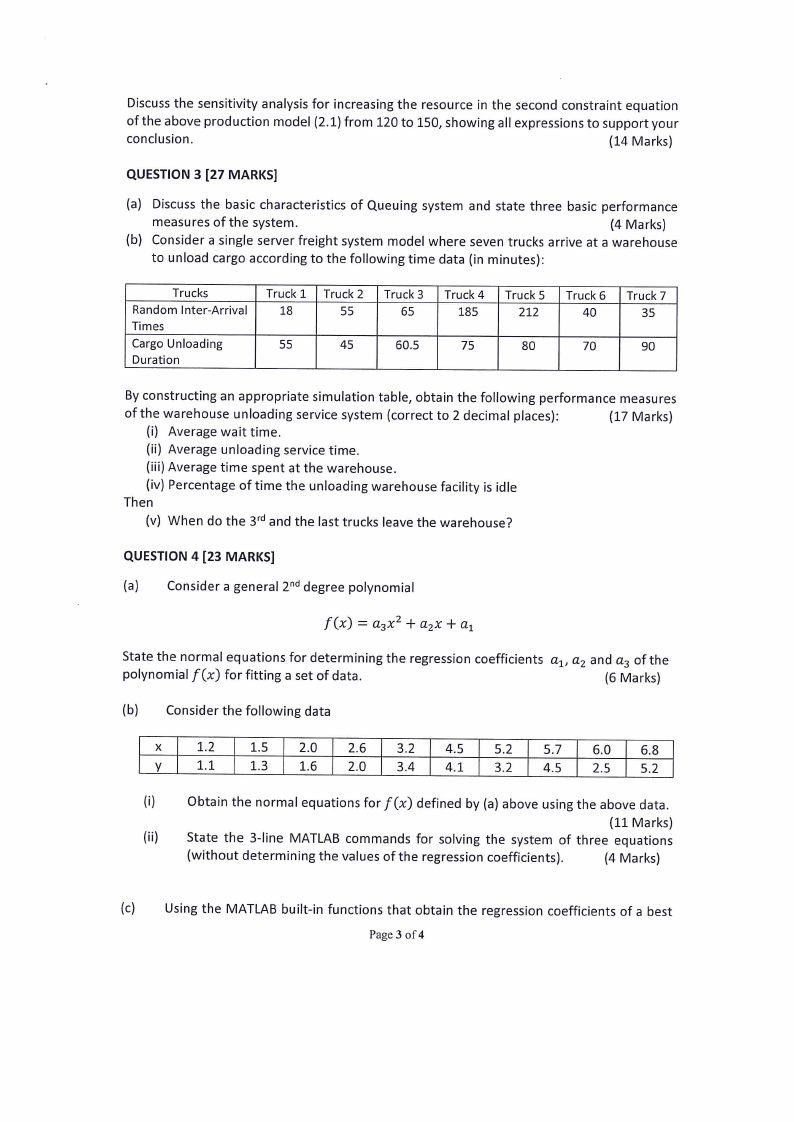
Discuss the sensitivity analysis for increasing the resource in the second constraint equation
of the above production model (2.1) from 120 to 150, showing all expressions to support your
conclusion.
(14 Marks)
QUESTION 3 [27 MARKS]
(a) Discuss the basic characteristics of Queuing system and state three basic performance
measures of the system.
(4 Marks)
(b) Consider a single server freight system model where seven trucks arrive at a warehouse
to unload cargo according to the following time data (in minutes):
Trucks
Random Inter-Arrival
Times
Cargo Unloading
Duration
Truck 1 | Truck2 | Truck3 | Truck4 | TruckS | Truck6 | Truck 7
18
55
65
185
212
40
35
55
45
60.5
15
80
70
90
By constructing an appropriate simulation table, obtain the following performance measures
of the warehouse unloading service system (correct to 2 decimal places):
(17 Marks)
(i) Average wait time.
(ii) Average unloading service time.
(iii) Average time spent at the warehouse.
(iv) Percentage of time the unloading warehouse facility is idle
Then
(v) When do the 3 and the last trucks leave the warehouse?
QUESTION 4 [23 MARKS]
(a)
Consider a general 2™ degree polynomial
f(x) = a3x* +a,x+a,
State the normal equations for determining the regression coefficients a,, a2 and a3 of the
polynomial f(x) for fitting a set of data.
(6 Marks)
(b)
Consider the following data
1.2
1.5
2.0
2.6
3.2
4.5
5.2
5.7
6.0
6.8
1.1
1.3 1.6
2.0
3.4
4.1
3.2
4.5
2.5
5.2
(i)
Obtain the normal equations for f(x) defined by (a) above using the above data.
(11 Marks)
(ii)
State the 3-line MATLAB commands for solving the system of three equations
(without determining the values of the regression coefficients).
(4 Marks)
(c)
Using the MATLAB built-in functions that obtain the regression coefficients of a best
Page 3 of4
|
|
4 Page 4 |
▲back to top |

polynomial approximation of a data pair (x, y) and the predicted values of y at given x values,
respectively, state the MATLAB expressions for the regression coefficients for f(x) in (a) and
the predicted values of y at given x values.
(2 Marks)
END OF QUESTION PAPER
TOTAL MARKS = 100
Page 4 of4