


 |
MMO701S - MATHEMATICS MODELLING 1 - 1ST OPP - JUNE 2023 |
|
|
1 Page 1 |
▲back to top |
r
nAmlBIA UnlVERSITY
OF SCIEn CE Ano TECHn OLOGY
FACULTYOF HEALTH,NATURALRESOURCESAND APPLIEDSCIENCES
SCHOOLOF NATURALAND APPLIEDSCIENCES
DEPARTMENTOF MATHEMATICS, STATISTICSAND ACTUARIALSCIENCE
QUALIFICATION: Bachelor of Science in Applied Mathematics and Statistics
QUALIFICATION CODE: 07BSAM
LEVEL: 7
COURSE CODE: MMO701S
COURSE NAME: MATHEMATICAL MODELLING 1
SESSION: JUNE 2023
DURATION: 3 HOURS
PAPER: THEORY
MARKS: 130 (to be converted to 100%)
EXAMINERS
MODERATOR:
FIRST OPPORTUNITY EXAMINATION QUESTION PAPER
PROF.S. A. REJU
PROF.0. D. MAKINDE
INSTRUCTIONS
1. Attempt ALL the questions.
2. All written work must be done in blue or black ink and sketches must
be done in pencils.
3. Use of COMMA is not allowed as a DECIMAL POINT.
PERMISSIBLE MATERIALS
1. Non-programmable calculator without a cover.
THIS QUESTION PAPER CONSISTS OF 3 PAGES (including this front page)
I Ip(\\ g C
|
|
2 Page 2 |
▲back to top |
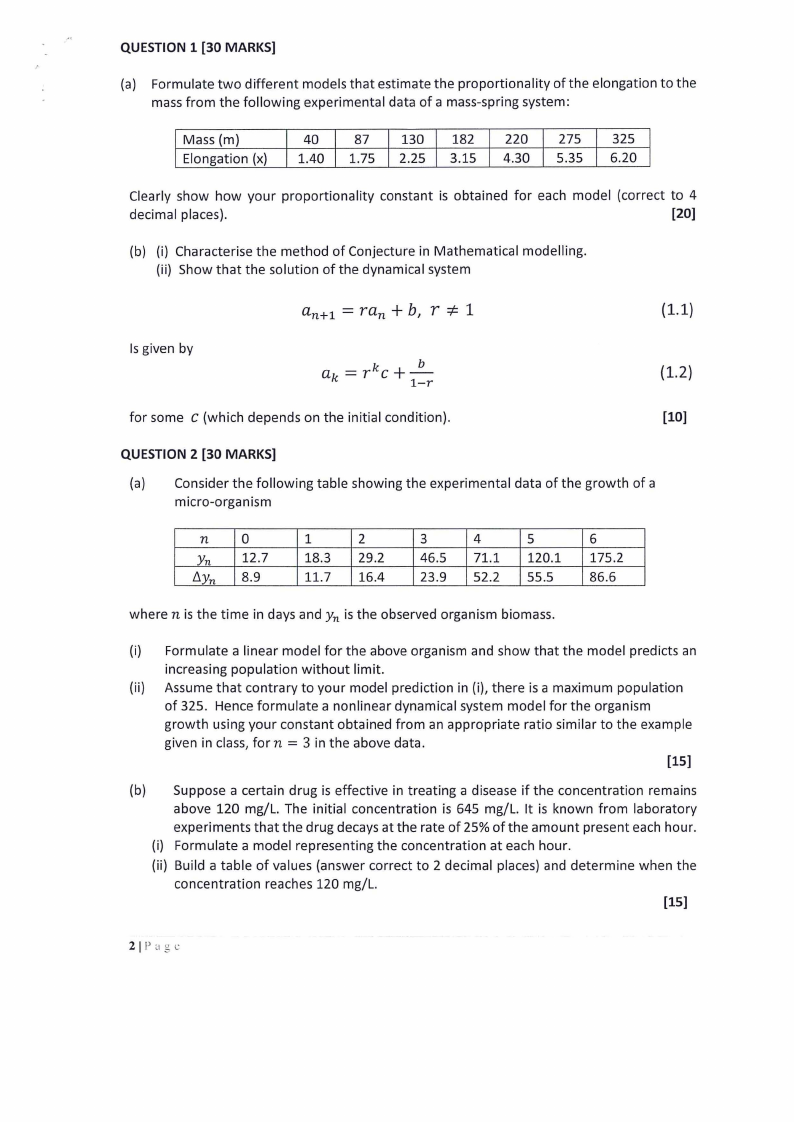
QUESTION 1 [30 MARKS]
(a) Formulate two different models that estimate the proportionality of the elongation to the
mass from the following experimental data of a mass-spring system:
Mass (m)
40
87 130 182 220 275 325
Elongation (x) 1.40 1.75 2.25 3.15 4.30 5.35 6.20
Clearly show how your proportionality constant is obtained for each model (correct to 4
decimal places).
[20]
(b) (i) Characterise the method of Conjecture in Mathematical modelling.
(ii) Show that the solution of the dynamical system
(1.1)
Is given by
(1.2)
for some c (which depends on the initial condition).
[10]
QUESTION 2 [30 MARKS]
(a) Consider the following table showing the experimental data of the growth of a
micro-organism
n0
Yn 12.7
b.yn 8.9
1
2
18.3 29.2
11.7 16.4
3
4
5
6
46.5 71.1 120.1 175.2
23.9 52.2 55.5
86.6
where n is the time in days and Yn is the observed organism biomass.
(i) Formulate a linear model for the above organism and show that the model predicts an
increasing population without limit.
(ii) Assume that contrary to your model prediction in (i), there is a maximum population
of 325. Hence formulate a nonlinear dynamical system model for the organism
growth using your constant obtained from an appropriate ratio similar to the example
= given in class, for n 3 in the above data.
[15]
(b) Suppose a certain drug is effective in treating a disease if the concentration remains
above 120 mg/L. The initial concentration is 645 mg/L. It is known from laboratory
experiments that the drug decays at the rate of 25% of the amount present each hour.
(i) Formulate a model representing the concentration at each hour.
(ii) Build a table of values (answer correct to 2 decimal places) and determine when the
concentration reaches 120 mg/L.
[15]
2 j p ,I g C
|
|
3 Page 3 |
▲back to top |
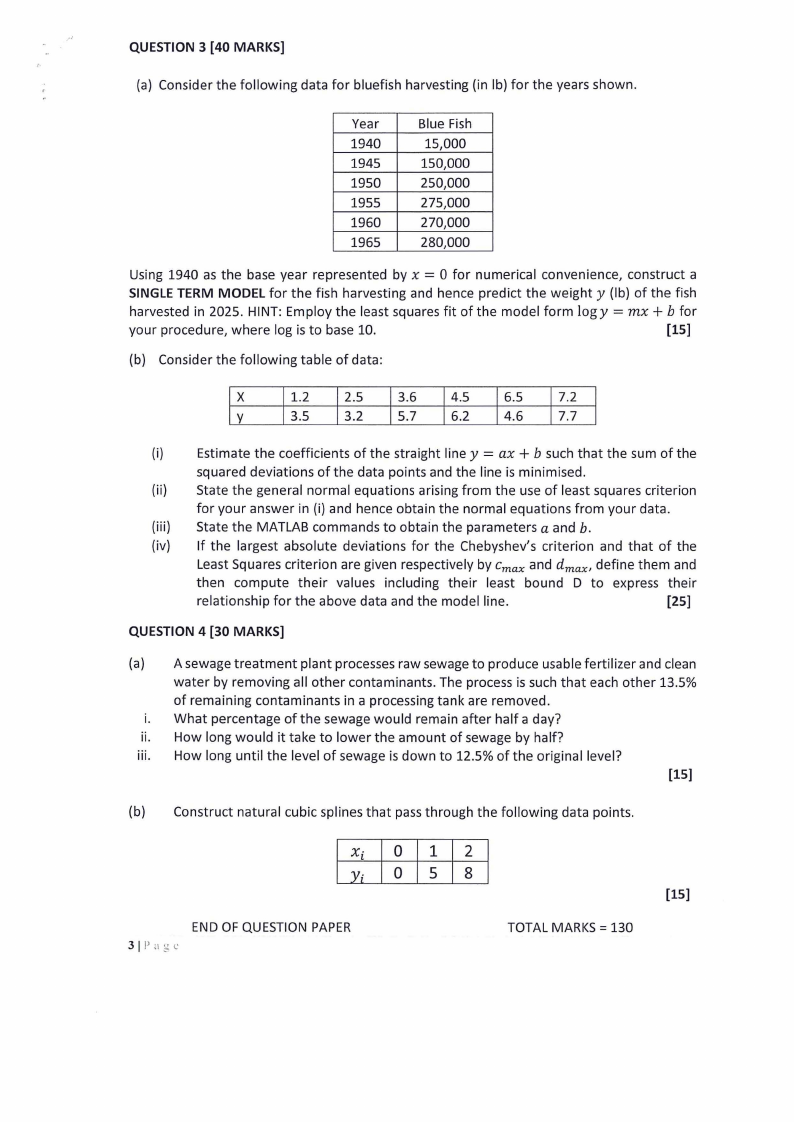
QUESTION 3 [40 MARKS]
(a) Consider the following data for bluefish harvesting (in lb) for the years shown.
Year
1940
1945
1950
1955
1960
1965
Blue Fish
15,000
150,000
250,000
275,000
270,000
280,000
= Using 1940 as the base year represented by x 0 for numerical convenience, construct a
SINGLE TERM MODEL for the fish harvesting and hence predict the weighty (lb) of the fish
harvested in 2025. HINT: Employ the least squares fit of the model form logy = mx + b for
your procedure, where log is to base 10.
[15]
(b) Consider the following table of data:
11.2 I 2.5 I 3.6 14.5 I 6.5 I 7.2
3.5
3.2
5.7
6.2
4.6
7.7
(i)
Estimate the coefficients of the straight line y = ax + b such that the sum of the
squared deviations of the data points and the line is minimised.
(ii) State the general normal equations arising from the use of least squares criterion
for your answer in (i) and hence obtain the normal equations from your data.
(iii) State the MATLAB commands to obtain the parameters a and b.
(iv) If the largest absolute deviations for the Chebyshev's criterion and that of the
Least Squares criterion are given respectively by Cmax and dmax, define them and
then compute their values including their least bound D to express their
relationship for the above data and the model line.
[25]
QUESTION 4 [30 MARKS]
(a) A sewage treatment plant processes raw sewage to produce usable fertilizer and clean
water by removing all other contaminants. The process is such that each other 13.5%
of remaining contaminants in a processing tank are removed.
i. What percentage of the sewage would remain after half a day?
ii. How long would it take to lower the amount of sewage by half?
iii. How long until the level of sewage is down to 12.5% of the original level?
[15]
(b) Construct natural cubic splines that pass through the following data points.
X·l
Yi
END OF QUESTIONPAPER
31p ,I g <:
[15]
TOTAL MARKS= 130