SIN502S - STATISTICAL INFERENCE 1 - 1ST OPP - NOVEMBER 2023


SIN502S - STATISTICAL INFERENCE 1 - 1ST OPP - NOVEMBER 2023


1 Pages 1-10

▲back to top


1.1 Page 1

▲back to top


nAmlBIA UntVERSITY
OF SCIEnCE AnDTECHnOLOGY
FacultyofHealthN, atural
ResourceasndApplied
Sciences
Schoool f NaturalandApplied
Sciences
Departmentof Mathematics,
StatisticsandActuarialScience
13JacksonKaujeuaStreet
Private Bag 13388
Windhoek
NAMIBIA
T: •254 61207291:
E: msas@nust.na
W: www.nust.na
QUALIFICATION: BACHELOR OF SCIENCES IN APPLIED MATHEMATICS AND STATISTICS
QUALIFICATION CODE: 07BAMS
LEVEL:5
COURSE:STATISTICAL INFERENCE 1
DATE: NOVEMBER 2023
DURATION: 3 HOURS
COURSECODE: SIN502S
SESSION: 1
MARKS: 100
FIRST OPPORTUNITY: EXAMINATION QUESTION PAPER
EXAMINERS: MR E. MWAHI, DR D. NTIRAMPEBA
MODERATOR: DRJ. ONG'ALA
INSTRUCTIONS:
1. Answer all questions on the separate answer sheet.
2. Please write neatly and legibly.
3. Do not use the left side margin of the exam paper. This must be allowed for the examiner.
4. No books, notes and other additional aids are allowed.
5. Mark all answers clearly with their respective question numbers.
PERMISSIBLE MATERIALS:
1. Non-Programmable Calculator
ATTACHEMENTS:
1. T- Table
2. Normal distribution table
3. Chi-square table
4. F-table
5. Manny Whitney U table
This paper consists of 6 pages including this front page.

1.2 Page 2

▲back to top


QUESTION 1
[20 MARKS]
1.1 The mean is:
(2)
A. a summary of some data estimated by adding all the numbers and dividing by the number
of observations minus one.
B. a summary of the data that is a measure of the population rather than a sample.
C. a summary of some data that is always halfway between the maximum and minimum value
of the data.
D. none of the above
1.2 If data show "homogeneity of variance", it means that:
(2)
A. They must be analysed with a chi-square test.
B. Scores in each group or condition show comparable amounts of variance.
C. The data are normally distributed.
D. They have been measured on an interval or ratio scale.
E. None of the above.
1.3 If you perform a one-tailed statistical test, your hypothesis is:
[2]
A. That the experiment was conducted double blind.
B. That the difference between your groups will be in a specific direction.
C. That the two different measurements are unpredictable from each other.
D. That the variance of two measurements does not differ significantly.
E. That the mean of two measurements does not differ significantly.
1.4 A type II error:
(2)
A. Is when one rejects the null hypothesis when in fact is true.
B. Is when one accepts the null hypothesis when it is false.
C. Is always the result of bias in the sample.
D. Is the error of using the wrong test.
E. ISthe error of using the same data twice.
1.5 If a sample is unrepresentative, this implies:
[2]
A. That not enough data were collected.
B. The data are not normally distributed.
C. That one single measurement was not typical and therefore not useful.
D. That the sample should not be used to make inferences about the population.
STATISTICALINFERENCE1 (SIN502S)
1st opportunity November 2023
2

1.3 Page 3

▲back to top


QUESTION 2
[45 MARKS]
2.1 Njako Investment Trust gives each of its employees an aptitude test. The scores on the
test are normally distributed with a mean of 75 and a variance of 225. A simple random
sample of 25 is taken from the population of 5000.
2.1.1 What is the probability that the average aptitude test score in the sample will
be between 72.13 and 80.13?
(6)
2.1.2 Find a value K, such that P(i::;K; ) = 0.3994
(4)
2.2 The operation manager wants to have 90% confidence of estimating the proportion
of nonconforming newspapers to within ±0.05 of its true value. In addition, because
the publisher of the newspaper has not previously undertaken such a study, no
information is available from past data. Determine the sample size.
[SJ
2.3 The personnel department of a large corporation wants to estimate the family dental
expenses of its employees to determine the feasibility of providing a dental insurance.
A random sample of 10 employees reveals the following family dental expenses for
the year 2020.
110 362 246 85 510 208 173 425 316 179
(a) Find the sample mean of these family dental expenses.
[1]
(b) Find the sample variance of these family dental expenses.
[3]
(c) Construct a 95% confidence interval estimate of the true population variance
of family dental expenses.
[6]
2.4 The table below shows data on type of school area and the student's choice of good
grades, athletic ability, or popularity as most important.
Goals
Good grades
Athletic ability
Popularity
Urban
24
6
5
Type of School Area
Suburban
87
42
22
Rural
57
50
42
At the 5% level of significance, is there a relationship between the type of school area
and the student's choice of good grades, athletic ability, or popularity as most
important?
(10)
STATISTICAL INFERENCE 1 (SIN502S)
pt Opportunity November 2023
3

1.4 Page 4

▲back to top


2.5 A random sample of employees of a large company was asked the question, "Do you
participate in the company's stock purchase plan?" The answers are shown below.
Yes
No
No
Yes No
No
Yes
Yes
No
No
No
Yes
Yes
Yes
Yes
Yes
No
No
Yes
Yes
No
Yes
Yes
No
Yes
Yes
No
Yes
Yes
Yes
Use a 99% confidence interval to estimate the proportion of all employees who do
not participate in the company's stock purchase plan.
[SJ
2.6 Fifteen Smart Cars were randomly selected in Windhoek and the highway speed of
each was noted. The analysis yielded a mean of 47 kilometres per hour and a standard
deviation of 5 kilometres. Find and interpret a 90% confidence interval for the average
highway speed of all Smart Cars in Windhoek.
[5]
QUESTION 3
(20 MARKS]
3.1 A manufacturer claims that the average thickness of the spearmint gum it produces is
7.50 one-hundredths of an inch. A quality control specialist regularly checks this claim.
On one production run, she took a random sample of n = 10 pieces of gum and
measured their thickness. The measurements are assumed to be normally distributed
and are recorded in the table below:
7.65
7.60
7.65
7.70
7.55
7.55
7.40
7.40
7.50
7.50
Using the above data obtained by the quality control specialist, test the manufacturer's
claim at 5% level of significance.
[8]
STATISTICALINFERENCE1 (SIN502S)
l51Opportunity November 2023
4

1.5 Page 5

▲back to top


3.2 The M&N association has noted with concern that the number of typing errors their
secretaries commit per page, on average, is significantly high. The authorities at the
Institution organised a two-week training workshop for the secretaries after which
they compile the following table showing the average errors each secretary
committed per page before and after the training workshop.
Secretary 1
2
3
4
5
6
7
8
9
10
Before
8
7
6
8
11
4
8
3
10 12
After
5
4
5
10
8
0
9
3
8
10
Can the authorities be sure at 5% level of significance that, the training workshop
helped the secretaries to improve typing skills?
(12]
QUESTION 4
[25 MARKS]
4.1 A specialist teacher wanted to find out whether there were differences in the
effectiveness of 3 methods of teaching reading to students with dyslexia. She divided
the participants into 8 groups and subjected each group to a different method. The
marks obtained by each group using different teaching methods are recorded in the
following table:
Group
A
B
C
D
E
F
G
H
Method A
7
9
5
10
11
12
9
5
Method B 4
2
4
4
3
6
5
1
Method C
3
7
2
10
6
8
12
2
4.1.1 State the assumptions of the Analysis of Variance (ANOVA)
[3]
4.1.2 Can the teacher conclude, at 5% level of significance, that there were
significant differences in the effectiveness of the 3 methods?
[15]
STATISTICAL INFERENCE 1 (SIN502S)
pt Opportunity November 2023
5

1.6 Page 6

▲back to top


4.2 Is consumer reaction to a product marketing display different from one market to
another? A company that manufactures kitchen appliances construct the same
product display in large department stores in each of two different markets, A and B.
10 persons viewing the display randomly selected at each location and asked to rate
the display on scale of 1 to 20. The 20 ratings are shown in the table below.
Market A
Market B
15
11
17
6
20 14
15 10
9 12
5 17 13 18
6
8 10 16
8
7
Using the Manny Whitney U test, do data provide sufficient evidence to indicate that,
the levels of ratings differ between the two markets? Use alpha= 0.01
(7]
=============END OF EXAMINATION===========
STATISTICALINFERENCE1 (SIN502S)
1st Opportunity November 2023
6

1.7 Page 7

▲back to top


F Table for alpha=0.05
}\\_ l
i -_
df2/dfl
1
2
3
4
5
f (.OS,dll.d2)
1
161.4476
18.5128
10.128
7.7086
6.6079
2
199.5
19
9.5521
6.9443
5.7861
3
215.7073
19.1643
9.2766
6.5914
5.4095
4
224.5832
19.2468
9.1172
6.3882
5.1922
5
230.1619
19.2964
9.0135
6.2561
5.0503
6
233.986
19.3295
8.9406
6.1631
4.9503
7
236.7684
19.3532
8.8867
6.0942
4.8759
8
238.8827
19.371
8.8452
6.041
4.8183
9
240.5433
19.3848
8.8123
5.9988
4.7725
10
241.8817
19.3959
8.7855
5.9644
4.7351
12
243.906
19.4125
8.7446
5.9117
4.6777
15
245.9499
19.4291
8.7029
5.8578
4.6188
20
248.0131
19.4458
8.6602
5.8025
4.5581
24
249.0518
19.4541
8.6385
5.7744
4.5272
30
250.0951
19.4624
8.6166
5.7459
4.4957
40
25!.1432
19.4707
8.5944
5.717
4.4638
60
252.1957
19.4791
8.572
5.6877
4.4314
120
253.2529
19.4874
8.5494
5.6581
4.3985
INF
254.3144
19.4957
8.5264
5.6281
4.365
6
5.9874
5.1433
4.7571
4.5337
4.3874
4.2839
4.2067
4.1468
4.099
4.06
3.9999
3.9381
3.8742
3.8415
3.8082
3.7743
3.7398
3.7047
3.6689
7
5.5914
4.7374
4.3468
4.1203
3.9715
3.866
3.787
3.7257
3.6767
3.6365
3.5747
3.5107
3.4445
3.4105
3.3758
3.3404
3.3043
3.2674
3.2298
8
5.3177
4.459
4.0662
3.8379
3.6875
3.5806
3.5005
3.4381
3.3881
3.3472
3.2839
3.2184
3.1503
3.1152
3.0794
3.0428
3.0053
2.9669
2.9276
9
5.1174
4.2565
3.8625
3.6331
3.4817
3.3738
3.2927
3.2296
3.1789
3.1373
3.0729
3.0061
2.9365
2.9005
2.8637
2.8259
2.7872
2.7475
2.7067
10
4.9646
4.1028
3.7083
3.478
3.3258
3.2172
3.1355
3.0717
3.0204
2.9782
2.913
2.845
2.774
2.7372
2.6996
2.6609
2.6211
2.5801
2.5379
11
4.8443
3.9823
3.5874
3.3567
3.2039
3.0946
3.0123
2.948
2.8962
2.8536
2.7876
2.7186
2.6464
2.609
2.5705
2.5309
2.4901
2.448
2.4045
12
4.7472
3.8853
3.4903
3.2.592 3.1059
2.9961
2.9134
2.8486
2.7964
2.7534
2.6866
2.6169
2.5436
2.5055
2.4663
2.4259
2.3842
2.341
2.2962
13
4.6672
3.8056
3.4105
3.1791
3.0254
2.9153
2.8321
2.7669
2.7144
2.671
2.6037
2.5331
2.4589
2.4202
2.3803
2.3392
2.2966
2.2524
2.2064
14
4.6001
3.7389
3.3439
3.1122
2.9582
2.8477
2.7642
2.6987
2.6458
2.6022
2.5342
2.463
2.3879
2.3487
2.3082
2.2664
2.2229
2.1778
2.1307
15
4.5431
3.6823
3.2874
3.0556
2.9013
2.7905
2.7066
2.6408
2.5876
2.5437
2.4753
2.4034
2.3275
2.2878
2.2468
2.2043
2.1601
2.1141
2.0658
16
4.494
3.6337
3.2389
3.0069
2.8524
2.7413
2.6572
2.5911
2.5377
2.4935
2.4247
2.3522
2.2756
2.2354
2.1938
2.1507
2.1058
2.0589
2.0096
17
4.4513
3.5915
3.1968
2.9647
2.81
2.6987
2.6143
2.548
2.4943
2.4499
2.3807
2.3077
2.2304
2.1898
2.1477
2.104
2.0584
2.0107
1.9604
18
4.4139
3.5546
3.1599
2.9277
2.7729
2.6613
2.5767
2.5102
2.4563
2.4117
2.3421
2.2686
2.1906
2.1497
2.1071
2.0629
2.0166
J.9681
J.9163
19
4.3807
3.5219
3.1274
2.8951
2.7401
2.6283
2.5435
2.4768
2.4227
2.3779
2.308
2.2341
2.1555
2.1141
2.0712
2.0264
J.9795
J.9302
1.878
20
4.3512
3.4928
3.0984
2.8661
2.7109
2.599
2.514
2.4471
2.3928
2.3479
2.2776
2.2033
2.1242
2.0825
2.0391
J.9938
1.9464
1.8963
J.8432
21
4.3248
3.4668
3.0725
2.8401
2.6848
2.5727
2.4876
2.4205
2.366
2.321
2.2504
2.1757
2.096
2.054
2.0102
J.9645
J.9165
J.8657
J.8117
22
4.3009
3.4434
3.0491
2.8167
2.6613
2.5491
2.4638
2.3965
2.3419
2.2967
2.2258
2.1508
2.0707
2.0283
J.9842
1.938
1.8894
1.838
1.7831
23
4.2793
3.4221
3.028
2.7955
2.64
2.5277
2.4422
2.3748
2.3201
2.2747
2.2036
2.1282
2.0476
2.005
1.9605
1.9139
J.8648
1.8128
J.757
24
4.2597
3.4028
3.0088
2.7763
2.6207
2.5082
2.4226
2.3551
2.3002
2.2547
2.1834
2.1077
2.0267
1.9838
1.939
1.892
J.8424
J.7896
1.733
25
4.2417
3.3852
2.9912
2.7587
2.603
2.4904
2.4047
2.3371
2.2821
2.2365
2.1649
2.0889
2.0075
J.9643
J.9192
J.8718
J.8217
1.7684
1.711
26
4.2252
3.369
2.9752
2.7426
2.5868
2.4741
2.3883
2.3205
2.2655
2.2197
2.1479
2.0716
1.9898
1.9464
1.901
1.8533
1.8027
1.7488
1.6906
27
4.21
3.3541
2.9604
2.7278
2.5719
2.4591
2.3732
2.3053
2.2501
2.2043
2.1323
2.0558
1.9736
1.9299
1.8842
J.8361
1.7851
J.7306
1.6717
28
4.196
3.3404
2.9467
2.7141
2.5581
2.4453
2.3593
2.2913
2.236
2.19
2.1179
2.0411
1.9586
1.9147
1.8687
1.8203
1.7689
1.7138
1.6541
29
4.183
3.3277
2.934
2.7014
2.5454
2.4324
2.3463
2.2783
2.2229
2.1768
2.1045
2.0275
1.9446
1.9005
1.8543
1.8055
1.7537
1.6981
1.6376
30
4.1709
3.3158
2.9223
2.6896
2.5336
2.4205
2.3343
2.2662
2.2107
2.1646
2.0921
2.0148
1.9317
1.8874
1.8409
1.7918
1.7396
1.6835
1.6223
40
4.0847
3.2317
2.8387
2.606
2.4495
2.3359
2.249
2.1802
2.124
2.0772
2.0035
1.9245
1.8389
1.7929
1.7444
1.6928
1.6373
1.5766
J.5089
60
4.0012
3.1504
2.7581
2.5252
2.3683
2.2541
2.1665
2.097
2.0401
1.9926
1.9174
1.8364
1.748
1.7001
1.6491
1.5943
1.5343
1.4673
1.3893
120
3.9201
3.0718
2.6802
2.4472
2.2899
2.175
2.0868
2.0164
1.9588
J.9105
J.8337
1.7505
1.6587
1.6084
1.5543
1.4952
1.429
1.3519
1.2539
inf
3.8415
2.9957
2.6049
2.3719
2.2141
2.0986
2.0096
1.9384
1.8799
1.8307
1.7522
1.6664
1.5705
1.5173
1.4591
1.394
1.318
1.2214
I

1.8 Page 8

▲back to top


APPENDIX C: The St-a-n-d~ard Normal D-,istribution
l
0.00
0.0 0.0000
0.1 0.0398
0.2 0.0793
0-.3 0.1179
0.4 0.1554
0.5 I0.1915
0.6 0.2257
0.7 0.2580
0.8 0.2881
0.9 I 0.3159
1.0 I o.3413
1.1 I o.3643
1.2 0.3849
1.3 0.4032
1.4 0.4192
1.5 0.4332
1.6 . 10.4452
1.7 0.4554
1.8 0.4641
1.9 0.4713
2.0 0.4772
2.1 I0.4821
2.2 0.4861
2.3 0.4893
2.4 0.4918
2.5 Io.4938
I 2.6 0.4953
2.7 0.4965
2.8 0.4974
2.9 Io.4981
3.0 l 0.4987
/~·
_,,,,.,.
0.01
0.0040
I 0.02
0.03
0.0080 I0.0120
0.0438 lo.0478 I 0.0517
0.0832 0.0871 0.0910
0.1217
0.1591
0.1255
'I
10.1628
0.1293
0.1664
0.1950 [0.1985 I 0.2019
0.2291 0.2324 0.2357
0.2611 0.2642 0.2673
0.2910 0.2939 0.2967
0.3186
0.3438
0.3212
I10.3461
0.3238
0.3485
0.3665 [o.3686 I o.3708
0.3869 !o.3888 J o.39o7
0.4049 0.4066 0.4082
0.4207 Io.4222 0.4236
0.4345 I 0.4357 0.4370
,0.4463 [o.4474 0.4484
0.4564
0.4649
lo.4573
I
'0.4656
0.4582
0.4664
0.4719 0.4726 0.4732
0.4778 0.4783 0.4788
10.4826 [o.4830 0.4834
0.4864 lo.4868 I 0.4371
0.4896 0.4898 0.4901
0.4920
,0.4940
0.4955
l 10.4922
[o.4941
. lo.4956
0.4925
I o.4943
0.4957
0.4966 0.4967 0.4968
0.4975
lo.4982
,o.4987
---····-
0.4976
l?:~~~2_
[e.4987
0.4977
I o.4983
Io.4988
..•
".....'----
·o z
J
0.04
0.0160
0.0557
0.0948
10.1331
0.1700
0.2054
0.2389
0.2704
.10·.2995
0.3264
0.3508
0.3729
0.3925
0.4099
0.4251
10.4382
0.4495
0.4591
0.4671
,o.4738
0.4793
0.4838
0.4875
0.4904
0.4927
0.4945
0.4959
0.4969
0.4977
0.4984
0.4988
0.05
0.0199
0.0596
0.0987
0.1368
0.1736
0.2088
0.2422
0.2734
0.3023
0.3289
0.3531
0.3749
0.3944
0.4115
0.4265
0.4394
0.4505
0.4599
0.4678
0.4744
0.4798
0.4842
0.4878
0.4906
0.4929
10.4946
0.4960
0.4970
0.4978
10.4984
0.4989
I 0.06
I 0.0239
I 0.0636
I 0.1026
I 0.1406
0.1772
0.2123
I 0.2454
I 0.2764
Io.3051
j,o.3315
10.3554
Jo.3770
0.3962
I 0.4131
0.4279
I 0.440.6
lo.4515
10.4608
I 0.4686
I 0.4750
I0.4803
Jo.4846
0.4881
1o.4909
I 0.4931
10.4948
0.4961
I 0.4971
I 0.4979
1
jo.4985
0.4989
0.07
0.0279
0.0675
0.1064
0.1443
0.1808
0.2157
0.2486
, 0.2794
0.3078
0.3340
0.3577
0.3790
0.3980
0.4147
0.4292
0.4418
0.4525
0.4616
0.4693
, 0.4756
0.4808
0.4850
0.4884
0.4911
I 0.4932
0.4949
0.4962
I 0.4972
0.4979
0.4985
0.4989
0.08
0.0319
0.0714
0.1103
I 0.09
I 0.0359
I 0.0753
I 0.1141
0.1480 ![0.1517
0.1844 [o.1879
I
0.2190
10.2224
l
0.2517 I0.2549 I
.I 0.2823
0.3106
[_0.2852
I
-
o.3133
0.3365 110.3389
0.3599 10.3621
0.3810 [o.3830
0.3997 10.4015
0.4162 .0.4177
0.4306
fo.4429
10.4319
I 0.4441
0.4535 IJ0.4545 I
0.4625 lo.4633 I
0.4699 I 0.4706
0.4761 Io.4767
0.4812 I'0.4817
0.4854 i0.4857
0.4887
0.4913
0.4890
I o.4916
0.4934
0.4951
I 0.4936
110.4952
0.4963 0.4964
0.4973 10.4974
0.4980 I10.4981
i 0.4986 11?-4986
0.4990 10.4990
-
I

1.9 Page 9

▲back to top


APPENDIX D: The t-distribution
/'-- -7-...-:-.
.\\
':,_,,.,,-/
_,'.t_·~Jp,.d_f"L
df\\p
0.40
1
0.324920
2
0.288675
3 I 0.276671
4
0.270722
5
0.267181
6
0.264835
7 I o.2s31s7
0.25
I
I
11.000000
10.816497
lo.764892
0.740697
0.726687
10.717558
10.711142
0.10
1.637744
1.533206
1.475884
I
11.439756
I 1.414924
0.05
6.313752
2.919986
I 2.353363
2.131847
2.015048
1.943180
1.894579
0.025
12.70620
4.30265
,3.18245
2.77645
2.57058
2.44691
2.36462
I 0.01
131.82052
I 6.96456
14.54070
13.74695
13.36493
13.14267
I 2_99795
8
0.261921 0.706387 1.396815 1.859548 2.30600
2.89646
9
0.260955 _ 10,702722 1.383029 1.833113 2.26216 j 2.82144
10
0.260185 10.6~9812 1.372184 1.812461 2.22814 ] 2.76377
11 I 0.259556 10.697445 1.363430 1.795885 2.20099 .12.71808
12
I 0.259033
ro.695483
··-
-
_
[1.356217
I 1.782288
12.17881
'[2.68100
13
0.258591 0.693829 l1.350171 II 1.770933 2.16037
12.65031
14
0.258213 0.692417 1.345030 1.761310 2.14479
2.62449
15
0.257885 0.691197 I 1.340606 1.753050 2.13145 ] 2.60248
16
0.257599 jo.690132 I 1.335757 1.745884 2.11991 !2.58349
17
0.257347 0.689195 1.333379 1.739607 2.10982
2.56693
18
0.257123 10.688364 II 1.330391 1.734064 2.10092
2.55238
I
19
I0.256923 10.687621 11.327728
1.729133
2.09302
12.53948
20 I 0.256743 10.686954 [1.325341 1.724718 2.08596 1,2.52798
21
0.256580 0.686352 1.323188 1.720743 2.07961
2.51765
22
0.256432 0.685805 [ 1.321237 1.717144 2.07387
2.50832
I
I
23
0.256297 10.685306 I 1.319460 1.713872 2.06866 12.49987
24
0.256173 0.684850 1.317836 [ 1.710882 2.06390
12.49216
25 0.256060 0.684430
26 _I0.255955 _ l?-684?43
27 10.255858 lo.683685
28
0.255768 0.683353
29
0.255684 [0.683044
30
I
0.255605
.. I
0.682756
inf
0.253347 10.674490
1.316345
'
I ~.314972
11.313703
1.312527
11.311434
"I 1.310415
I.
11.281552
1.708141
1.705618
i 1.703288
1.701131
1.699127
I 1.697261
1.644854
2.05954
2.05553
2.05183
2.04841
2.04523
2.04227
1.95996
2.48511
'
1.2.47863
[2.47266
12.46714
·'
12.46202
2.45726
I
I
2.32635
0.005
63.65674
9.92484
5.84091
4.60409
14.03214
3.70743
3.49948
3.35539
3.24984
3.16927
3.10581
3.05454
3.01228
2.97684
2.94671
2.92078
2.89823
2.87844
2.86093
2.84534
2.83136
2.81876
2.80734
2.79694
2.78744
2.77871
2.77068
2.76326
2.75639
I 2.75000
2.57583
0.0005
636.6192
31.5991
12.9240
8.6103
6.8688
5.9588
5.4079
5.0413
4.7809
4.5869
4.4370
4.3178
4.2208
4.1405
4.0728
I
4.0150
3.9651
3.9216
1 3.8834
3.8495
3.8193
3.7921
13.7676
3.7454
3.7251
3.7066
3.6896
3.6739
3.6594
3.6460
3.2905

1.10 Page 10

▲back to top


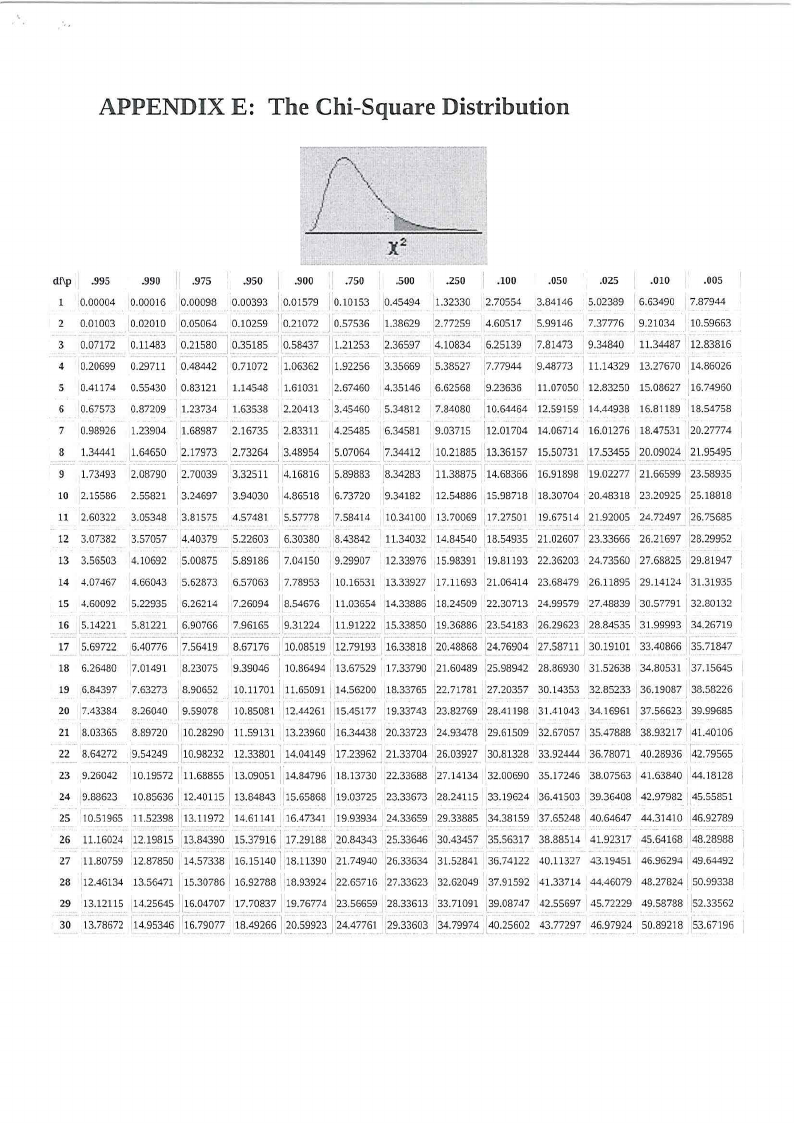
APPENDIX E: The Chi-Square Distribution
df\\p .995
.990
.975
.950
.900
.750
.500
.250 I .100
.050
.025
.010
.005
1 0.00004 0.00016 l0.00098 0.00393 I 0.01579 I 0.10153 10.45494 11.32330 1 2.70554 3.84146 5.02389 16.63490 j 7.87944
2 0.01003 0.02010 10.05064 0.10259 l'o.21072 J o.57536 11.38629 12.77259 4.60517 5.99146 7.37776 19.21034 110.59663
I 3 0.07172 o.11483 0.21580 i o.35185 lo.58437 111.21253 2.36597 4.10834 6.25139 ~7.81473 9.34840 ll.34487112.83816
4 0.20699 0.29711 ·1oA8442 0.71072 11.06362 f 1.92256 3.35669 5.38527 17.77944 9.48773 11.14329 13.27670 114.86026
s o.41174 o.55430 I o.83121 1.14548 1.61031 12.67460 4.35146 6.62568 19.23636 11.07050 12.83250 15.08627 116.74960
6 0.67573 0.87209 11.23734 l.63538 2.20413 ·13.45460 5.34812 7.84080 110.64464 12.59159 14.44938 16.81189 18.54758
I 7 0.98926 1.23904 1.68987 2.16735 2.83311 4.25485 6.34581 9.03715 12.01704 14.06714 16.01276 18.47531 120.27774
1
I 7 s 1.34441 1.64650 12.17973 2.73264 _ ?.48954 15.07064_ 1 .34412 110.21885 ,13.36157 15.50731 17.53455 20.09024 21.95495
I I 9 1.73493 2.08790 12.70039 3.32511 114.16816 5.89883 [8.34283 111.38875 14.68366 16.91898 19_02277 21.66599123.58935
10 2.15586 2.55821 13.24697 13.94030 14.86518 16.73720 19.34182 112.54886 15.98718 18.30704 '20.48318 23.20925125.18818
11 2.60322 3.05348 I 3.81575 4.57481 5.57778 17.58414 10.34100 13.70069 ;17.2750 I 19.67514 21.92005 24.72497 126.75685
12 3.07382
13 3.56503
14 4.07467
3.57057
4.10692
4.66043
•4.40379
,5.00875
5.62873
5.22603
5.89186
6.57063
[ 6.30380
J 7.04150
17.78953
8.43842
19.29907
I 10.16531
11.34032
12.33976
13.33927
14.84540 118.54935 21.02607
I 15.98391 19.81193 22.36203
17.11693 '21.06414 23.68479
23.33666
24.73560
26.11895
26.21697 128.29952
27.68825 29.81947
29.14124 31.31935
15 4.60092
16 5.14221
17 5.69722
1s 6.26480
19 6.84397
20 7.43384
5.22935
5.81221
6.40776
6.26214 7.26094
j 6.90766 j 7.96165
I17.56419 ·1 8.67176
[ 8.54676
19.31224
{10.08519
11.03654 j14.33886 JlS.24509 22.30713 24.99579
I 111.91222 15.33850 l19.36886 ,23.54183 26.29623
[1i79193 '16.33818 20.48868 (_24.76904 27.58711
27.48839 [ 30.57791 i 32.80132
28.84535 I 31,99993 j 34.26719
30.19101 33.40866 35.71847
7.01491 18.23075 9.39046 I 10.86494 I 13.67529 17.33790 121.60489 J25.98942 28.86930 31.52638 34.80531 137.15645
7.63273 8.90652 10.11701 I 11.65091 114.56200 18.33765 122.71781 '27.20357 30.14353 32.85233 36.19087 38.58226
8.26040 19.59078 110.85081 112.44261 II15.45177 J19.33743 123.82769 28.4ll 98 31.41043 34.16961 [ 37.56623 139.99685
21 8.03365 8.89720 110.28290 11.59131 13.23960 J16.34438 20.33723 :24.93478 129.61509 32.67057 35.47888 38.93217 41.40106
22 8.64272 9.54249 1l10.98232 12.33801 i.~4.04149 117.23962 ,_21.33704 26.03927 J30.8132~ 33.92444 36.78071 40.28936 142.79565
23 9.26042 10.19572 j'u.68855 13.09051 I 14.847961,18.13730 122.33688 [27.14134 132.00690 35.17246 38.07563 I41.63840 144.18128
24 9.88623 10.85636 [ 12.40115113.84843 115.658681119.03725 123.33673 128.24115 33.19624 36.41503 39.36408 I 42.97982 I 45.55851
25 10.51965 ll.52398113.1197_2 14.61141, 16.4734_1 [19.93934 24.33659 29.33885 134.38159 37.65248 40.64647 44.31410 146.92789
1
26 11.16024 12.19815 13.84390 __15.37916117.29188 I 20.84343 25.33646 30.43457 135.56317 38.88514 41.92317 45.64168 148.28988
1
27 11.80759 12.87850 114.57338 I 16.15140118.11390] 21.74940 j26.33634 131.52841 36.74122 40.11327 43.19451 46.96294 j 49.64492
2a 12.46134 13.56471 I 15.3078G \\ 1G.92788 irn.93924 l22.65716 127.33623 32.62049 p.91592 41.33714 44.46079 48.278241 50.99338
29 n12115 14.25645 I116.04707 17.70837119.76774 123.56659 I 28.33613 33.71091 139.08747 42.55697 45.72229 49.58788 152.33562
30 13.78672 114.95346 116.79077 18.~9266J?o.5J923j 2~.47761 :29.33603 '134.79974 [~o.25so2_ 43.77297 46.97924 50.89218 153.G7196

2 Pages 11-20

▲back to top


2.1 Page 11

▲back to top


Critical Values of the Mann-Whitney U
(Two-Tailed Testing)
n1 a. 3
4
5
6
7
8
n1
9 ·10 I l 12 13 14 15 16 17 18 19 20
3
.05 --
.01 --
0
0
0
0
I
0
I
0
')
0
2
0
3
0
3
0
4
l
4
1
5
l
5
2
6
2
6
2
7
2
7
3
8
3
4
.05 --
.01 --
0
--
I
0
2
0
3
0
4
I
4
I
5
2
6
2
7
3
8
3
9
4
IO I I I I 12 13 14
556678
5
.05 0
.01 --
1
--
2
0
3
I
5
I
6
2
7
3
8
4
9
5
1I 12 13 14 15 17 I8 19 20
6 7 7 8 9 10 11 12 13
6
.05 1
.01 --
2
0
3
I
5
2
6
3
8
4
10 II
56
13 14 16 17 19 21 22 24 25 27
7 9 JO I I 12 13 15 16 17 18
7
.05
.01
1
--
3
0
5
I
6
3
8
4
IO 12 14 16 18 20 22 24 26 28 30 32 34
6 7 9 10 12 13 15 16 18 19 21 "2 24
8
.05 2
.OJ --
4
I
9
.05
.01
2
0
4
I
6
2
7
3
8 IO 13 15 17 19 22 24 26 29 3 I 34 36 38 41
,,~ 4
10
6
12
7
15
9 II
17 20
_13.,
15
26
17 18 20
28 31 34
22
37
24
39
26
42
28
45
30
48
5 7 9 11 13 16 I8 20 22 24 27 29 31 33 36
10
.05
.01
3
0
5
2
8
4
I I 14 17 20 23 26 29 33 36 39 42 45 48 52 55
6 9 I I 13 16 I8 21 "4 26 29 31 34 37 39 42
11
.05
.01
3
0
6
2
9
5
13 16 19 23 26 30 33 37 40 44 47 51 55 58 62
7 IO 13 16 18 21 24 27 30 33 36 39 42 45 48
12
.05
.01
4
I
7
3
I I 14 18 22 26 29 33 37 41 45 49 53 57 61 65 69
6 9 12 15 18 21 24 27 31 34 37 41 44 47 51 54
13
.05
.01
4
1
8
3
12 16 20 24 28 33 37 41 45 50 54 59 63 67 72 76
7 10 13 17 20 24 27 3 I 34 38 42 45 49 53 56 60
14
.05
.01
5
1
9
4
13 17 22 26 3 I 36 40 45 50 55 59 64 67 74 78 83
7 11 15 18 22 26 30 34 38 42 46 50 54 58 63 67
15
.05
.01
5
2
10 14 19 24 29 34 39 44 49 54 59 64 70 75 80 85 90
5 8 12 16 20 24 29 33 37 42 46 51 55 60 64 69 73
16
.05
.01
6
2
11 15 21 26 31 37 42 47 53 59 64 70 75 81 86 92 98
5 9 13 18 22 27 31 36 41 45 50 55 60 65 70 74 79
17
.05
.01
6
2
I I 17 22 28 34 39 45 51 57 63 67 75 81 87 93 99 105
6 10 I5 19 24 29 34 39 44 49 54 60 65 70 75 81 86
I8
.05
.01
7
2
12 I8 24 30 36 42 48 55 61 67 74 80 86 93 99 106 112
6 11 16 21 "6 3 I 37 42 47 53 58 64 70 75 81 87 92
19
.05
.01
7
3
13 19 25 32 38 45 52 58 65 72 78 85 92 99 106 113 I 19
7 12 17 22 28 33 39 45 5 I 56 63 69 74 81 87 93 99
20
.05
.01
8
3
14 20 27 34 41 48 55 62 69 76 83 90 98 105 I 12 I I9 127
8 13 18 24 30 36 42 48 54 60 67 73 79 86 92 99 105