ETP720S - Experimental Techniques for Process Engineers 324 - 2nd Opp. Nov 2022


ETP720S - Experimental Techniques for Process Engineers 324 - 2nd Opp. Nov 2022


1 Pages 1-10

▲back to top


1.1 Page 1

▲back to top


nAmlBIA UnlVERSITY
OF SCIEnCE Ano TECHno LOGY
FACULTYOF ENGINEERINGAND THE BUILTENVIRONMENT
SCHOOLOF ENGINEERING
DEPARTMENTOF CIVIL, MINING & PROCESSENGINEERING
QUALIFICATION(S): BACHELOR OF ENGINEERING IN METALLURGY & CHEMICAL ENGINEERING
QUALIFICATION CODE: 08BEMT & 08BECE LEVEL: 7
COURSE CODE: ETP720S
SESSION: NOVEMBER 2022
DURATION: 3 HOURS
COURSE NAME: EXPERIMENTAL TECHNIQUES
FOR PROCESSENGINEERS 324
PAPER: THEORY
MARKS: 100
EXAMINER:
MODERATOR:
SECONDOPPORTUNITYQUESTION PAPER
MR. THOMAS MOONGO
PROF. JONAS ADDAI-MENSAH
INSTRUCTIONS
1. Answer all questions.
2. Read all the questions carefully before answering.
3. Marks for each questions are indicated at the end of each question.
4. Please ensure that your writing is legible, neat, and presentable.
PERMISSIBLEMATERIALS
1. Examination paper.
2. Calculator and stationary.
THIS QUESTION PAPER CONSISTS OF 9 PAGES (Including this front page)
llPage

1.2 Page 2

▲back to top


1.3 Page 3

▲back to top


SECTIONA
[30 marks]
Question 1
[5 marks]
Create an appropriate flow sheet to illustrate logically sequenced steps of the experiment process.
_ At least five (5) experiment process steps should be considered.
Question 2
[5 marks]
What is a fractional factorial design? Explain the main use and experiments for which you will
consider utilizing fractional factorial design.
Question 3
Justify why randomization is critical in the design of experiments (DOE).
[5 marks]
Question 4
[5 marks]
Sampling nomographs are useful during the execution of experiments. Discussthe application of a
nomograph for preparing a gold sample as shown below by explaining the sampling steps and
quantities (in terms of sampling error and sample mass) involved here.
1 _E-01
1 _E-02
.... 1_E-03
wE
c..C')
.E
1-E-04
eEcna
1_E-05
1 _E-06
1 _E-07
1
10
100
1000
Sample 1nass (grains)
10000
100000
--- -- ------
Question 5
[S marks]
Discuss the .application of the Beer-Lambert equation/law when conducting process engineering
experiments.
---
=,c_0 _ •.,.,,,J~/J_hJef.eJ_en~t~_oth_e-"b_eJogwraph, explain how the calibration curve is cr_~ated_a_!:ld appli~q-.Q!:lfi_Qg--="'==""
-
-
_;;- ___
_z..:.:.....;.::.
the experimentation process especially when it comes to the chemical analysis of samples.
21Page
- -- -·------ - - -------
- -- -----·-·-

1.4 Page 4

▲back to top


1.5 Page 5

▲back to top


80
70
. Cl) 60
1/)
C
8.
50
1/)
-C..l).. 40
C
Cl)
30
-E
2 20
1/)
C 10
= y 52.357x + 0.6286
= r 0.9997
0
0
0.2
0.4
0.6
0.8
1.2
1.4
Concentration /mg L·1
3IPage
- - -- .-...::..:.c --=- ~--~...:-- ---===--·-

1.6 Page 6

▲back to top


1.7 Page 7

▲back to top


SECTION B
[70 marks]
Question 1
[10 marks]
Process engineers are conducting experiments in the oil and gas industry for the recently discovered
oil in Namibia. A 23 full factorial experiment was carried out to understand the interaction between
factor A and B. Calculate the interaction between factor A and B. In addition to that use the graphical
method to illustrate if there is an interaction between factor A and B.
Run
Run
A
B
(standard order) (randomized order)
1
5
-1
-1
2
7
+l
-1
3
4
-1
+l
4
1
+l
+l
5
8
-1
-1
6
3
+1
-1
7
2
-1
+l
8
6
+1
+1
C
Response
(ppm)
-1
420,412
-1
370,375
-1
310,289
-1
410,415
+l
375,388
+1
450,442
+1
325,322
+l
350,340
Question 2
[10 marks]
The table below show experimental data obtained from Ohorongo Cement in Namibia.
324 401 203 458 156
253 159 318 376 376
313 189 524 362 413
Answer the following questions:
(a) Determine the measures of central tendency using the given data.
(b) Compute the measures of spread using the given data.
[3 marks]
[7 marks]
Question 3
[10 marks]
As part of ensuring a safe working environment Dundee Precious Metal Tsumeb smelter is applying
the vitrification process to create glass products from arsenic wastes. Experiments were conducted
and the data is shown below. Calculate the 95% confidence interval about the mean.
16.968 16.922 16.840
16.887 16.977 16.857
16.883
16.728
41Page

1.8 Page 8

▲back to top


1.9 Page 9

▲back to top


Question 4
[10 marks]
A chemical engineering company management believes that the average cost for atomic absorption
spectroscopy (AAS) analysis is N$175 per sample. To test this belief, the chemical engineering
company management conducted a survey among a random sample of 360 laboratories. Based on
the survey, the average cost for AAS analysis was N$182.40 per sample. Assuming that the
population of AAS analysis cost is normally distributed with a standard deviation, a, of N$67.50.
Can the chemical engineering company management conclude that the AAS analysis cost N$175 per
sample, on average? Conduct a test at the 5% level of significance. Clearly show all the steps,
illustration sketch and interpolate if necessary.
Question 5
[10 marks]
Namib Lead and Zinc Mine is considering undertaking experiments to improve process efficiencies.
First, they are considering determining the minimum quantity of a sample required for metallurgical
testwork for a lead ore assaying 5% Pb which must be routinely sampled for assay to a confidence
level of ±0.1% Pb, 95 times out of 100. Galena is essentially liberated from the quartz gangue at a
particle size of 150µm. Assume that the sample will be collected during crushing to a top size of 25
mm. The mean density of Galena and Quartz is 7.50 g/cm 3 and 2.65 g/cm 3.
Question 6
[20 marks]
Experiments conducted for the design of a nuclear reactor in Namibia resulted in the data given in
the table below. Use the data to answer the following questions:
X4
4
3
2
5
2
4
3 5 5 .. - -.3~ .4
y 26 28 24 18 35 24 36 25 31 37 30 32
(a) Determine the value of variable y when x = 7 and calculate Pearson's correlation coefficient
by using the appropriate formula.
= .:·- (b) At the
5% level of significance, test whether
the
population
correlation
-_-___-.-=----=-:·,
~-:-·c---o~- -e;_-:·f=;f:=-i-··-c=i=e-nt·,
-p, - -- -_
:;_=,;;;:--··=
between variable x and y is actually zero. Clearly show all your steps and draw asketcn Lising
: . ·---...:.:.:.":.-'·-·.:":.:-·:.. .,_--·•---·:::::.:-~-
an appropriate statistical testing method for the correlation coefficient.~
- '{10-rriarks]
SI Page
- - ----
--
..
--------
, ...._.__-- ---·-·
. -- ----
.-

1.10 Page 10

▲back to top


2 Pages 11-20

▲back to top


2.1 Page 11

▲back to top


List of Equations
t-crit = tca,n-1)
Range= X1argest - Xsmallest
C = fglm
IA,B =½(EA,8(+1) - EA,B(-1))
y=b 0 +b 1x
z-stat =-xu--µ
rn
(J
Clx=- yn
r=-J[-n=:E=x =2 -=n(:=:EExx=y)2=]-x:=[Enx:=E:Ey=y =2 - (:Ey)2]
cr2= ICx- µ)2
N
E = zxy.!n!....
M=-
Cd 3
sz
Cl= L~1(Xi- µ)2
N
t-stat
x-µ
=-s-
,/n
b _ n:Exy - :Ex:Ey
1 - n:Exz - (:Ex)Z
S=
:Ef=1(xi- x)z
n-1
m =-1[(-aa1-
a)r + at]
s2 =- 1-I(x - x)2
n-1
GI Page
---- ----- -=-------- ==-=-
- ..:....:------==------ --·
- --- --- ---

2.2 Page 12

▲back to top


2.3 Page 13

▲back to top


STATISTICALTABLES
TABLEA.1
Cumulative Standardized Normal Distribution
A(z) is the integral of the standardized normal distribution
from - ooto z (in other words, the area under the curve to
the left of z). It gives theprobability of a normal random
variable not being more than z standard deviations above
its mean. Values of z of particular importance:
z
1.645
1.960
2.326
2.576
3.090
3.291
A(z
0.9500
0.9750
0.9900
0.9950
0.9990
0.9995
Lower limit of right 5% tail
Lower limit of right 2.5% tail
Lower limit of right I% tail
Lower limit of right 0.5% tail
Lower limit of right 0.1 % tail
Lower limit of right 0.05% tail
-4 -3
z
0.00
0.0 0.5000
0.1 0.5398
0.2 0.5793
0.3 0.6179
0.4 0.6554
0.5 0.6915
0.6 0.7257
0.7 0.7580
0.8 0.7881
0.9 0.8159
1.0 0.8413
I.I 0.8643
1.2 0.8849
1.3 0.9032
1.4 0.9192
1.5 0.9332
1.6 0.9452
1.7 0.9554
1.8 0.9641
1.9 0.9713
2.0 0.9772
2.1 0.9821
2.2 0.9861
2.3 0.9893
2.4 0.9918
2.5 0.9938
2.6 0.9953
2.7 0.9965
2.8 0.9974
2.9 0.9981
3.0 0.9987
3.1 0.9990
3.2 0.9993
3.3 0.9995
3.4 0.9997
3.5 0.9998
3.6 0.9998
-2
-1
0
0.01
O.o2
0.5040
0.5438
0.5832
0.6217
0.6591
0.6950
0.7291
0.7611
0.7910
0.8186
0.8438
0.8665
0.8869
0.9049
0.9207
0.9345
0.9463
0.9564
0.9649
0.9719
0.9778
0.9826
0.9864
0.9896
0.9920
0.9940
0.9955
0.9966
0.9975
0.9982
0.9987
0.9991
0.9993
0.9995
0.9997
0.9998
0.9998
0.5080
0.5478
0.5871
0.6255
0.6628
0.6985
0.7324
0.7642
0.7939
0.8212
0.8461
0.8686
0.8888
0.9066
0.9222
0.9357
0.9474
0.9573
0.9656
0.9726
0.9783
0.9830
0.9868
0.9898
0.9922
0.9941
0.9956
0.9967
0.9976
0.9982
0.9987
0.9991
0.9994
0.9995
0.9997
0.9998
0.9999
1z 2
0.03
0.5120
0.5517
0.5910
0.6293
0.6664
0.7019
0.7357
0.7673
0.7967
0.8238
0.8485
0.8708
0.8907
0.9082
0.9236
0.9370
0.9484
0.9582
0.9664
0.9732
0.9788
0.9834
0.9871
0.9901
0.9925
0.9943
0.9957
0.9968
0.9977
0.9983
0.9988
0.9991
0.9994
0.9996
0.9997
0.9998
3
4
0.04
0.05
0.5160
0.5557
0.5948
0.6331
0.6700
0.7054
0.7389
0.7704
0.7995
0.8264
0.8508
0.8729
0.8925
0.9099
0.9251
0.9382
0.9495
0.9591
0.9671
0.9738
0.9793
0.9838
0.9875
0.9904
0.9927
0.9945
0.9959
0.9969
0.9977
0.9984
0.9988
0.9992
0.9994
0.9996
0.9997
0.9998
0.5199
0.5596
0.5987
0.6368
0.6736
0.7088
0.7422
0.7734
0.8023
0.8289
0.8531
0.8749
0.8944
0.9115
0.9265
0.9394
0.9505
0.9599
0.9678
0.9744
0.9798
0.9842
0.9878
0.9906
0.9929
0.9946
0.9960
0.9970
0.9978
0.9984
0.9989
0.9992
0.9994
0.9996
0.9997
0.9998
0.06
0.5239
0.5636
0.6026
0.6406
0.6772
0.7123
0.7454
0.7764
0.8051
0.8315
0.8554
0.8770
0.8962
0.9131
0.9279
0.9406
0.9515
0.9608
0.9686
0.9750
0.9803
0.9846
0.9881
0.9909
0.9931
0.9948
0.9961
0.9971
0.9979
0.9985
0.9989
0.9992
0.9994
0.9996
0.9997
0.9998
0.07
0.5279
0.5675
0.6064
0.6443
0.6808
0.7157
0.7486
0.7794
0.8078
0.8340
0.8577
0.8790
0.8980
0.9147
0.9292
0.9418
0.9525
0.9616
0.9693
0.9756
0.9808
0.9850
0.9884
0.991 I
0.9932
0.9949
0.9962
0.9972
0.9979
0.9985
0.9989
0.9992
0.9995
0.9996
0.9997
0.9998
0.08
0.09
0.5319 0.5359
0.5714 0.5753
0.6103 0.6141
0.6480 0.6517
0.6844 0.6879
0.7190 0.7224
0.7517 0.7549
0.7823 0.7852
0.8106 0.8133
0.8365 0.8389
0.8599 0.8621
0.8810 0.8830
0.8997 0.9015
0.9162 0.9177
0.9306 0.9319
0.9429 0.9441
0.9535 0.9545
0.9625 0.9633
0.9699 0.9706
0.9761 0.9767
0.9812 0.9817
0:9854· 0.9857 -
0.9887 0.9890
0.9913 0.9916
0.9934 0.9936
0.9951 0.9952
0.9963 0.9964
0.9973 0.9974
o'.°9980 - 0.9981
0.9986 0.9986
0.9990 0.9990
·0:9993:~ 0.9993
0.9995 0.9995
Q.9_996_ 0.9997
0.9997 0.9998
0.9998 0.9998
71Page

2.4 Page 14

▲back to top


2.5 Page 15

▲back to top


Degrees of
freedom
.1
2
3
4
5
6
7
8
9
10
11
12
13
14
15
16
17
18
19
20
21
22
23
24
25
26
27
28
29
30
32
34
36
38
40
42
44
46
48
50
60
70
80
90
100
120
150
200
300
400
500
600
00
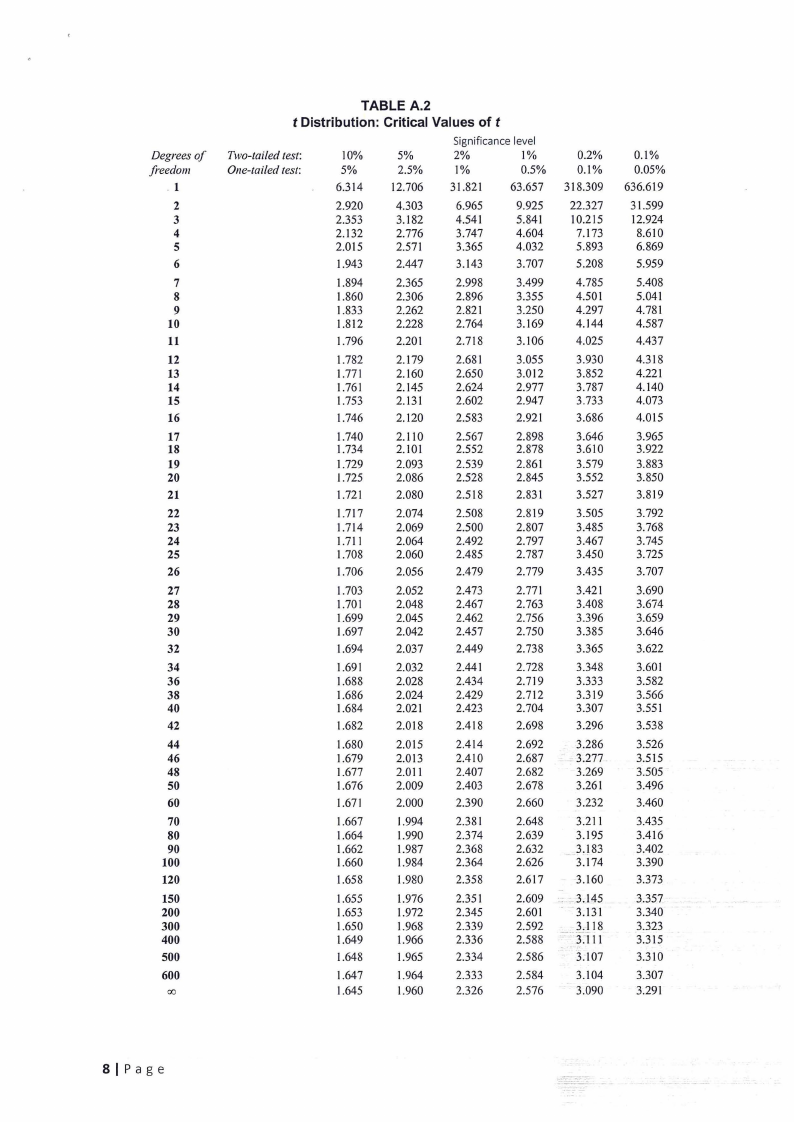
TABLE A.2
t Distribution: Critical Values oft
Two-tailed test:
One-tailed test:
10%
5%
5%
2.5%
Significance level
2%
1%
1%
0.5%
6.314 12.706 31.821 63.657
2.920
2.353
2.132
2.015
4.303
3.182
2.776
2.571
6.965
4.541
3.747
3.365
9.925
5.841
4.604
4.032
1.943
2.447
3.143
3.707
1.894
1.860
1.833
1.812
2.365
2.306
2.262
2.228
2.998
2.896
2.821
2.764
3.499
3.355
3.250
3.169
1.796
2.201
2.718
3.106
1.782
1.771
1.761
1.753
2.179
2.160
2.145
2.131
2.681
2.650
2.624
2.602
3.055
3.012
2.977
2.947
1.746
2.120
2.583
2.921
1.740
1.734
1.729
1.725
2.110
2.101
2.093
2.086
2.567
2.552
2.539
2.528
2.898
2.878
2.861
2.845
1.721
2.080
2.518
2.831
1.717
1.714
1.711
1.708
2.074
2.069
2.064
2.060
2.508
2.500
2.492
2.485
2.819
2.807
2.797
2.787
1.706
2.056
2.479
2.779
1.703
1.701
1.699
1.697
2.052
2.048
2.045
2.042
2.473
2.467
2.462
2.457
2.771
2.763
2.756
2.750
1.694
2.037
2.449
2.738
1.691
1.688
1.686
1.684
2.032
2.028
2.024
2.021
2.441
2.434
2.429
2.423
2.728
2.719
2.712
2.704
1.682
2.018
2.418
2.698
1.680
1.679
1.677
1.676
2.015
2.013
2.01 I
2.009
2.414
2.410
2.407
2.403
2.692
2.687
2.682
2.678
1.671
2.000
2.390
2.660
1.667
1.664
1.662
1.660
1.994
1.990
1.987
1.984
2.381
2.374
2.368
2.364
2.648
2.639
2.632
2.626
1.658
1.980
2.358
2.617
1.655
1.653
1.650
1.649
1.976
1.972
1.968
1.966
2.351
2.345
2.339
2.336
2.609
2.601
2.592
2.588
1.648
1.965
2.334
2.586
1.647
1.645
1.964
1.960
2.333
2.326
2.584
2.576
0.2%
0.1%
318.309
22.327
10.215
7.173
5.893
5.208
4.785
4.501
4.297
4.144
4.025
3.930
3.852
3.787
3.733
3.686
3.646
3.610
3.579
3.552
3.527
3.505
3.485
3.467
3.450
3.435
3.421
3.408
3.396
3.385
3.365
3.348
3.333
3.319
3.307
3.296
3.286
- 3.277
3.269
3.261
3.232
3.211
3.195
3.183
3.174
3.160
. ;.:3.145
. ·3_131
___},118
3.111
3.107
3.104
3.090
0.1%
0.05%
636.619
31.599
12.924
8.610
6.869
5.959
5.408
5.041
4.781
4.587
4.437
4.318
4.221
4.140
4.073
4.015
3.965
3.922
3.883
3.850
3.819
3.792
3.768
3.745
3.725
3.707
3.690
3.674
3.659
3.646
3.622
3.601
3.582
3.566
3.551
3.538
3.526
3.515
3.505
3.496
3.460
3.435
3.416
3.402
3.390
3.373
3.357
3.340
3.323
3.315
3.310
3.307
3.291
Bl Page

2.6 Page 16

▲back to top


2.7 Page 17

▲back to top


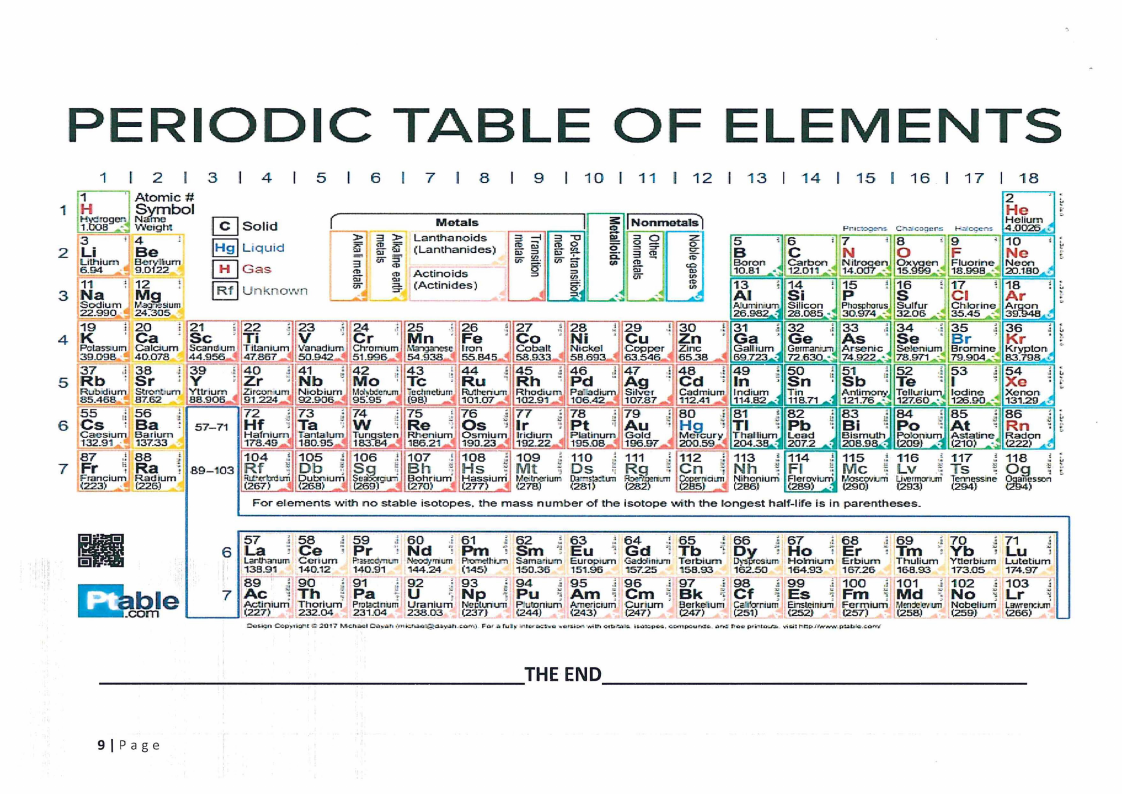
PERIODIC TABLE OF ELEMENTS
1
2
3
4
5
6
7
8
9
10
11
12
13
'14
15
16
17
18
1
1 IH
~1r.0o0g8e,, -
2 I3Li
Lilnium
6.94
3 IN11a
Sodium
22.990_.
Atomic#
Symbol
VN.a'4f!3!O1gh!
4Be . '
Ber•,~ium
9.0122 _
M12g l
,,.,.a~"l9Sium
24.305
= . . L£.j Sohd·
L1qu1d
C!:!JGas
I I Rf Unkno" .,n
"'I (
Metals
1
!. !.>: Lanlha~lds
<ii
(Lanthani;des)
3 u,-
<11 Actinoids
5i-
_(Actinides)
I
iii c,' ,i'
g "' ;:;:;; "'
g'
=?.'
S: !Nonmetals]
!l,, S3 2¥ if
r.a 5i-
co
-~
5B
' 6C
Pri=
' 7N
,, C,-.::,tc:,,gcr.::
f-1:.iC<;C.-..
2
He
,
t'
4H.0e0li2u6m ...t
J• SO
• 9F
• 1N0e
[
-·:! Boron
10.s1
carbon
Nitr son O'.lt en Fluorine- Neon
12.011 __ 14.oW __ 15.~-'9
18.998
20.1.eo.._
A13l
l 1S4i
! 1P5
1S 6
: 1C7l
A18r
!1
AI\\Jmlr.:urrn Silicon
Phosi:oorus Sulfur • Chlot·lne Arg<Jn
"
26.982~- 2.8.085 -:.. 30.974 .:< 3206 _-;: 35.45 ~· 39~~
4I
39.09B..!:
5I
2C0 a
calcium
40.078
38
Sr
,il 2S1c
,'T2i 2
'V23
.'iC2r4
..1 2M5n -,~,2F6e
l, 2C7o
Scand.um Titanium. Vanadium Ch:ornum Ma:-,;i=el Iron
44.956
47.867 -• 50.942-• 51.996-• 54.938:J 55.845:,J
Cobal~
58.933-,
Jt J ,j 39
~r ; Y.
40
:
.i 41
~b.
42
· Mo
·1;
43
J"c
,: 44
, ·~Ru
: 45
, Rh_
'N2i 8
J' 2C9u .'!Zn30
., Nick.el
Copper
Zinc
5~.693-1 63.546-~ 65.38
.: 46
.l 47
,t 48
Pd. " ~g ·~Cd.
.':G3a1
. 3G2e .'iA3s3
.., 3S4e ,.; 3B5r
.,, 3K6r
.t
Gallium Gcrrr..a.r..rn~ Ai:-scnic Scleniu"'.1 Bromine Krypton
69.723--• 72.630_-_. 74.922-·.,. 78.971 · 4 7'9.904 -• 83.798-1
,t 49
-; In,
: 50
•~n
.\\ 51
': SI?
:1:
52
Te
., 53
·: l .
54
Xe
-1 t
Rubidium &ror,trnn, Yttrium
Zrr<:orr:un~ N1obrum. M:Mx:'cr,.:m Judrnefr.Jtn Rl.llla?num Rhodium Pa':Jadnnn Srlver
Cadmrum Indium
Trn
AmilTIOITJ' Tellurium Iodine
Xenon
85.468.;,. 87.62
88.906
91.224 • 92.9'06-"' 95:95 -• (9B) -• 101.07 -"' 102.91
106.42-• 107.87 -• 112.41
114.82 · ,118.71 -· 121.76 • 127.60 •
131.29
55 J 56 JI
6 !Cs : Ba : 57-71
Caesium Bariurn
~j 132.91,.; .. 137.33
87 ···Jl'88
7 Fr l; Ra
8'9-103
72 -~ 73
Hf
Ta
J 74
·: W
t,::
75
Re
.! 76
'l Os
1 77
; Ir
78 ,; 79
Pt 7i Au
Hafniurn .. Tan1.a1ur:ii (Tung,Sle!J Rheniu"'! Osmiu"'!. 'Iridium , Platinurl'!, ·Gold
178.49-• 180.95-• 183.64-• U!6.21 -• 190.23-"' 192.22-• 195.0B-"' 196.97
104
Rf
10s .= 106
D!b Sg
q.!
107
Bh
.! 108
Hs
.i; 109
, Mt
J 110
;; Ds
.: 111
R,g
:: 80
, 81
82
" Hg ; Tl -; Pb
Mercury, Thallium Lea.d
-• 200.59-• 204.3R - 207.2
j 112
i'; Cn
,; 113
1 Nh
! 114
Fl
J 83 J ,84 j 85 k 86
Bi
Po ·: At
Rn
• Blsmull:i
-" 20B.9~-~
PolOnUITJ
(209} -"
As1aline
(210) _.
4
Radon
(222)
.. •
~,;-
J 115 -~ 116 .: 117
Mc !: Lv -~ Ts
118
r
Og '; t
lF,aricium Ra. d'ium
f(223) .....:!i..f.226)__
(R2l6t.7'o)('!'l,:..--d!unD(2uCt'.8"<) '•,1.-u.;"::1
Su~
(269..L..-.':
B(..2.oro.h.)._r..lum:
Hassiu"'!.
•".277) •
Meitnerium
•:.278)
03J:,,s:a.:t'U'llFb?i\\'mnil.rTI
<281)
(282)
@ D::.p~crft::hmI
NihCflium
(2E!6J•
Flero\\'iunj, rmsco,a.-m ti.-crrm.-,..ni Tet1ncSSine O<i:iii"cssoo
(289) _., •(290)
.f.293)
(294}
{2Sl4:)
For elements 1Ni:th no stable isotopes. the mass number of the isotope \\'llith the longest half-life is in parentheses.
II-
57
.l 58
l 59
.:i 60
,t 61
l 62
! 63
.1 64
.! 65
1 66
67
,, 68
.:l 69
.f 70
71
:
La i Ce -; Pr 'i Nd 'l Pm
Lanlhanum Cerium
F;nec<t,,n.".11 Neo:t/'11'-'Tll ~h;_rn
1.138.9,_' 1~~-12~, 140.~1 ' '1144.24 ' (145)
, Sm ·i Eu '1 Gd '1 Tb 1 Dy i Ho i Er i Tm 'i Yb ; Lu "i
Sama:h.i.-n Europum, Gad~inf.rn Terbium 0}'$~0S11m Hoh'tium Erbiurn
Thulium Ytterbiu,m Lutetium
,,150.36 '1151.96 ' 157.25 . 158.93 ' 162~~,
164.~ ' 167.26 , .!~-~, 173.05 ' 174.97
,:I ••I 89
.j 90
i;l 91
u 92
.: 93
:;{94
: 195 ,1196
97
98
: 99
.,, 100 ,1 101 ,e 102 : 103 .l
lb e lJJ I I l l I 1 ~I mI
Ac
ILlnlum
ltz2?L
: Th
)i:horlum
, 232.04
.1 ; Pa 1 U ; Np 11Pu
Am
Cm
Prolcdnilm [ura nlu m Jl.½JJ;to.numlP.ail:l:Jnium11A1Tte:icrJmI Curium
_, ~1-~
238.~
(23Z,}
: <2~4}
11 <24~
C247L..
Bk
Cf
Es
Fm 1Md
<~ Berk£:'ium 1[ca'.ib:rJum Emleinr.rn
C247> . (251)
:F!eZrmSiuZmL 1~~B::kLlio',un
No
Nobelium
@59}
Lr
',i
LlMTcrr.,.m"·
(266)
Ousi,,;:n ·Cei>.,'1V.l'U C :.?.017 M,cn.:ict C..11!'.:.n,'mlo::r~o~y~n.,:::.illn-,J For;. n.a1,· itth:,..._-:r...:. 1oe:1si~•Mu-, o.-t,~.;.~ 1,ox::1X-'$o. r..,.trtl)C4Jrfl!{. or..: no" p1a"1.1.o:.r~-.A~1 tt.np.1"fN'"'"""''·P:.:ib»..co.rw
---------------
THEEND ---------------
9IPage

2.8 Page 18

▲back to top