


 |
DEM602S- DEMOGRAPHY - JAN 2020 |
|
|
1 Page 1 |
▲back to top |
o
NAMIBIA UNIVERSITY
OF SCIENCE AND TECHNOLOGY
FACULTY OF HEALTH AND APPLIED SCIENCES
DEPARTMENT OF MATHEMATICS AND STATISTICS
QUALIFICATION: Bachelor of science in Applied Mathematics and Statistics
QUALIFICATION CODE: 07BAMS
LEVEL: 6
COURSE CODE: DEM602S
COURSE NAME: DEMOGRAPHY
SESSION: JANUARY 2020
DURATION: 3 HOURS
PAPER: THEORY
MARKS: 100
SECOND OPPORTUNITY / SUPPLEMENTARY EXAMINATION QUESTION PAPER
EXAMINER
Mr. A.J. ROUX
MODERATOR:
Mr J. J. Swartz
INSTRUCTIONS
1. Answer ALL the questions in the booklet provided.
2. Show clearly all the steps used in the calculations.
3. All written work must be done in blue or black ink and sketches must
be done in pencil.
PERMISSIBLE MATERIALS
1. Non-programmable calculator without a cover.
THIS QUESTION PAPER CONSISTS OF 4 PAGES (Including this front page)
|
|
2 Page 2 |
▲back to top |
QUESTION 1: Introduction to Demography [15]
1.1) State the balancing formula which is used to express population growth.
( identify all variables in the formula)
(5)
1.2) The demographic perspective influences the way people understand and
interpret questions involving populations. Briefly discuss any one of the
following commonly used (the Malthusian perspective, or the Marxist
perspective) demographic perspectives.
(10)
QUESTION 2 : Ferti& lNupititalyity [20]
2.1) Distinguish between the following:
2.1.1) Gross reproduction rate and net reproduction rate
(4)
2.1.2) The direct method and the indirect method for calculating the age-
standardised birth rate
(4)
2.1.3) General Marriage rate and the total marriage rate.
(4)
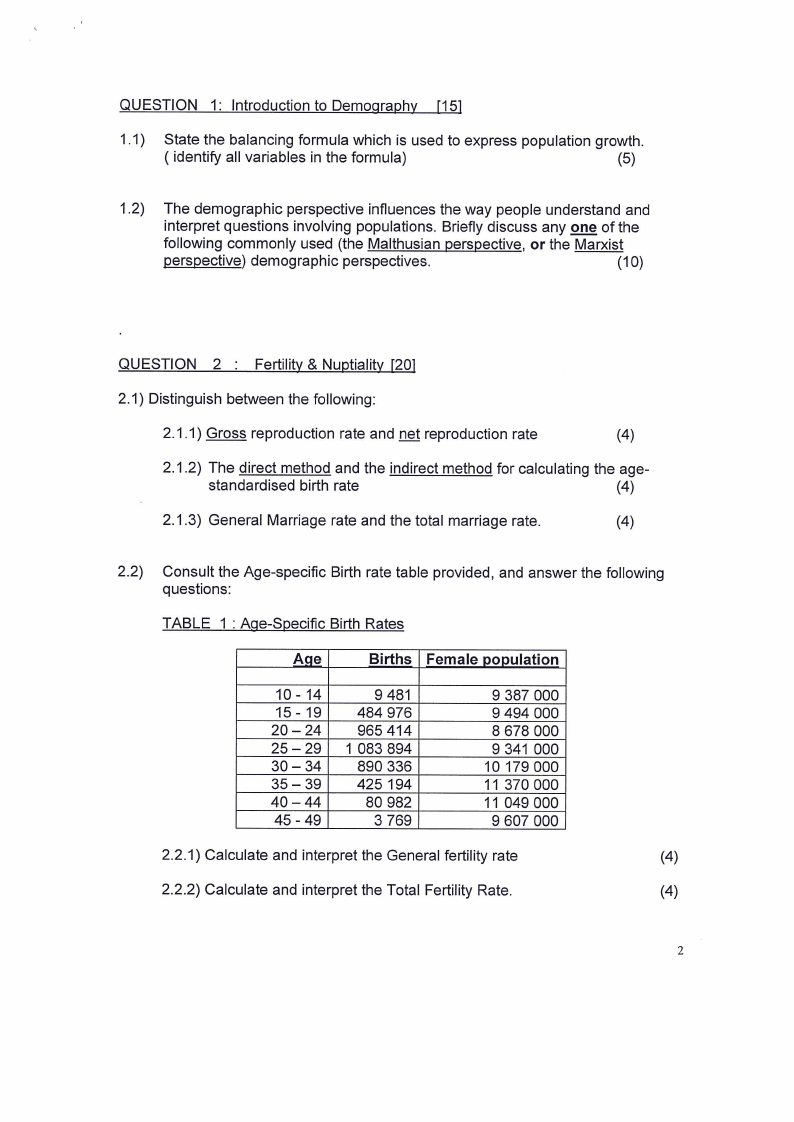
2.2) Consult the Age-specific Birth rate table provided, and answer the following
questions:
TABLE 1 : Age-Specific Birth Rates
Age
Births | Female population
10 - 14
15 - 19
20 —- 24
25-29]
30 — 34
35 — 39
40 — 44
45 - 49
9 481
484 976
965 414
1083 894
890 336
425 194
80 982
3 769
9 387 000
9 494 000
8 678 000
9 341 000
10 179 000
11 370 000
11 049 000
9 607 000
2.2.1) Calculate and interpret the General fertility rate
(4)
2.2.2) Calculate and interpret the Total Fertility Rate.
(4)
|
|
3 Page 3 |
▲back to top |
QUESTION _ 3
Mortality
[43]
3.1) Name and briefly discuss ( any five ) of the most commonly used indices for
measuring mortality
[3x5=15]
3.2) Distinguish between longevity and lifespan
(2)
3.3) Name and briefly describe two components or aspects to consider in
determining “the ability to resist death”
(8)
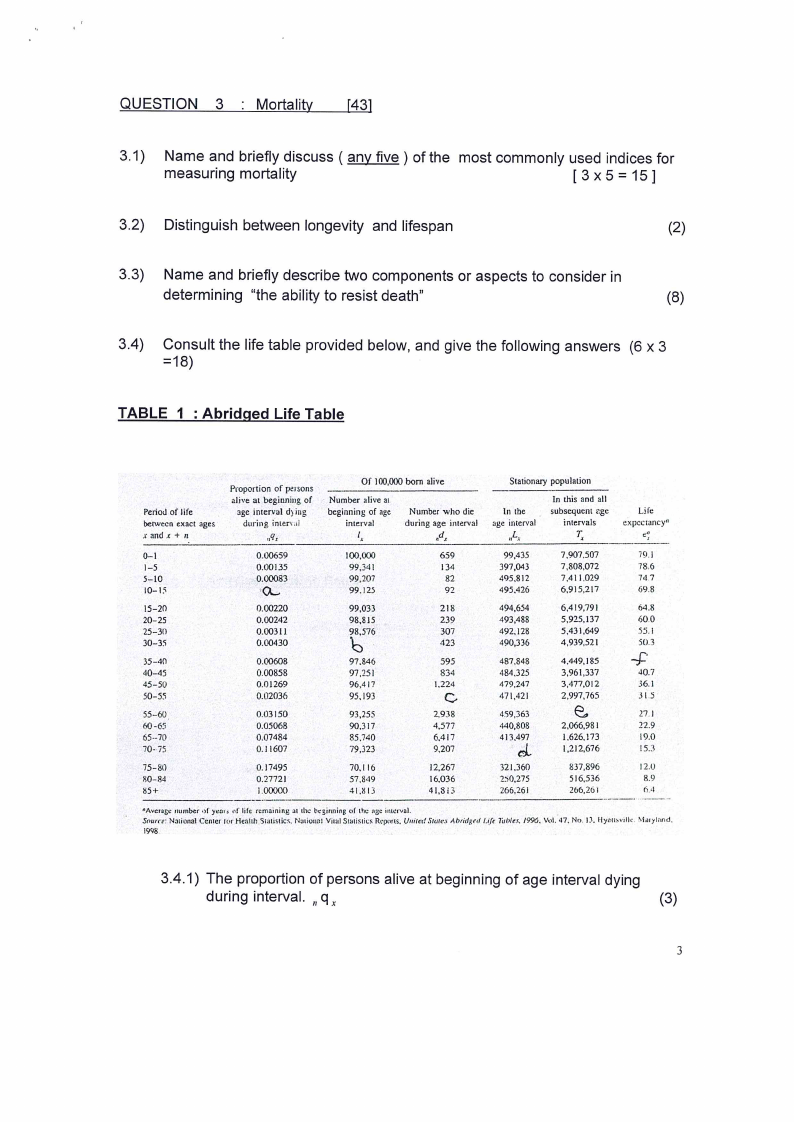
3.4) Consult the life table provided below, and give the following answers (6 x 3
=18)
TABLE 1 : Abridged Life Table
Period of life
betwecn exact ages
xandx +n
0-1
1-5
5-10
10-15
15-20
20-25
25-30
30-35
35-40
40-45
45-50
50-55
55--60
60-65
65--70
70-75
75-80
80-84
85+
Proportion of peisons
alive at beginning of |
age interval dying
during interval
Of 100,000 born alive
Number alive at
beginning of age
interval
Number who die
during age interval
Stationary population
In the
—_ age interval
In this and all
subsequent age
intervals
nds
0.00659
0.00135
0.00083
OQ.
f,
100,000
99,341
99,207
99.125
nd,
ney
f,
659
99,435
7,907,507
134
397,043
7,808,072
82
495,812
7,411,029
92
495,426
6,935,217
0.00220
0.00242
0.00311
0.00430
99,033
98,815
98,576
b
218
494,654
6,419,791
239
493,488
5,925,137
307
492,128
5,431,649
423
490,336
4,939,521
0.00608
0.00858
0.01269
0.02036
97.846
97,251
96,417
95,193
595
487,848
4,449,185
834
484,325
3,961,337
1,224
479,247
3,477,012
&
471,421
2,997,765
0.03150
0.05068
0.07484
0.11607
93,255
90,317
85,740
79,323
2,938
459,363
eS
4,577
440,808
2,066,981
6,417
413,497
1,626,173
9,207
a
1,212,676
0.17495
0.27721
1.00000
70,116
57,849
41813
12,267
16,036
41,33
321,360
250,275
266,261
837,896
516,536
266,261
Life
expectancy®
e
79.)
78.6
714.7
69.8
64.8
60.0
55.1
30.3
f
40.7
36.1
31.5
27.1
22.9
19.0
153
12.0
8.9
64
“Average number of years of life remaining al the beginning of the age interval.
Source: National Center for Health Statistics, Nationa! Vital Statistics Reports, United Statex Abridged Life Tables, 1996, Vol, 47, No. 13, Hyatisville. Maryland,
1998
3.4.1) The proportion of persons alive at beginning of age interval dying
during interval. ,q,
(3)
|
|
4 Page 4 |
▲back to top |
3.4.2) The number alive (out of 100 000 born alive) at beginning of age
interval, 7.
(3)
3.4.3) Number who die (out of 100 000 born alive) during age interval, ,d,
(3)
3.4.4) Stationary population in the age interval, ,L,
(3)
3.4.5) Stationary population in this and all subsequent age intervals, T. (3)
3.4.6) The life expectancy. ¢.
(3)
QUESTION 4 : Migration
[22]
4.1) Provide three sources of data on international and internal migration.
(3)
4.2) State and explain all the variables in an equation which can be used to calculate
a “Specific migration rate.
(4)
4.3) According to Petersen (1958, 1975) typology distinction was made between five
types of migration. Provide and describe these five types of migration, and give
relevant example to illustrate the concept.
(3 x 5 = 15)
XXXXXXXXXXXXXXXXKXXXXKXXXXXXXKXXXXXXXKXXKXXXKXXKXXXKXKXXKXKXKXXXXXXKKXKXKXXXXKKKXK