


 |
BSD721S - BIOSTATISTICS AND DEMOGRAPHY - 2ND OPP - JULY 2022 |
|
|
1 Page 1 |
▲back to top |

n Am I 8 I A Un IVE RSITV
OF SCIEnCE Ano TECHnOLOGY
FACULTY OF HEALTH, APPLIED SCIENCES AND NATURAL RESOURCES
DEPARTMENT OF HEALTH SCIENCES
QUALIFICATION: BACHELOR OF SCIENCEIN HEALTH INFORMATION SYSTEMSMANAGEMENT
QUALIFICATION CODE: 07BHIS
LEVEL: 7
COURSE: BIOSTATISTICSAND
DEMOGRAPHY
SESSION: JULY 2022
COURSE CODE: BSD721S
PAPER: THEORY
DURATION: 3 HOURS
MARKS: 100
SUPPLEMENTARY/SECOND OPPORTUNITY EXAMINATION QUESTION PAPER
EXAMINER
Dr Jacob Ong'ala
MODERATOR Prof Lillian Pazvakawambwa
INSTRUCTIONS
1. Answer ALL the questions.
2. Show clearly all steps in the calculations.
3. All written work must be done in blue or black ink.
PERMISSIBLE MATERIALS
Scientific Calculator
THIS QUESTION PAPER CONSISTS OF 4 PAGES (including this front page)
1
|
|
2 Page 2 |
▲back to top |
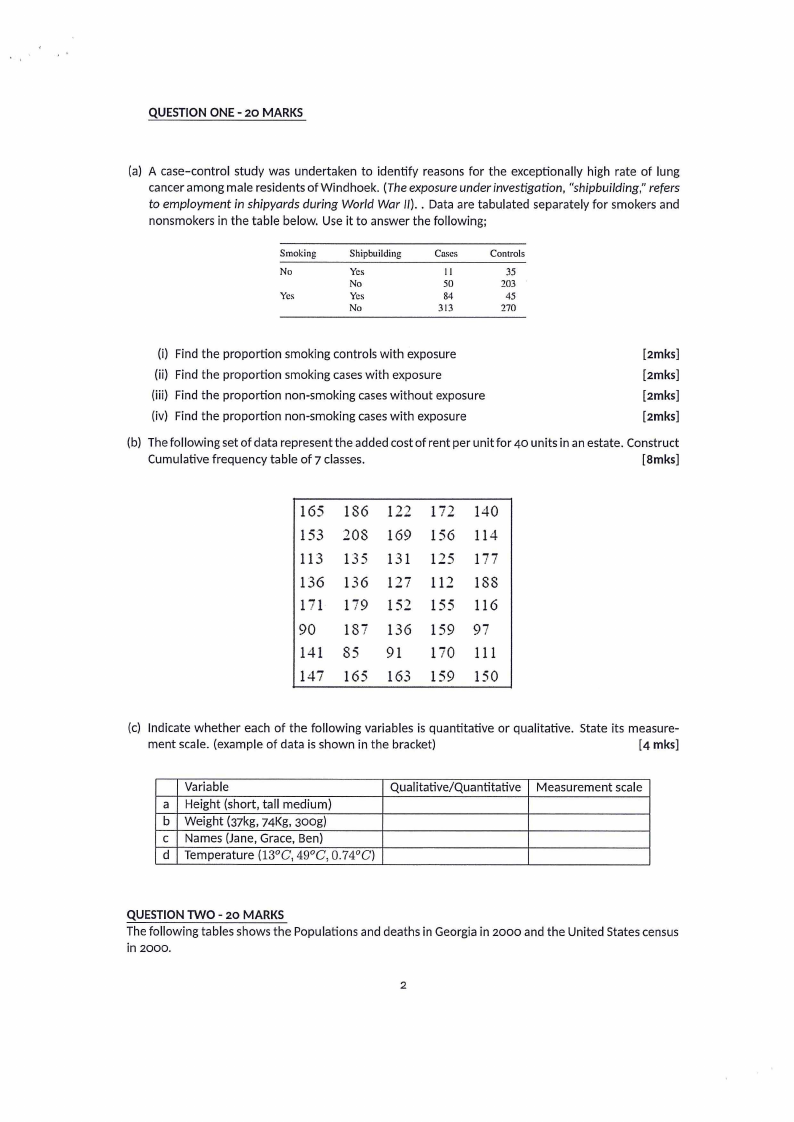
QUESTIONONE- 20 MARKS
(a) A case-control study was undertaken to identify reasons for the exceptionally high rate of lung
cancer among male residents of Windhoek. (The exposure under investigation, "shipbuilding," refers
to employment in shipyards during World War//) .. Data are tabulated separately for smokers and
nonsmokers in the table below. Use it to answer the following;
Smoking
No
Yes
Shipbuilding
Yes
No
Yes
No
Cases
II
50
84
313
Controls
35
203
45
270
(i) Find the proportion smoking controls with exposure
(ii) Find the proportion smoking caseswith exposure
(iii) Find the proportion non-smoking caseswithout exposure
(iv) Find the proportion non-smoking caseswith exposure
[2mks]
[2mks]
[2mks]
[2mks]
(b) The following set of data represent the added cost of rent per unit for 40 units in an estate. Construct
Cumulative frequency table of 7 classes.
[8mks]
165 186 122 1-,)_ 140
153 208 169 156 114
113 135 131 125 177
136 136 p_- , 112 188
171 179 152 155 116
90 187 136 159 97
141 85 91 170 111
147 165 163 159 150
(c) Indicate whether each of the following variables is quantitative or qualitative. State its measure-
ment scale. (example of data is shown in the bracket)
[4 mks]
Variable
a Height (short, tall medium)
b Weight (37kg, 74Kg, 300g)
C Names (Jane, Grace, Ben)
d Temperature (13°C, 49°C, 0.74°G)
Qualitative/Quantitative
Measurement scale
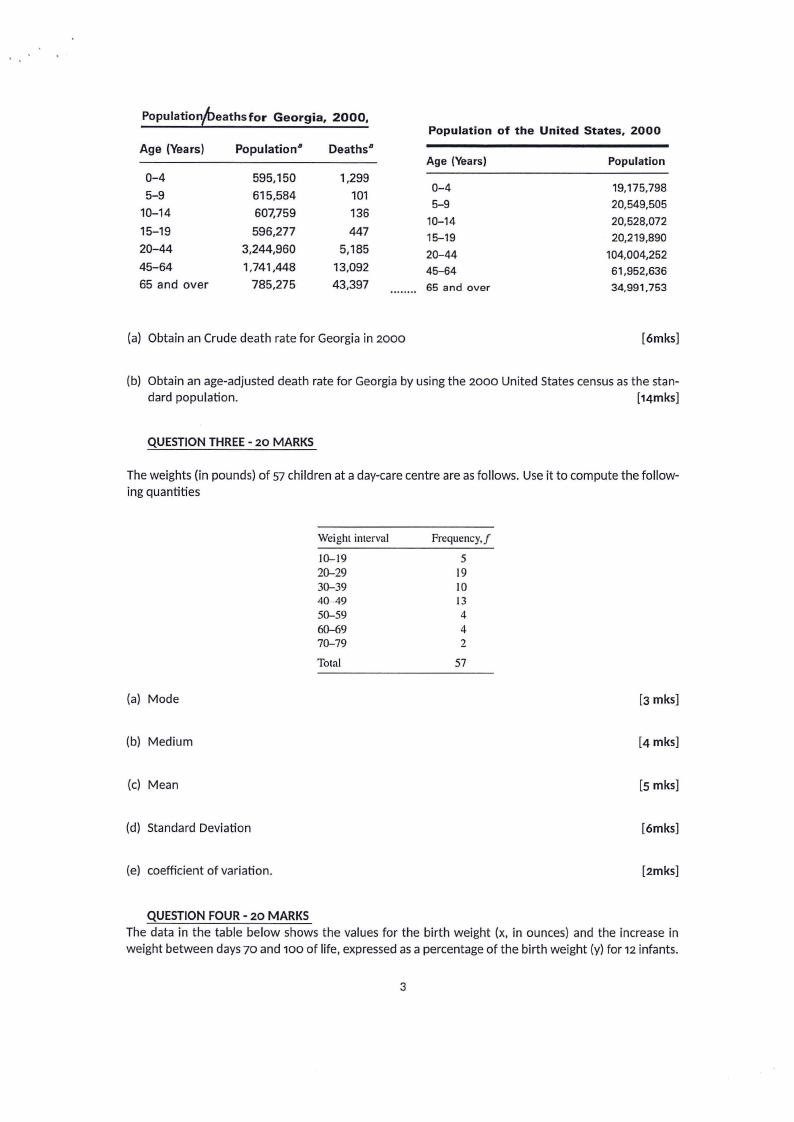
QUESTIONTWO- 20 MARKS
The following tables shows the Populations and deaths in Georgia in 2000 and the United States census
in 2000.
2
|
|
3 Page 3 |
▲back to top |
Populationfl)eathsfor Georgia, 2000,
Age (Years)
0-4
5-9
10-14
15-19
20-44
45-64
65 and over
Populations
595,150
615,584
607,759
596,277
3,244,960
1,741,448
785,275
Deathsa
1,299
101
136
447
5,185
13,092
43,397
Population of the United States, 2000
Age (Years)
0-4
5-9
10-14
15-19
20-44
45-64
65 and over
Population
19,175,798
20,549,505
20,528,072
20,219,890
104,004,252
61,952,636
34,991,753
(a) Obtain an Crude death rate for Georgia in 2000
[6mks]
(b) Obtain an age-adjusted death rate for Georgia by using the 2000 United States census as the stan-
dard population.
[14mks]
QUESTIONTHREE- 20 MARKS
The weights (in pounds) of 57 children at a day-care centre are as follows. Use it to compute the follow-
ing quantities
(a) Mode
(b) Medium
(cl Mean
(d) Standard Deviation
(e) coefficient of variation.
Weight interval
10-19
20-29
30-39
40--49
50-59
60-69
70-79
Total
Frequency,/
5
19
IO
13
4
4
2
57
(3 mks]
[s mks]
[6mks]
[2mks]
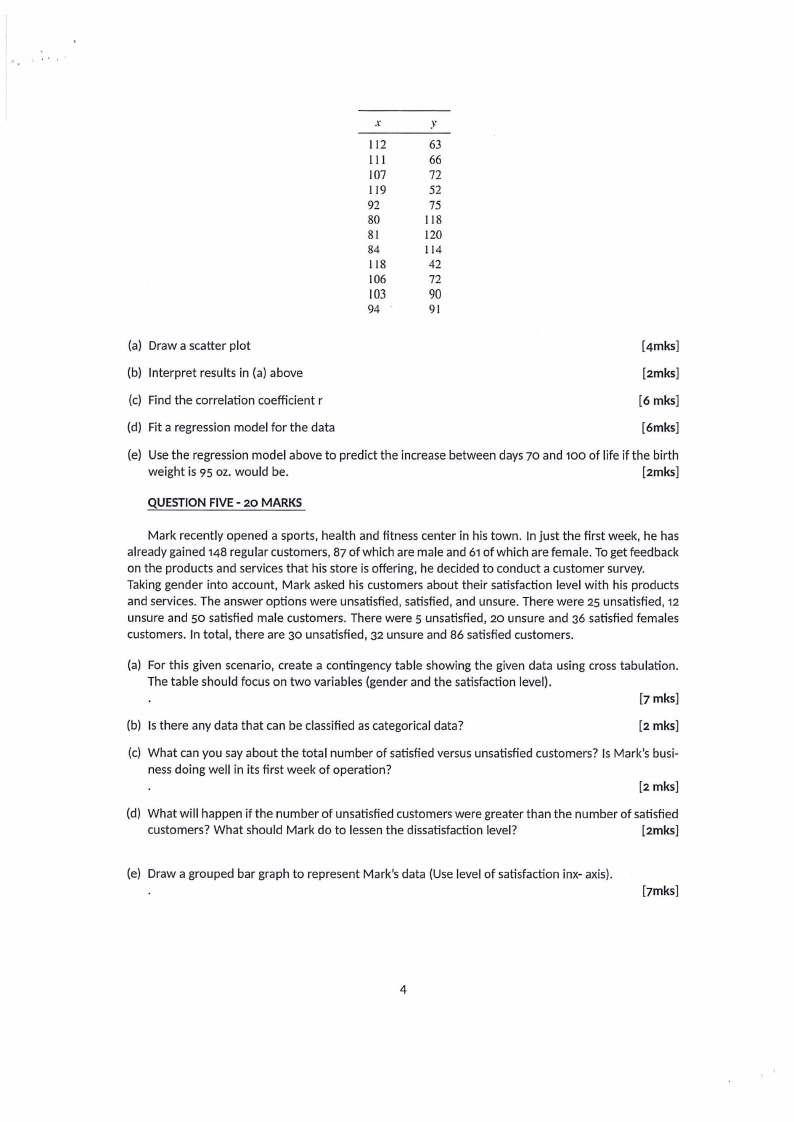
QUESTIONFOUR- 20 MARKS
The data in the table below shows the values for the birth weight (x, in ounces) and the increase in
weight between days 70 and 100 of life, expressed as a percentage of the birth weight (y) for 12 infants.
3
|
|
4 Page 4 |
▲back to top |
X
y
112
63
111
66
107
72
119
52
92
75
80
118
81
120
84
114
118
42
106
72
103
90
94
91
(a) Draw a scatter plot
(4mks]
(b) Interpret results in (a) above
[2mks]
(c) Find the correlation coefficient r
[6mks]
(d) Fit a regression model for the data
[6mks]
(e) Use the regression model above to predict the increase between days 70 and 100 of life if the birth
weight is 95 oz. would be.
[2mks]
QUESTIONFIVE- 20 MARKS
Mark recently opened a sports, health and fitness center in his town. In just the first week, he has
already gained 148 regular customers, 87 of which are male and 61of which are female. To get feedback
on the products and services that his store is offering, he decided to conduct a customer survey.
Taking gender into account, Mark asked his customers about their satisfaction level with his products
and services. The answer options were unsatisfied, satisfied, and unsure. There were 25 unsatisfied, 12
unsure and so satisfied male customers. There were s unsatisfied, 20 unsure and 36 satisfied females
customers. In total, there are 30 unsatisfied, 32 unsure and 86 satisfied customers.
(a) For this given scenario, create a contingency table showing the given data using cross tabulation.
The table should focus on two variables (gender and the satisfaction level).
(7mks]
(b) Is there any data that can be classified as categorical data?
[2 mks]
(c) What can you say about the total number of satisfied versus unsatisfied customers? Is Mark's busi-
ness doing well in its first week of operation?
[2 mks)
(d) What will happen if the number of unsatisfied customers were greater than the number of satisfied
customers? What should Mark do to lessen the dissatisfaction level?
[2mks]
(e) Draw a grouped bar graph to represent Mark's data (Use level of satisfaction inx- axis).
[?mks]
4