


 |
IMA612S- INTERMEDIATE MACROECONOMICS- 1ST OPP- NOV 2023 |
|
|
1 Page 1 |
▲back to top |
n Am I BI A u n IVER s ITY
OF SCIEnCE Ano TECHn OLOGY
FACULTY OF COMMERCE, HUMAN SCIENCESAND EDUCATION
DEPARTMENT OF ECONOMICS, ACCOUNTING AND FINANCE
QUALIFICATIONS:
BACHELOR OF ECONOMICS, BACHELOR OF ACCOUNTING GENERAL AND BACHELOR OF
ACCOUNTING {CHARTERED)
QUALIFICATION CODE:
O7BEC0, 07BOAC AND 07 BACC
LEVEL: 7
COURSE CODE: IMA612S
SESSION: NOVEMBER 2023
DURATION: 3 HOURS
COURSE NAME: INTERMEDIATE MACROECONIMICS
PAPER: THEORY
MARKS: 100
FIRST OPPORTUNITY EXAMINATION QUESTION PAPER
EXAMINER{S) Mr Eslon Ngeendepi
MODERATOR: Miss Ndeshi Shitenga
INSTRUCTIONS
1. Answer ALL the questions.
2. Write clearly and neatly.
3. Number the answers clearly.
PERMISSIBLE MATERIALS
1. Pens/pencils/erasers
2. Calculator
3. Ruler
THIS QUESTION PAPER CONSISTS OF 5 PAGES {Including this front page)
|
|
2 Page 2 |
▲back to top |
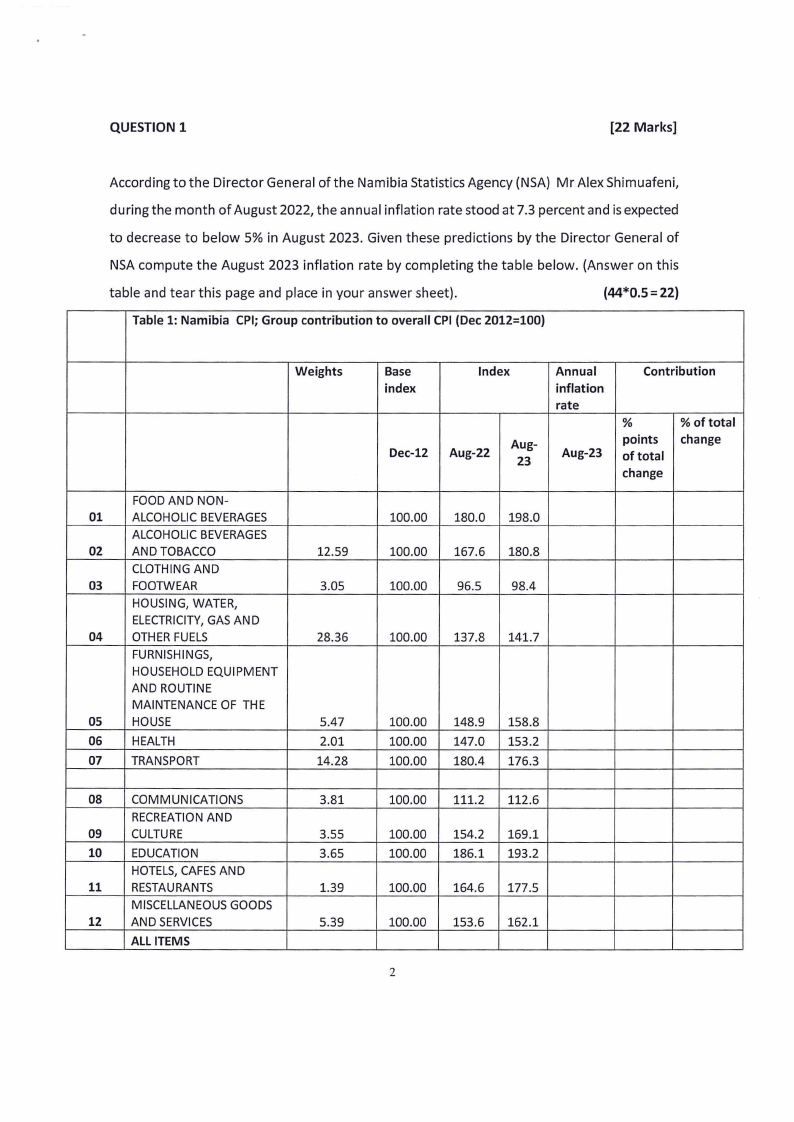
QUESTION 1
[22 Marks]
According to the Director General of the Namibia Statistics Agency {NSA) Mr Alex Shimuafeni,
during the month of August 2022, the annual inflation rate stood at 7.3 percent and is expected
to decrease to below 5% in August 2023. Given these predictions by the Director General of
NSA compute the August 2023 inflation rate by completing the table below. {Answer on this
table and tear this page and place in your answer sheet).
(44*0.5=22)
Table 1: Namibia CPI; Group contribution to overall CPI (Dec 2012=100)
Weights
FOODAND NON-
01 ALCOHOLICBEVERAGES
ALCOHOLICBEVERAGES
02
AND TOBACCO
CLOTHINGAND
03
FOOTWEAR
HOUSING,WATER,
ELECTRICITYG, ASAND
04
OTHERFUELS
FURNISHINGS,
HOUSEHOLDEQUIPMENT
AND ROUTINE
MAINTENANCEOF THE
05
HOUSE
06
HEALTH
07 TRANSPORT
08 COMMUNICATIONS
RECREATIONAND
09
CULTURE
10 EDUCATION
HOTELS,CAFESAND
11 RESTAURANTS
MISCELLANEOUSGOODS
12 AND SERVICES
ALL ITEMS
12.59
3.05
28.36
5.47
2.01
14.28
3.81
3.55
3.65
1.39
5.39
Base
index
Dec-12
Index
Annual
inflation
rate
Aug-22
Aug-
23
Aug-23
Contribution
%
points
of total
change
% of total
change
100.00
100.00
100.00
180.0 198.0
167.6 180.8
96.5 98.4
100.00 137.8 141.7
100.00
100.00
100.00
148.9
147.0
180.4
158.8
153.2
176.3
100.00
100.00
100.00
100.00
100.00
111.2 112.6
154.2
186.1
169.1
193.2
164.6 177.5
153.6 162.1
2
|
|
3 Page 3 |
▲back to top |
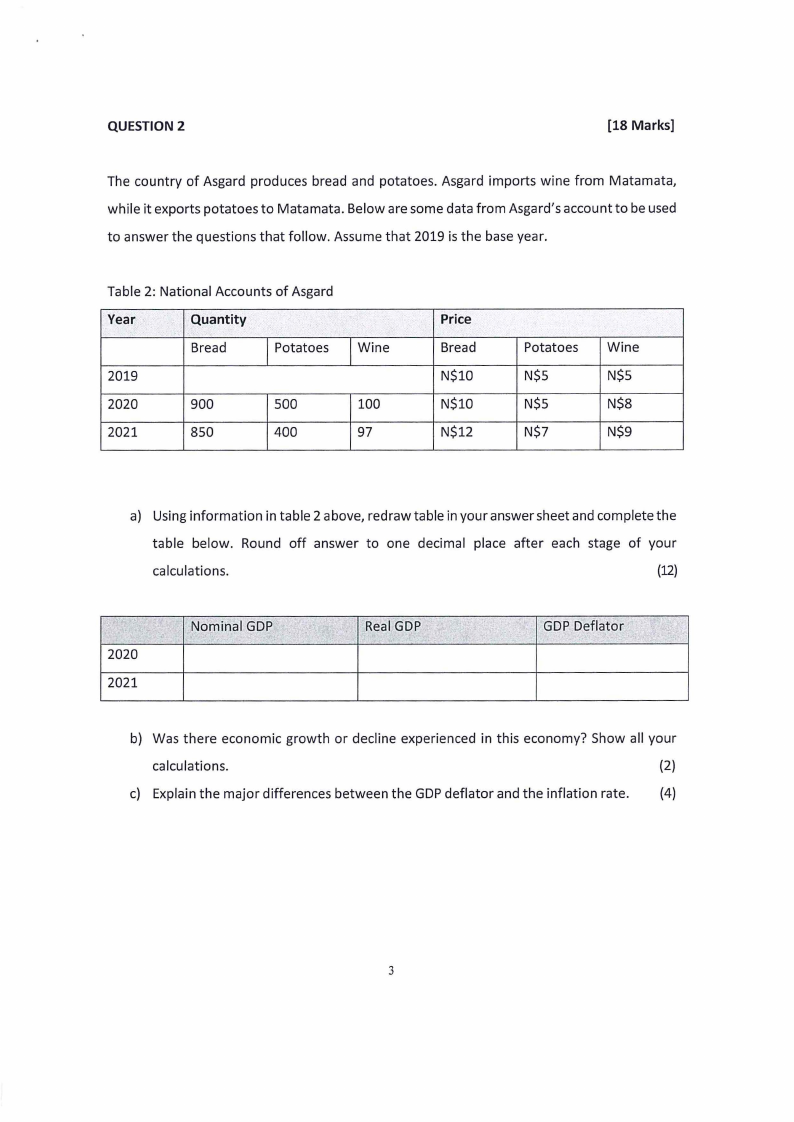
QUESTION 2
[18 Marks]
The country of Asgard produces bread and potatoes. Asgard imports wine from Matamata,
while it exports potatoes to Matamata. Below are some data from Asgard's account to be used
to answer the questions that follow. Assume that 2019 is the base year.
Table 2: National Accounts of Asgard
Year
Quantity
Bread
Potatoes
2019
2020
900
500
2021
850
400
Wine
100
97
Price
Bread
N$10
N$10
N$12
Potatoes
N$5
N$5
N$7
Wine
N$5
N$8
N$9
a) Using information in table 2 above, redraw table in your answer sheet and complete the
table below. Round off answer to one decimal place after each stage of your
calculations.
(12)
".
2020
2021
Nominal GDP
Real GDP
'
GDP Deflator
'
b) Was there economic growth or decline experienced in this economy? Show all your
calculations.
(2)
c) Explain the major differences between the GDPdeflator and the inflation rate. (4)
3
|
|
4 Page 4 |
▲back to top |
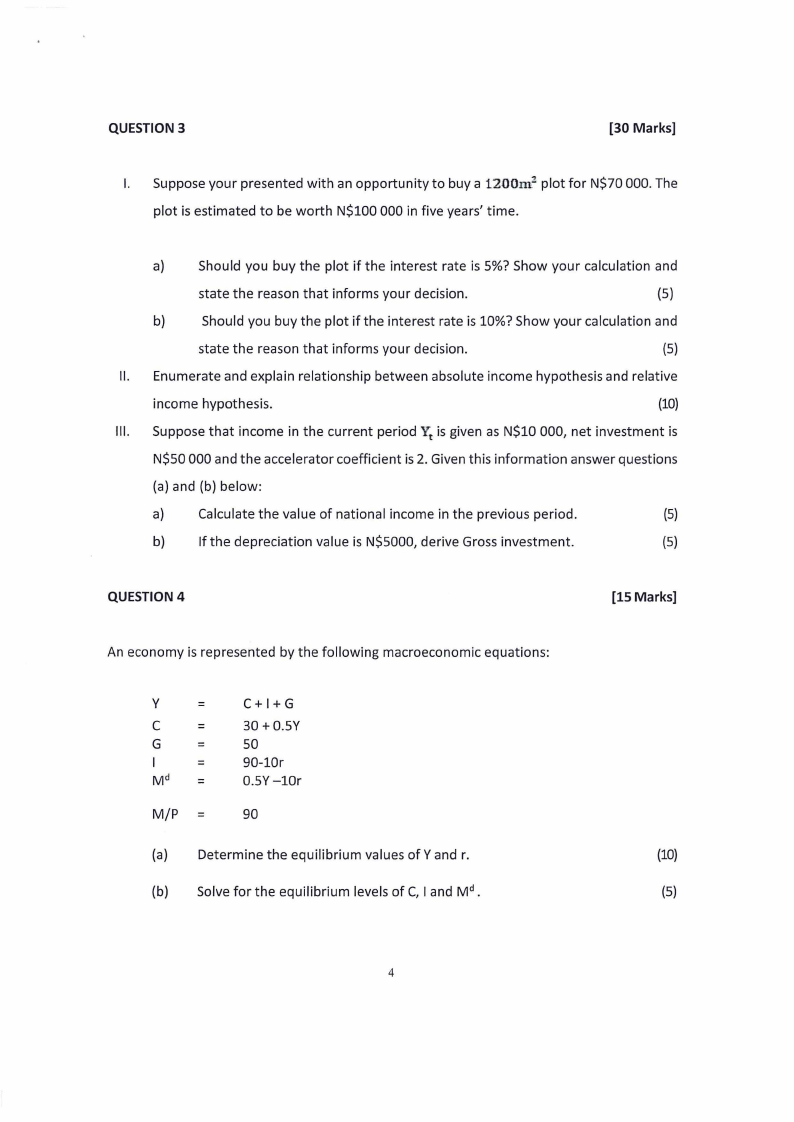
QUESTION 3
[30 Marks]
I. Suppose your presented with an opportunity to buy a 1200m 2 plot for N$70 000. The
plot is estimated to be worth N$100 000 in five years' time.
a)
Should you buy the plot if the interest rate is 5%? Show your calculation and
state the reason that informs your decision.
(5)
b)
Should you buy the plot if the interest rate is 10%? Show your calculation and
state the reason that informs your decision.
(5)
II. Enumerate and explain relationship between absolute income hypothesis and relative
income hypothesis.
(10)
Ill. Suppose that income in the current period Yt is given as N$10 000, net investment is
N$50 000 and the accelerator coefficient is 2. Given this information answer questions
(a) and (b) below:
a)
Calculate the value of national income in the previous period.
(5)
b)
If the depreciation value is N$5000, derive Gross investment.
(5)
QUESTION 4
[15 Marks]
An economy is represented by the following macroeconomic equations:
y=
C=
G=
=
Md =
M/P =
C+ I+ G
30 + 0.5V
50
90-l0r
0.5Y-10r
90
(a) Determine the equilibrium values of Y and r.
(10)
(b) Solve for the equilibrium levels of C, I and Md.
(5)
4
|
|
5 Page 5 |
▲back to top |
QUESTION 5
[15 Marks]
i. List the Rostow's five (5) stages of development.
(5)
ii. Outline two (2) benefits and costs associated with economic growth
(4)
iii. Discuss four (4) key limitations of the Harrod Domar Growth Model
(4)
iv. Suppose the capital-output ratio, v, is equal to 5 and the saving proportion, s, equal to
0.25. what is the warranted rate of growth?
(2)
TOTAL= 100 MARKS
5