


 |
DSA822S - DATA SCIENCE AND ANALYTICS - 1ST OPP - NOV 2023 |
|
|
1 Page 1 |
▲back to top |
nAmlBIA unlVERSITY
OF SCIEnCE Ano TECHnOLOGY
FACULTYOF COMPUTING AND INFORMATICS
DEPARTMENTOF INFORMATICS
QUALIFICATIONS:Bachelor of Informatics Honours
QUALIFICATIONCODE:08BIHW/
08BIFB
LEVEL: 8
COURSECODE: DSA822S
COURSE:Data Science and Analytics
DATE: November 2023
DURATION: 2 Hours
SESSION:1
MARKS: 70
FIRSTOPPORTUNITYEXAMINATION QUESTION PAPER
EXAMINERS:
Mr Eliazer Mbaeva
MODERATOR(S):
Mrs Emilia Shikeenga
THIS EXAMINATION PAPERCONSISTSOF 5 PAGES
(INCLUDING THIS FRONTPAGE)
INSTRUCTIONSFORTHE CANDIDATE
1. Answer ALL QUESTIONS.
2. Information should be brief and accurate.
3. Please ensure that your writing is legible, neat and presentable
1
|
|
2 Page 2 |
▲back to top |
SECTIONA
Question 1
Choose the correct answer from the following.
(1 x 5 = 5 marks)
1.1 What is the primary goal of data preprocessing in a data science project?
a. To collect raw data
b. To analyze data patterns
c. To clean and prepare data for analysis
d. To build machine learning models
1.2 Which programming language is widely used for data analysis and machine learning in
data science?
a. Java
b. Python
C. C++
d. Ruby
1.3 What is the term for a statistical technique used to predict a target variable based on other
variables in a dataset?
a. Data visualization
b. Data preprocessing
c. Regression
d. Clustering
1.4 Which of the following is NOT a commonly used machine learning algorithm for
classification tasks?
a. Decision Trees
b. Linear Regression
c. Support Vector Machines
d. Random Forest
1.5 What is the term for a type of unsupervised learning that aims to find patterns or clusters
in data?
a. Classification
b. Regression
c. Clustering
d. Reinforcement learning
2
|
|
3 Page 3 |
▲back to top |

Question 2
2.1 Define the following concepts:
a. Dataset
b. Data point
c. Attribute
d. Class label
e. Identifiers
(5 marks)
2.2 The process of generating meaningful association rules can be broken down into three
basic tasks. State and describe them.
(5 marks)
2.3 Given the following itemset table, determine the relative frequency of items that are likely
to be purchased together by calculating support and confidence of the transactions. Show
your work.
(10 marks)
.......,,
TID Items :.n
n
lt•
n • .•~,
, ,.
1 Tea, Cake, Cold Drink
2 Tea, Coffee, Cold Drink
3 Eggs,Tea, Cold Drink
4 Cake, Milk, Eggs
5 Cake, Coffee, Cold Drink, Milk, Eggs
3
|
|
4 Page 4 |
▲back to top |
SECTION B
Question 1
1.1 A statistical model is described by the following equation and is used to predict
numerical values:
y =a+ bx
Name the above model and brieflv describe the meaning of each variable in the
above equation.
{5 marks)
1.2 Data visualisation is a powerful approach for presenting complex analytics results to
the audience. Consider five basic types of charts such as pie chart, bar chart, line chart,
histogram, and scatterplot.
Select the most suitable type of chart for visualising each of the following types of data:
{3 marks)
a. Correlation
b. Time series
c. Components {i.e. showing parts of whole)
1.3 Label each data below according to its structure type (structured, semi-structured,
quasi-structured, or unstructured).
{5 marks)
a. Web clicks stream.
b. Relational database files
c. Textual documents
d. XML files
e. JSONfiles
1.4 List the six {6) phases in the Data Mining Processin a chronological order {i.e. from the
initial phase to the final phase).
{3 marks)
1.5 There are various key algorithm for classification. Identify any three {3) of these roles
and briefly describe their main contributions to a data science project.
{6 marks)
1.6 For each of the following business problems, decide whether they should be solved
using a supervised model or an unsupervised model.
a. Predicting which product to cross-sell to an individual customer based on
historical sales data.
b. Identifying different segments of customers according to similarity of their
demographics, purchasing patterns, etc.
c. Discovering product items that are normally bought together with other items
based on supermarket transaction data.
{3 marks)
4
|
|
5 Page 5 |
▲back to top |
SECTIONC
This section has 2 questions.
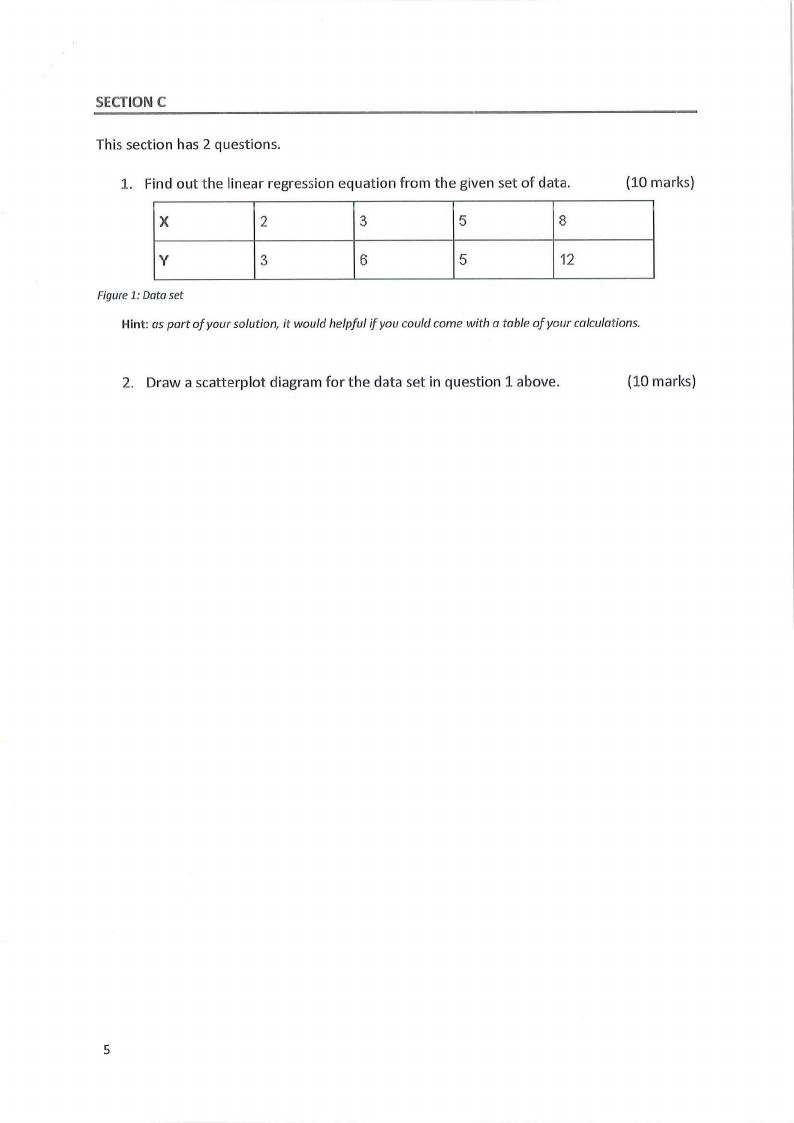
1. Find out the linear regression equation from the given set of data.
{10 marks)
I:
Figure1: Dataset
Hint: as part of yoursolution,it wouldhelpful if you couldcome with a table of your calculations.
2. Draw a scatterplot diagram for the data set in question 1 above.
(10 marks)
5