ASP610S-611S - APPLED STATISTICS AND PROBABILITY FOR IT - 1ST OPP - JUNE 2023


ASP610S-611S - APPLED STATISTICS AND PROBABILITY FOR IT - 1ST OPP - JUNE 2023


1 Page 1

▲back to top


nAmlBIA unlVERSITY
OF SCIEnCE Ano TECHn OLOGY
FACULTYOF HEALTH,NATURALRESOURCESAND APPLIEDSCIENCES
SCHOOLOF NATURALAND APPLIEDSCIENCES
DEPARTMENTOF MATHEMATICS,STATISTICSAND ACTUARIALSCIENCE
QUALIFICATION:BACHELOROF COMPUTERSCIENCE
QUALIFICATIONCODE: 07BACS,
07BCMS, 07BCCS,07BCCY
LEVEL: 6
COURSECODE: ASP610/ASP611S
COURSENAME: APPLIED STATISTICS& PROBABILITY
FOR IT
SESSION:JUNE 2023
DURATION: 3 HOURS
PAPER:THEORY
MARKS: 90
FIRST OPPORTUNITY EXAMINATION QUESTION PAPER
EXAMINER($) MR. ROUX, AJ
MODERATOR: MR. E MWAHI
INSTRUCTIONS
1. Answer ALL the questions.
2. Write clearly and neatly.
3. Number the answers clearly.
PERMISSIBLE MATERIALS
1. NON-PROGRAMABLE SCIENTIFICCALCULATOR
ATTACHMENTS
1. Statistical Tables ( Z-table )
2. 1 x A4 Graph Paper (to be supplied by Examinations Department)
3. Formulae Sheets
THIS QUESTION PAPERCONSISTSOF 5 PAGES(Including this front page)

2 Page 2

▲back to top


QUESTION 1 [ 20]
1.1 Indicate whether each ofthe following variables is quantitative or qualitative, and
identify the appropriate scale of measurement:
1.1.1) age of a child during an immunization
(2)
1.1.2) gender of an applicant attending an interview
(2)
1.1.3) the rank in which athletes obtained prices
(2)
1.1.4) the make of the cellphone which the child lost
(2)
1.1.5) percentage of students who passed the test
(2)
1.2) For each of the following random variables, indicate whether the data type is
discrete or continuous
1.2.1) The weight of a bag of potatoes
(1)
1.2.2) The number of cars damaged in the accident
(1)
1.2.3) The distance a cyclist completed
(1)
1.2.4) The number of children with disabilities
(1)
1.2.5) The height of a ten-year old girl
(1)
1.3) [For each of these questions ( 1.3.1-1.3.5), Only provide the letter indicating your
correct answer]
1.3.1 Which of the following measures of central tendency can reliably be used when
dataset has outliers?
a) Mean
b) Median c) Mode
d) All the above
(1)
1.3.2) A sample is
a) An experiment in the population
b) A subset of the population
c) A variable in the population
d) An outcome of the population
(1)
1.3.3) A parameter refers to
a) Calculation made from the population b) A measurement that is made from the
population c) A value observed in the experiment
d) All of the above
(1)
1.3.4) Weight is a ____
variable
a) Continuous
b) Discrete
c) Ordinal
d) Interval
(1)
1.3.5) Researchers do sampling because of all of the following reasons except
a) Reduce cost
b) Can be done in a shorter time frame
d) Easyto manage due to manageable logistics requirements
c) Sampling is interesting
(1)
2

3 Page 3

▲back to top


r,
QUESTION 2 [30]
2.1) The Ministry of Education summarized the mathematics grades of ten thousand Grade
12 learners. The result was to categorize into the following categories A, 8, C, D and E
respectively. The following table shows data on mathematics results for a sample of 50
Grade 12 learners.
A
C
E
B
D
C
D
B
D
C
D
8
D
E
C
A
D
C
D
E
D
C
A
B
D
C
B
E
C
D
8
C
D
C
D
C
E
A
D
C
C
8
D
D
8
D
C
E
8
A
2.1.1} Construct the frequency distribution for the set of qualitative data in the table. (8)
2.1.2} Construct the relative frequency distribution for the data set.
(2)
2.1.3} Construct the bar chart for the absolute frequency distribution for the data set. (5)
2.2) The Namibian Cycling Federation (NCF} analyzed the exercise time (in hours) spent
by a sample of 530 cyclists in preparation for the popular Desert Dash.
Exercise Time
(hours)
3- < 7
7- < 11
11- < 15
15 - < 19
19 - < 23
Number of cyclists
104
138
121
95
72
Use the data provided to calculate the:
2.2.1} mean,
(5)
2.2.2} median,
(5)
2.2.3) and modal exercise time
(5)
3

4 Page 4

▲back to top


QUESTION 3 [15]
The data below shows the price (in millions) for a standard size plot in an upmarket residential
suburb of Windhoek.
2012 2013 2014 2015 2016 2017 2018 2019 2020 2021
3.0 4.2 4.8 3.7 3.4 4.3 5.6 4.4 3.8 4.1
3.1) Determine the least squares trend line equation, using the sequential coding method
with the first period coded as 1.
(9)
3.2) Use the trend line equation obtained in Question 3.1 to estimate the price for the same
plot in 2010 and 2023.
(6)
QUESTION 4 [12]
A small scale manufacturing company operates a project that yields a cash flow having a
normal distribution with a daily average of N$500 and a standard deviation of N$60.
4.1) Calculate and interpret the probability that the cash flow on a given day will be N$560
and more.
(4)
4.2) Calculate and interpret the probability that the cash flow on a given day will be N$420
and less.
(4)
4.3) Calculate the probability that the cash flow on a given day will lie between N$460 and
540 (inclusive).
(4)
QUESTION 5 [ 13 ]
In a random sample of two hundred students, we found that one hundred and thirty eight
of them have their own personal computers .
5.1) What part of this sample have their own personal computers
a) 0.96
b) 0.69
c) 1.38 d) none of the provided
(1)
5.2) When constructing a confidence interval estimate for the single unknown population
proportion { n} of the student population who have their own personal computers:-
4

5 Page 5

▲back to top


5.2.1) What critical value will be used?
a) t
b) z
c) x
d) none of the provided
(1)
5.2.2) Compute the Standard Error of estimate
a) 0.2139 b) 1.0695
c) 0.0327 d) none of the provided
(3)
5.3) If you construct a 90 % degree of confidence interval estimate for the population
proportion of successes.
5.3.1) What critical value will be used?
a) 1.645
b) 1.96
c) 2.575 d) none of the provided
(2)
5.3.2) What will be the lower limit (LL)for this confidence interval estimate?
a) 0.05379 b) 0.63620 c) 0.69
d) none of the provided
(3)
5.3.3) What will be the upper limit (UL)for this confidence interval estimate?
a) 0.69
b) 0.05379 c) 0.7438 d) none of the provided
(3)
xxxxxxxxxxxxxxxxxxxxxxxxxxxxxxxxxxxxxxxxxxxxxxxxxxxxxxxxxxxxxxxxxx
5

6 Page 6

▲back to top


I'
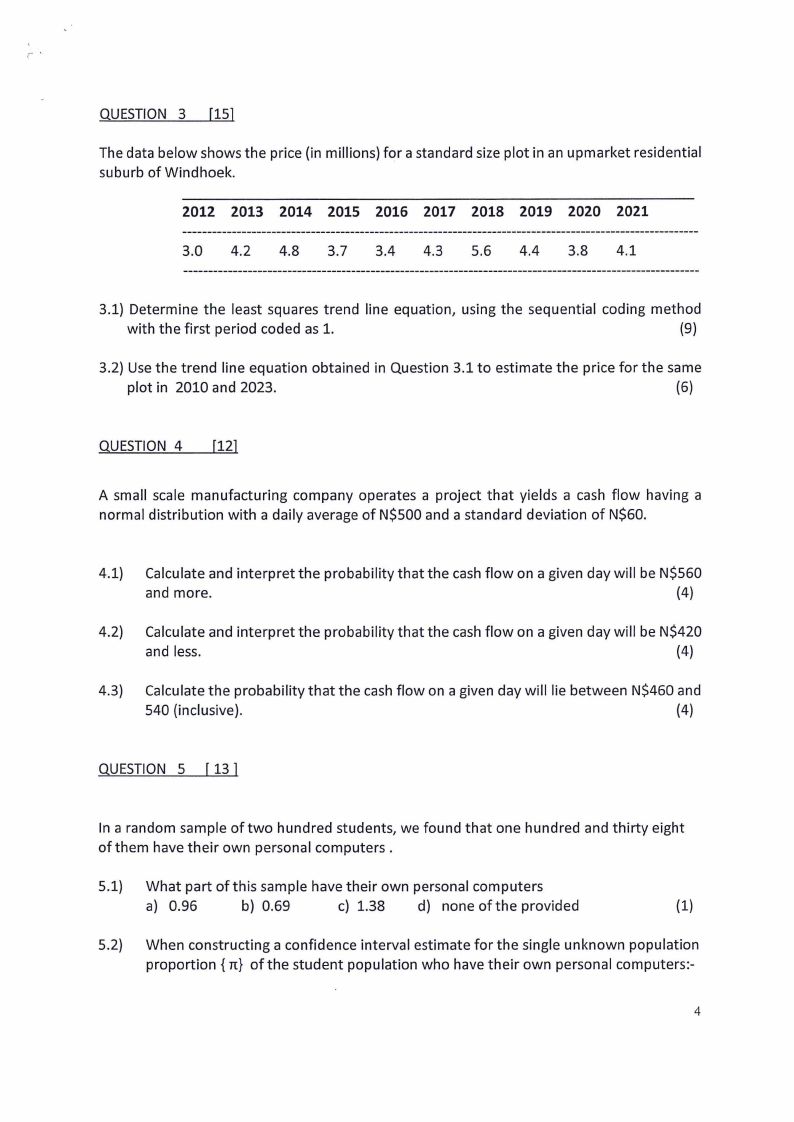
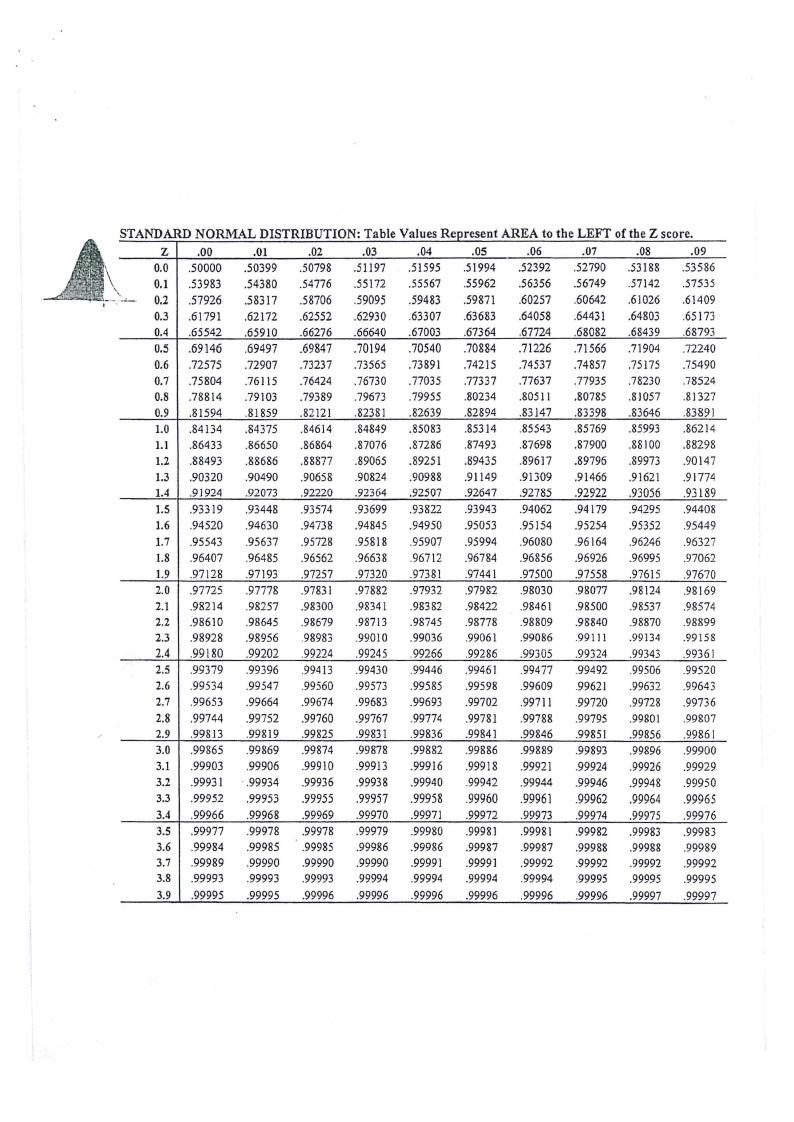
~\\ STANDARD NORMAL DISTRIBUTION: Table V alues RepresentA RECA tot he LEFT of the Z score.
z
.00
.01
.02
.03
.04
.OS
.06
.07
.08
.09
-3.9 ,00005 .00005 .00004 .00004 .00004 .00004 .00004 .00004 .00003 ,00003
~J./
'
I,-··.-~--
-3.8
-3.7
.00007
.0001 l
.00007
.00010
.00007
,00010
.00006
.00010
.00006
.00009
.00006
.00009
.00006
,00008
.00005
.00008
,00005
,00008
.00005
.00008
-3.6 .00016 .00015 .00015 .00014 .00014 .00013 .00013 .00012 .00012 ,00011
-3.5 .00023 .00022 .00022 .00021 .00020 .00019 .00019 .00018 .00017 .00017
-3.4 .00034 .00032 .00031 .00030 .00029 .00028 .00027 .00026 .00025 ,00024
-3.3 .00048 .00047 .00045 .00043 .00042 .00040 .00039 .00038 .00036 ,00035
-3.2 .00069 .00066 .00064 .00062 ,00060 .00058 .00056 .00054 .00052 .00050
-3.1 .00097 .00094 ,00090 .00087 .00084 .00082 .00079 .00076 .00074 .00071
-3.0 .00135 .00131 .00126 ,00122 .00118 .00114 .00111 ,00107 .00104 ,00100
-2.9 ,00187 .00181 .00175 .00169 ,00164 .00159 .00154 .00149 .00144 .00139
-2.8 .00256 .00248 .00240 .00233 .00226 .00219 .00212 .00205 .00199 ,00193
-2.7 ,00347 .00336 .00326 .00317 .00307 .00298 .00289 .00280 .00272 ,00264
-2.6 .00466 .00453 .00440 .00427 .00415 .00402 .00391 .00379 .00368 .00357
-2.5 .00621 ,00604 .00587 .00570 .00554 .00539 .00523 .00508 .00494 ,00480
-2.4 .00820 ,00798 .00776 .00755 .00734 .00714 .00695 .00676 .00657 .00639
-2.3 ,01072 .01044 .01017 .00990 .00964 .00939 .00914 .00889 .00866 ,00842
-2.2 .01390 .01355 .01321 .01287 .01255 .01222 .OJ191 .01160 .Ol 130 .01101
-2.) .01786 ,01743 .01700 .01659 .01618 .01578 .01539 .01500 .01463 .01426
-2.0 .02275 .02222 .02169 .02118 .02068 .02018 .01970 .01923 .01876 ,01831
-1.9 .02872 .02807 ,02743 .02680 ,02619 .02559 .02500 .02442 .02385 .02330
-1.8 ,03593 .03515 .03438 .03362 .03288 .03216 .03144 .03074 .03005 .02938
-1.7 .04457 ,04363 .04272 .04182 .04093 .04006 .03920 .03836 .03754 .03673
-1.6 .05480 ,05370 .05262 .05155 .05050 .04947 .04846 .04746 .04648 .04551
-1.S .06681 .06552 .06426 .06301 .06178 .06057 .05938 .05821 .05705 .05592
-1.4 .08076 .07927 .07780 .07636 .07493 .07353 .07215 .07078 .06944 .06811
-1.3 .09680 .09510 .09342 .09176 .09012 .08851 .08691 .08534 .08379 .08226
-1.2 .11507 .11314 .11123 .10935 .10749 .10565 .10383 .10204 .10027 .09853
-1.1 .13567 .13350 .13136 .12924 .12714 .12507 .12302 .12100 .11900 .11702
-1.0 .15866 .15625 .15386 .15151 .14917 .14686 .14457 .14231 .14007 .13786
-0.9 .18406 .18141 .17879 .17619 .17361 .17106 .16853 .16602 .16354 .16109
-0.8 .21186 .20897 .20611 .20327 .20045 .19766 .19489 .19215 .18943 .18673
-0.7 .24196 .23885 .23576 .23270 .22965 .22663 .22363 .22065 .21770 .21476
-0.6 .27425
-0.S .30854
.27093
.30503
.26763
.30153
.26435
.29806
.26109
.29460
.25785
.29116
.25463
.28774
.25143
.28434
.24825
.28096'
.24510
.27760
-0.4 .34458 .34090 .33724 .33360 .32997 .32636 .32276 .31918 .31561 .31207
-0.3 .38209 .37828 .37448 .37070 .36693 .36317 .35942 .35569 .35197 .34827
-0.2 .42074
-0.] .46017
-0.0 .50000
.41683
.45620
.49601
.41294
.45224
.49202
.40905
.44828
.48803
.40517
.44433
.48405
.40129
.44038
.48006
.39743
.43644
.47608
.39358
.43251
.47210
.38974
.42858
.46812
.38591
.42465
.46414
R·I·T
v-.rww.rit.edu/asc

7 Page 7

▲back to top


STANDARD NORMAL DISTRIBUTION : Table VaIues Represen tAREA tot he LEFT of the Z score.
z .oo .01
.02
.03
.04
.OS
.06
.07
.08
.09
0.0 .50000 .50399 .50798 .51197 .51595 .51994 .52392 .52790 .53188 .53586
0.1 .53983 .54380 .54776 .55172 .55567 .55962 .56356 .56749 .57142 .57535
-·-· 0.2 .57926 .58317 .58706 .59095 .59483 .59871 .60257 .60642 .61026 .61409
0.3 .61791 .62172 .62552 .62930 .63307 .63683 .64058 .64431 .64803 .65173
0.4 .65542 .65910 .66276 .66640 .67003 .67364 .67724 .68082 .68439 .68793
0.5 .69146 .69497 .69847 .70194 .70540 .70884 .71226 .71566 .71904 .72240
0.6 .72575 .72907 .73237 .73565 .73891 .74215 .74537 .74857 .75175 .75490
0.7 .75804 .761 IS .76424 .76730 .77035 .77337 .77637 .77935 .78230 .78524
0.8 .78814 .79103 .79389 .79673 .79955 .80234 .80511 .80785 .81057 .81327
0.9 .81594 .81859 .82121 .82381 .82639 .82894 .83147 .83398 .83646 .83891
1.0 .84134 .84375 .84614 .84849 .85083 .85314 .85543 .85769 .85993 .86214
1.1 .86433 .86650 .86864 .87076 .87286 .87493 .87698 .87900 .88100 .88298
1.2 .88493 .88686 .88877 .89065 .89251 .89435 .89617 .89796 .89973 .90147
1.3 .90320 .90490 .90658 .90824 .90988 .91149 .91309 .91466 .91621 .91774
1.4 .91924 .92073 .92220 .92364 .92507 .92647 .92785 .92922 .93056 .93189
1.5 .93319 .93448 .93574 .93699 .93822 .93943 .94062 .94179 .94295 .94408
1.6 .94520 .94630 .94738 .94845 .94950 .95053 .95154 .95254 .95352 .95449
1.7 .95543 .95637 .95728 .95818 .95907 .95994 .96080 .96164 .96246 .96327
1.8 .96407 .96485 .96562 .96638 .96712 .96784 .96856 .96926 .96995 .97062
1.9 .97128 .97193 .97257 .97320 .97381 .97441 .97500 .97558 .97615 .97670
2.0 .97725 .97778 .97831 .97882 .97932 .97982 .98030 .98077 .98124 .98169
2.1 .98214 .98257 .98300 .98341 .98382 .98422 .98461 .98500 .98537 .98574
2.2 :98610 .98645 .98679 .98713 .98745 .98778 .98809 .98840 .98870 .98899
2.3 .98928 .98956 .98983 .99010 .99036 .99061 .99086 .99111 .99134 .99158
2.4 .99180 .99202 .99224 .99245 .99266 .99286 .99305 .99324 .99343 .99361
2.5 .99379 .99396 .99413 .99430 .99446 .99461 .99477 .99492 .99506 .99520
2.6 .99534 .99547 .99560 .99573 .99585 .99598 .99609 .99621 .99632 .99643
2.7 .99653 .99664 .99674 .99683 .99693 .99702 .99711 .99720 .99728 .99736
2.8 .99744 .99752 .99760 .99767 .99774 .99781 .99788 .99795 .99801 .99807
2.9 .99813 .99819 .99825 .99831 .99836 .99841 .99846 .99851 .99856 .99861
3.0 .99865 .99869 .99874 .99878 .99882 .99886 .99889 .99893 .99896 .99900
3.1 .99903 .99906 .99910 .99913 .99916 .99918 .99921 .99924 .99926 .99929
3.2 .99931 · .99934 .99936 .99938 .99940 .99942 .99944 .99946 .99948 .99950
3.3 .99952 .99953 .99955 .99957 .99958 .99960 .99961 .99962 .99964 .99965
3.4 .99966 .99968 .99969 .99970 .99971 .99972 .99973 .99974 .99975 .99976
3.5 .99977 .99978 .99978 .99979 .99980 .99981 .99981 .99982 .99983 .99983
3.6 .99984 .99985 .99985 .99986 .99986 .99987 .99987 .99988 .99988 .99989
3.7 .99989 .99990 .99990 .99990 .99991 .99991 .99992 .99992 .99992 .99992
3.8 .99993 .99993 .99993 .99994 .99994 .99994 .99994 .99995 .99995 .99995
3.9 .99995 .99995 .99996 .99996 .99996 .99996 .99996 .99996 .99997 .99997

8 Page 8

▲back to top


Population mean, raw data
µ
Sample mean, raw data
x
n
Weighted mean
Xw =
Geometric mean
Geometric
GM
mean rate of increase
Value at end of period
Value at start of period
- 1. 0
Sample mean grouped data
x
n
Median of grouped data
Median=
.!:. -CF
L+ 2
f
Mean deviation
L, I X-X
MD=
n
(Class
width)
Linear regression
equation
Y = a+ i:,x
Sample
variance
s2 =
for raw data
I (x-xi2
n-1
Sample variance,
raw data computational
form
_r.x2_ <D<l2
s2 =
n
n-1
Sample standard deviation,
raw data
s
\\
n-1
Sample standard deviation,
grouped data
Coefficient
of variation
s
CV=
(100)
X
Location
of percentile
p
Lp = (n + 1)
100
Pearson•
r
s Correlation
coefficient
n (_EXY) - (_EX) (_EY)
Correlation
test of hypothesis
t = r~
Population
standard deviation
for raw data
Population
variance for raw data
a2 =
N
Slope
of regression
line
n (I,XY)
b=
- (_EX) (I.Y)
Intercept
of a regression
line
a
The Range
Range
highest - lowest

9 Page 9

▲back to top


APPENDIX B: ADDITIONAL FORMULAE
Position
O.
~J
=
j4n
pos1. t.10np1
=-
jn
100
P(AjB)= P(AnB)
P(B)
z=-- x-µ
CY
X1 -x 2
-S+12 - s22
n, n2
p-Jr
z=--- .1rJ(r)l:
value
value P = L +_(__,_o_j1!_!_o-F_)-)-x--c-'-_
J
fpj
P(x) = n! Jrx (1- .1r)"-x
x!(n- x)!
x-µ
= I 2
catc
<I
x-µ
= fca/c S /
q = 1- p
P= A
(1+ i)"
PV=---P(l + i)"
(1+ j)"
r = (1+ i) 111 -1
D = B(l-i)"