


 |
AMS602S - APPLIED MATHEMATICAL STATISTICAL COMPUTING - 1ST OPP - NOV 2022 |
|
|
1 Page 1 |
▲back to top |
n Am I BI A un IVERS ITV
OF SCIEnCE Ano TECHnOLOGY
FACULTYOF HEALTH,NATURALRESOURCESAND APPLIEDSCIENCES
DEPARTMENT OF MATHEMATICS AND STATISTICS
QUALIFICATION: BACHELOROF SCIENCESIN APPLIEDMATHEMATICS AND STATISTICS
QUALIFICATION CODE: 07 BSAM LEVEL: 6
COURSE CODE: AMS602S
SESSION: NOVEMBER 2022
COURSE: APPLIEDMATHEMATICAL AND STATISTICAL
COMPUTING
PAPER: THEORY
DURATION: 3 Hours
MARKS: 100
EXAMINER
MODERATOR:
FIRST OPPORTUNITY EXAMINATION QUESTION PAPER
Mr. J. J. SWARTZ
Dr. D. B. GEMECHU
INSTRUCTIONS
1.
Answer all the questions using MATLAB R2007b and IBM SPSSStatistics 28
software on your computer
2.
Create a folder with your student number on the desktop, e.g. 20013498
3.
Copy your results from MATLAB R2007b and IBM SPSS Statistics 25 in a MS
Word document and save the word file in your folder containing your student
number and your name, e.g. 2001349.
4.
Copy your folder with its content into the z-drive.
PERMISSIBLEMATERIALS
1.
Computer with MATLAB R2007b, IBM SPSSStatistics 28 and MS Office software
THIS QUESTION PAPER CONSISTS OF 5 PAGES {Including this front page)
|
|
2 Page 2 |
▲back to top |
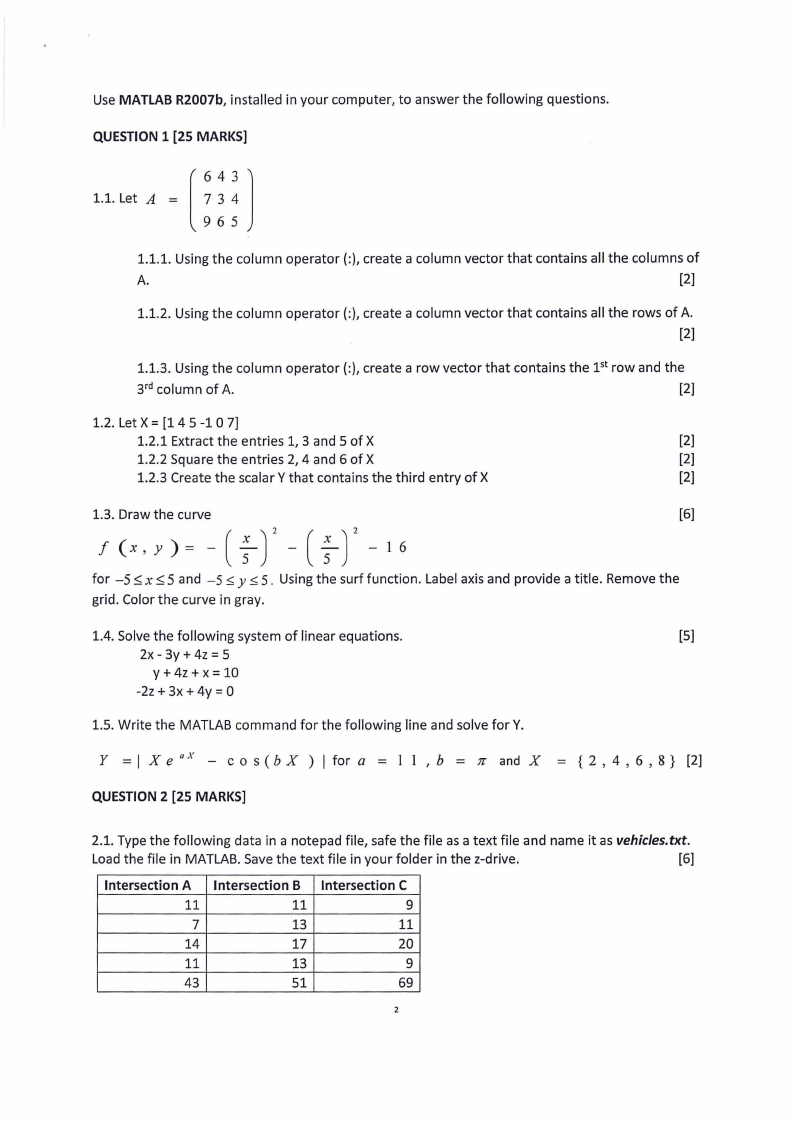
Use MATLAB R2007b, installed in your computer, to answer the following questions.
QUESTION 1 (25 MARKS]
J 1.1. Let A =
643
734
[ 965
1.1.1. Using the column operator(:), create a column vector that contains all the columns of
A.
[2]
1.1.2. Using the column operator(:), create a column vector that contains all the rows of A.
[2]
1.1.3. Using the column operator(:), create a row vector that contains the pt row and the
3rd column of A.
[2]
1.2. Let X = [14 5 -1 0 7]
1.2.1 Extract the entries 1, 3 and 5 of X
[2]
1.2.2 Square the entries 2, 4 and 6 of X
[2]
1.2.3 Create the scalar Y that contains the third entry of X
[2]
1.3. Draw the curve
[6]
for -5 x 5 and -5:;;; y:;;; 5. Using the surf function. Label axis and provide a title. Remove the
grid. Color the curve in gray.
1.4. Solve the following system of linear equations.
[5]
2x - 3y + 4z = 5
y + 4z + X = 10
-2z + 3x + 4y = 0
1.5. Write the MATLAB command for the following line and solve for Y.
Y = I X e O x - c o s ( b X ) I for a = 1 1 , b = 7r and X = { 2 , 4 , 6 , 8 } [2]
QUESTION 2 (25 MARKS]
2.1. Type the following data in a notepad file, safe the file as a text file and name it as vehic/es.txt.
Load the file in MATLAB. Save the text file in your folder in the z-drive.
[6]
Intersection A
11
7
14
11
43
Intersection B
11
13
17
13
51
Intersection C
9
11
20
9
69
2
|
|
3 Page 3 |
▲back to top |
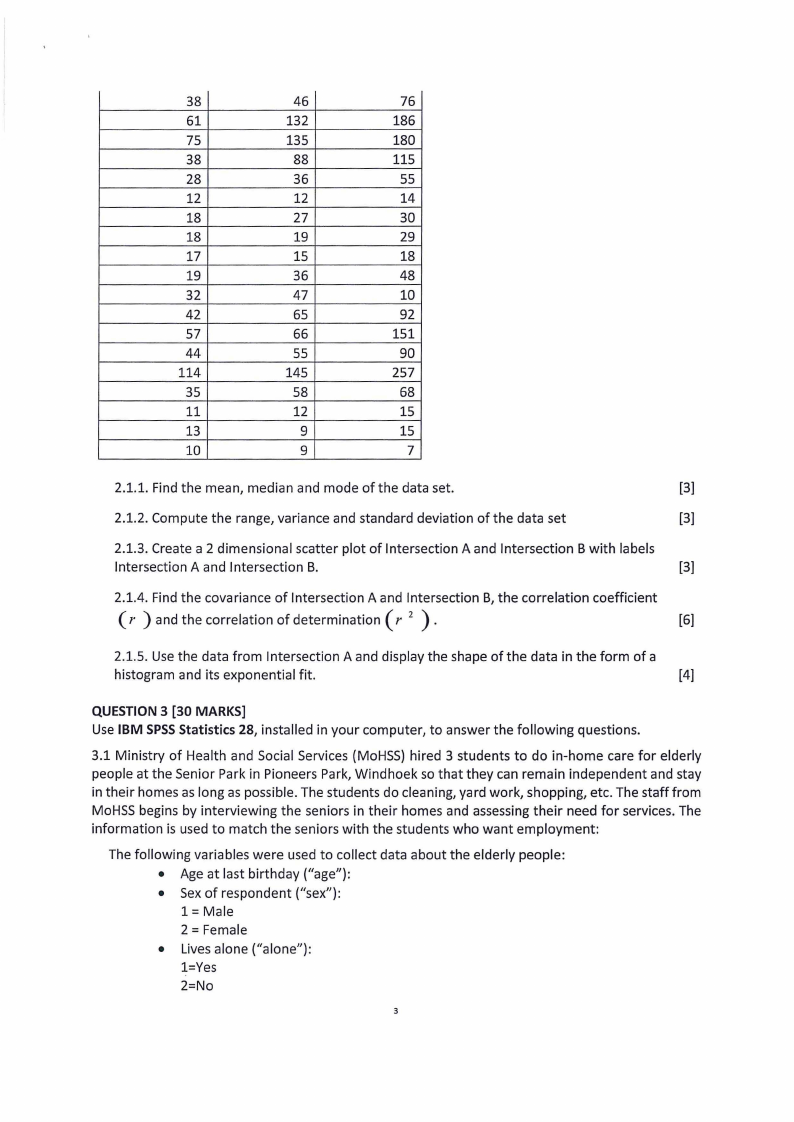
38
46
76
61
132
186
75
135
180
38
88
115
28
36
55
12
12
14
18
27
30
18
19
29
17
15
18
19
36
48
32
47
10
42
65
92
57
66
151
44
55
90
114
145
257
35
58
68
11
12
15
13
9
15
10
9
7
2.1.1. Find the mean, median and mode of the data set.
[3]
2.1.2. Compute the range, variance and standard deviation of the data set
[3]
2.1.3. Create a 2 dimensional scatter plot of Intersection A and Intersection B with labels
Intersection A and Intersection B.
[3]
2.1.4. Find the covariance of Intersection A and Intersection B, the correlation coefficient
( r ) and the correlation of determination ( r 2 ) •
[6]
2.1.5. Use the data from Intersection A and display the shape of the data in the form of a
histogram and its exponential fit.
[4]
QUESTION 3 [30 MARKS]
Use IBM SPSSStatistics 28, installed in your computer, to answer the following questions.
3.1 Ministry of Health and Social Services (MoHSS) hired 3 students to do in-home care for elderly
people at the Senior Park in Pioneers Park, Windhoek so that they can remain independent and stay
in their homes as long as possible. The students do cleaning, yard work, shopping, etc. The staff from
MoHSSbegins by interviewing the seniors in their homes and assessingtheir need for services. The
information is used to match the seniors with the students who want employment:
The following variables were used to collect data about the elderly people:
• Age at last birthday ("age"):
• Sex of respondent ("sex"):
1 = Male
2 = Female
• Lives alone ("alone"):
l=Yes
2=No
|
|
4 Page 4 |
▲back to top |
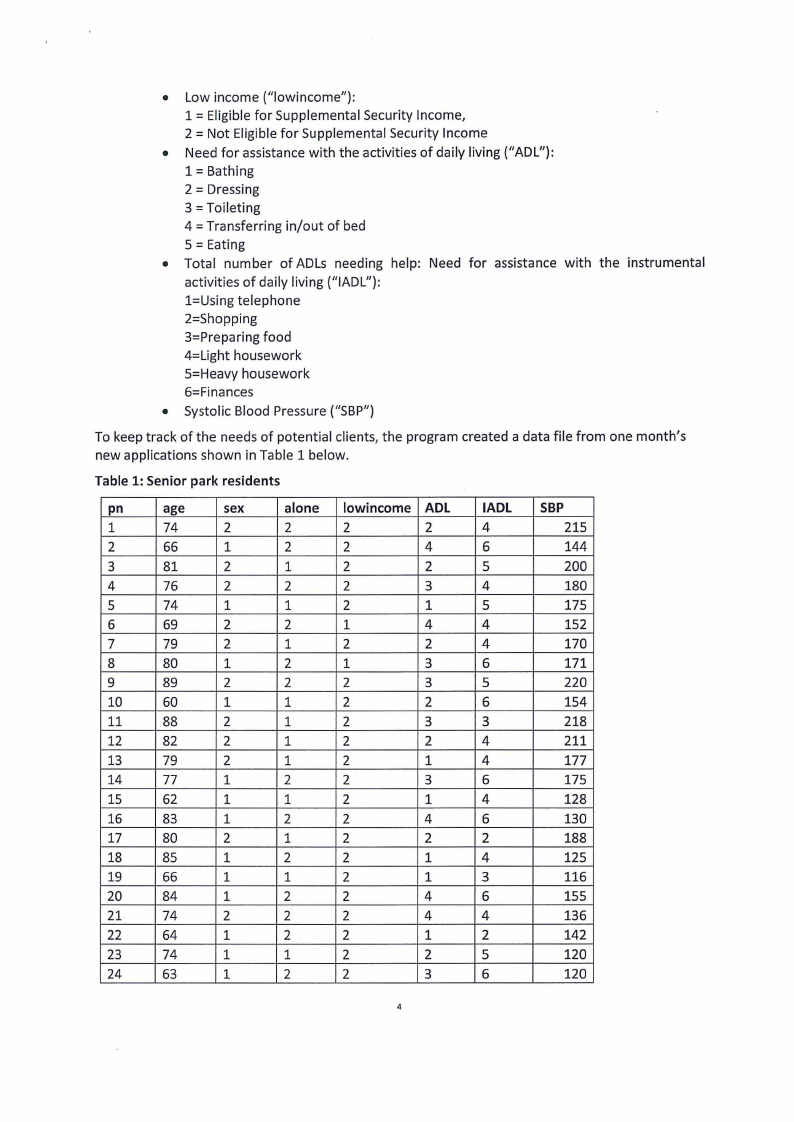
• Low income ("lowincome"):
1 = Eligible for Supplemental Security Income,
2 = Not Eligible for Supplemental Security Income
• Need for assistance with the activities of daily living ("AOL"):
1 = Bathing
2 = Dressing
3 = Toileting
4 = Transferring in/out of bed
5 = Eating
• Total number of ADLs needing help: Need for assistance with the instrumental
activities of daily living ("IADL"):
l=Using telephone
2=Shopping
3=Preparing food
4=Light housework
5=Heavy housework
6=Finances
• Systolic Blood Pressure ("SBP")
To keep track of the needs of potential clients, the program created a data file from one month's
new applications shown in Table 1 below.
Table 1: Senior park residents
pn
age
sex
alone lowincome ADL IADL SBP
1
74
2
2
2
2
4
215
2
66
1
2
2
4
6
144
3
81
2
1
2
2
5
200
4
76
2
2
2
3
4
180
5
74
1
1
2
1
5
175
6
69
2
2
1
4
4
152
7
79
2
1
2
2
4
170
8
80
1
2
1
3
6
171
9
89
2
2
2
3
5
220
10
60
1
1
2
2
6
154
11
88
2
1
2
3
3
218
12
82
2
1
2
2
4
211
13
79
2
1
2
1
4
177
14
77
1
2
2
3
6
175
15
62
1
1
2
1
4
128
16
83
1
2
2
4
6
130
17
80
2
1
2
2
2
188
18
85
1
2
2
1
4
125
19
66
1
1
2
1
3
116
20
84
1
2
2
4
6
155
21
74
2
2
2
4
4
136
22
64
1
2
2
1
2
142
23
74
1
1
2
2
5
120
24
63
1
2
2
3
6
120
4
|
|
5 Page 5 |
▲back to top |
25
66
2
2
2
2
6
160
26
63
1
1
1
1
3
158
27
60
1
1
2
3
6
125
28
65
2
2
1
2
2
155
29
61
1
1
2
4
4
144
30
69
1
1
2
3
6
175
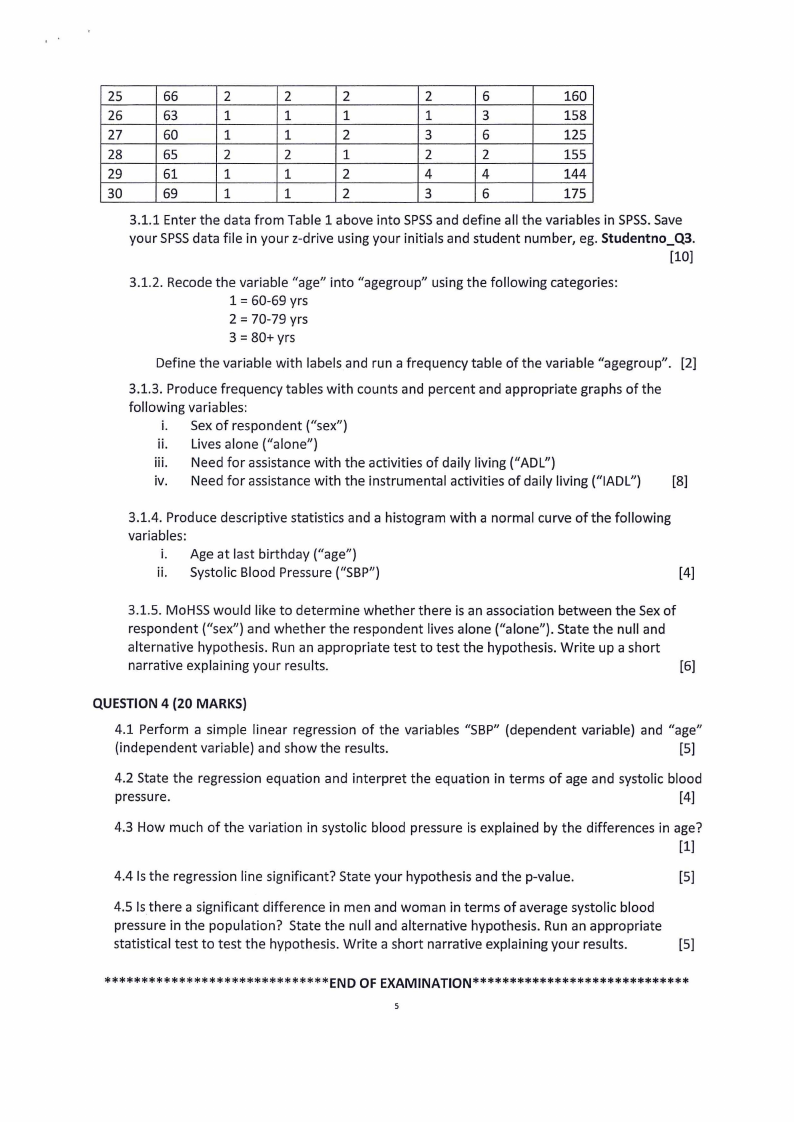
3.1.1 Enter the data from Table 1 above into SPSSand define all the variables in SPSSS. ave
your SPSSdata file in your z-drive using your initials and student number, eg. Studentno_Q3.
[10]
3.1.2. Recode the variable "age" into "agegroup" using the following categories:
1 = 60-69 yrs
2 = 70-79 yrs
3 = 80+ yrs
Define the variable with labels and run a frequency table of the variable "agegroup". [2]
3.1.3. Produce frequency tables with counts and percent and appropriate graphs of the
following variables:
i. Sex of respondent ("sex")
ii. Lives alone ("alone")
iii. Need for assistance with the activities of daily living ("AOL")
iv. Need for assistance with the instrumental activities of daily living ("IADL") [8]
3.1.4. Produce descriptive statistics and a histogram with a normal curve of the following
variables:
i. Age at last birthday ("age")
ii. Systolic Blood Pressure ("SBP")
[4]
3.1.5. MoHSSwould like to determine whether there is an association between the Sexof
respondent ("sex") and whether the respondent lives alone ("alone"). State the null and
alternative hypothesis. Run an appropriate test to test the hypothesis. Write up a short
narrative explaining your results.
[6]
QUESTION4 (20 MARKS)
4.1 Perform a simple linear regression of the variables "SBP" (dependent variable) and "age"
(independent variable) and show the results.
[5]
4.2 State the regression equation and interpret the equation in terms of age and systolic blood
pressure.
[4]
4.3 How much of the variation in systolic blood pressure is explained by the differences in age?
[1]
4.4 Is the regression line significant? State your hypothesis and the p-value.
[5]
4.5 Is there a significant difference in men and woman in terms of average systolic blood
pressure in the population? State the null and alternative hypothesis. Run an appropriate
statistical test to test the hypothesis. Write a short narrative explaining your results.
[5]
******************************END OFEXAMINATION*****************************
5