


 |
ECM712S-ECONOMETRICS-1ST OPP-JUNE 2022 |
|
|
1 Page 1 |
▲back to top |
nAmlBIA unlVERSITY
OF SCIEnCE Ano TECHnOLOGY
FACULTY OF HEALTH AND APPLIED SCIENCES
DEPARTMENT OF ACCOUNTING, ECONOMICS AND FINANCE
QUALIFICATION: BACHELOR OF ECONOMICS
QUALIFICATION CODE:
07BECO
LEVEL: 7
COURSE CODE: ECM712S
COURSE NAME: ECONOMETRICS
SESSION: JUNE 2022
DURATION: 3 HOURS
PAPER:THEORY
MARKS: 100
FIRST OPPORTUNITY EXAMINATION QUESTION PAPER
EXAMINER(S) MR. PINEHAS NANGULA
MODERATOR: Dr R. KAMATI
INSTRUCTIONS
1. Answer ALL the questions in section A and B
2. Write clearly and neatly.
3. Number the answers clearly.
PERMISSIBLE MATERIALS
1. Scientific calculator
2. Pen and Pencil
3. Ruler
THIS QUESTION PAPER CONSISTS OF _8_ PAGES (Including this front page)
|
|
2 Page 2 |
▲back to top |
SECTION A
[20 MARKS]
MULTIPLE CHOICE QUESTIONS
I. After estimating by OLS a two regression model, the resulting residuals:
a) Add up to zero if a constant term was included in the model.
b) Are 011hogonal to the model regressors only if a constant term was included in the
model.
c) Have constant variances and null covariances whenever the model errors have these
properties.
d) None of the above
2. What is the difference between R2 and the adjusted R2?
a) the adjusted R2 always increases as more independent variables are added to the model
b) the adjusted R2 is smaller in this case because the constant term is negative
c) the adjusted R2 adjusts explanatory power by the degrees of freedom
d) None of the above
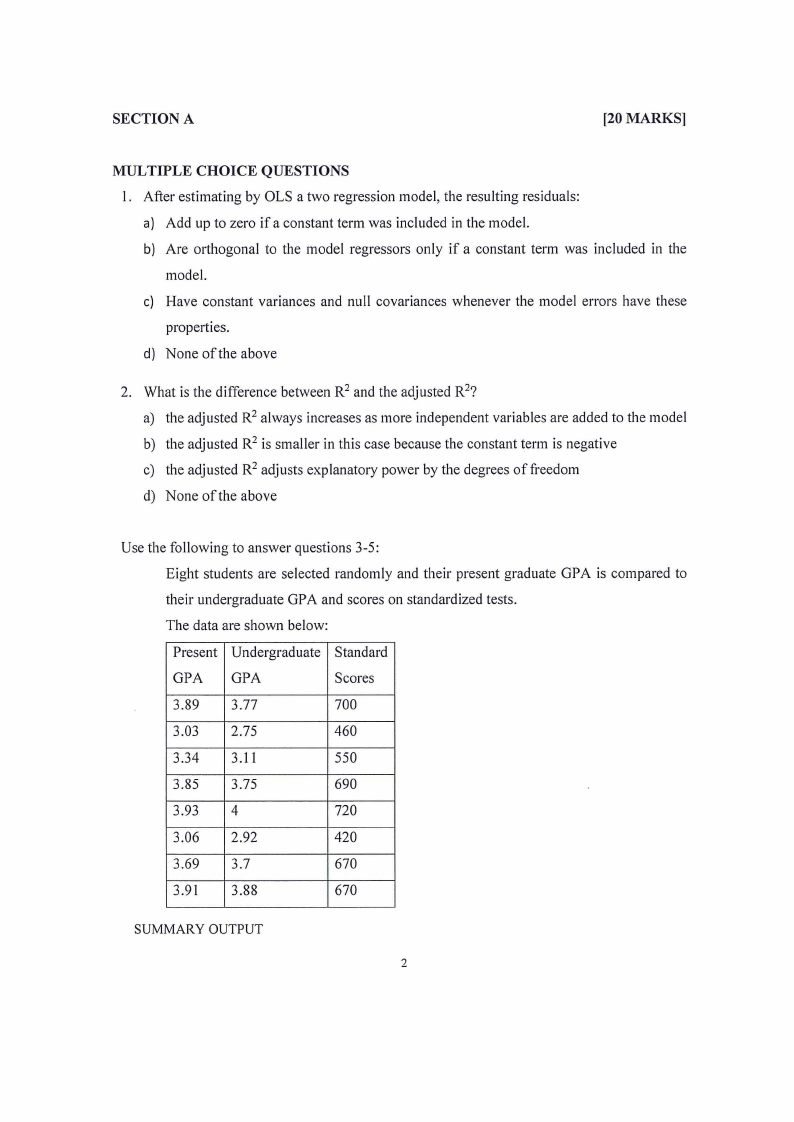
Use the following to answer questions 3-5:
Eight students are selected randomly and their present graduate GPA is compared to
their undergraduate GPA and scores on standardized tests.
The data are shown below:
Present Undergraduate Standard
GPA GPA
Scores
3.89 3.77
700
3.03 2.75
460
3.34 3.11
550
3.85 3.75
690
3.93 4
720
3.06 2.92
420
3.69 3.7
670
3.91 3.88
670
SUMMARY OUTPUT
2
|
|
3 Page 3 |
▲back to top |
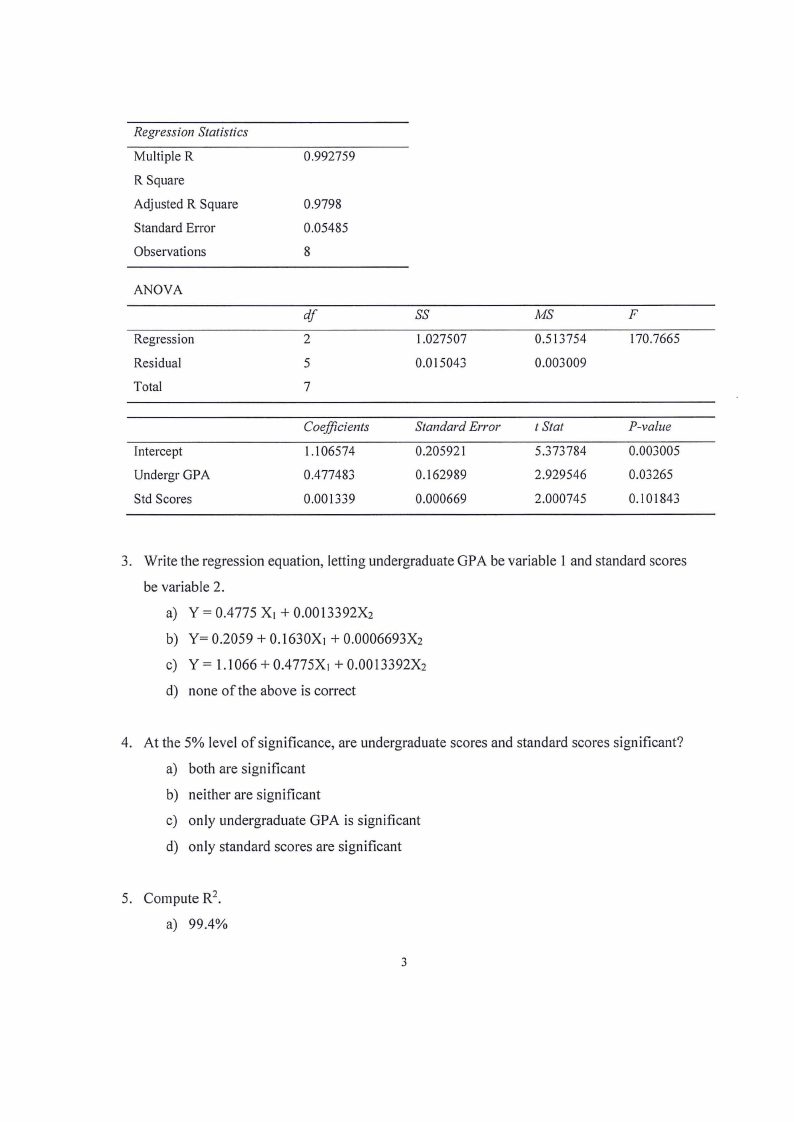
Regression Statistics
Multiple R
R Square
Adjusted R Square
Standard Error
Observations
ANOVA
Regression
Residual
Total
Intercept
Undergr GPA
Std Scores
0.992759
0.9798
0.05485
8
df
2
5
7
Coefficients
1.106574
0.477483
0.001339
ss
1.027507
0.015043
MS
0.513754
0.003009
F
170.7665
Standard Error
0.205921
0.162989
0.000669
t Stat
5.373784
2.929546
2.000745
P-value
0.003005
0.03265
0.101843
3. Write the regression equation, letting undergraduate GPA be variable 1 and standard scores
be variable 2.
a) Y = 0.4775 X1 + 0.0013392X2
b) Y= 0.2059 + 0.1630X1 + 0.0006693X2
c) Y = 1.1066 + 0.4775X1 + 0.0013392X2
d) none of the above is correct
4. At the 5% level of significance, are undergraduate scores and standard scores significant?
a) both are significant
b) neither are significant
c) only undergraduate GPA is significant
d) only standard scores are significant
5. Compute R2•
a) 99.4%
3
|
|
4 Page 4 |
▲back to top |
b) 98.6%
c) 20.8%
d) very close to 100%
6. Dummy variables are used when:
a) qualitative variables are involved in the model
b) quantitative variables are involved in the model
c) doing residual analysis
d) making transformations of quantitative variables
=Po+P P 7. Suppose you obtain the following fitted model: bwght
1 cigs + 2faminc, where
bwght is child birth weight in ounces, cigs is the average daily number of cigarettes smoked
per day by the mother during pregnancy, and famine is family income measured in dollars.
Pois an estimate of
a) how many cigarettes a day it takes to lower birth weight by 1 ounce, on average
b) how many ounces an extra cigarette a day lowers birth weight, on average.
c) how many ounces the average baby weighs, when cigs=0 and faminc=0.
d) the standard error of cigs.
8. The interpretation of the slope coefficient in the model ln~ = [30 + /31 In Xi + ui is as
follows: a
a) change in X by one unit is associated with a 100 % change in Y.
b) 1% change in X is associated with a % change in Y.
c) 1% change in X is associated with a change in Y of 0.01
d) change in X by one unit is associated with a change in Y.
9. What will be the properties of the OLS estimator in the presence of multicollinearity?
a) It will be consistent, unbiased and efficient
b) It will be consistent and unbiased but not efficient
c) It will be consistent but not unbiased
d) It will not be consistent
4
|
|
5 Page 5 |
▲back to top |
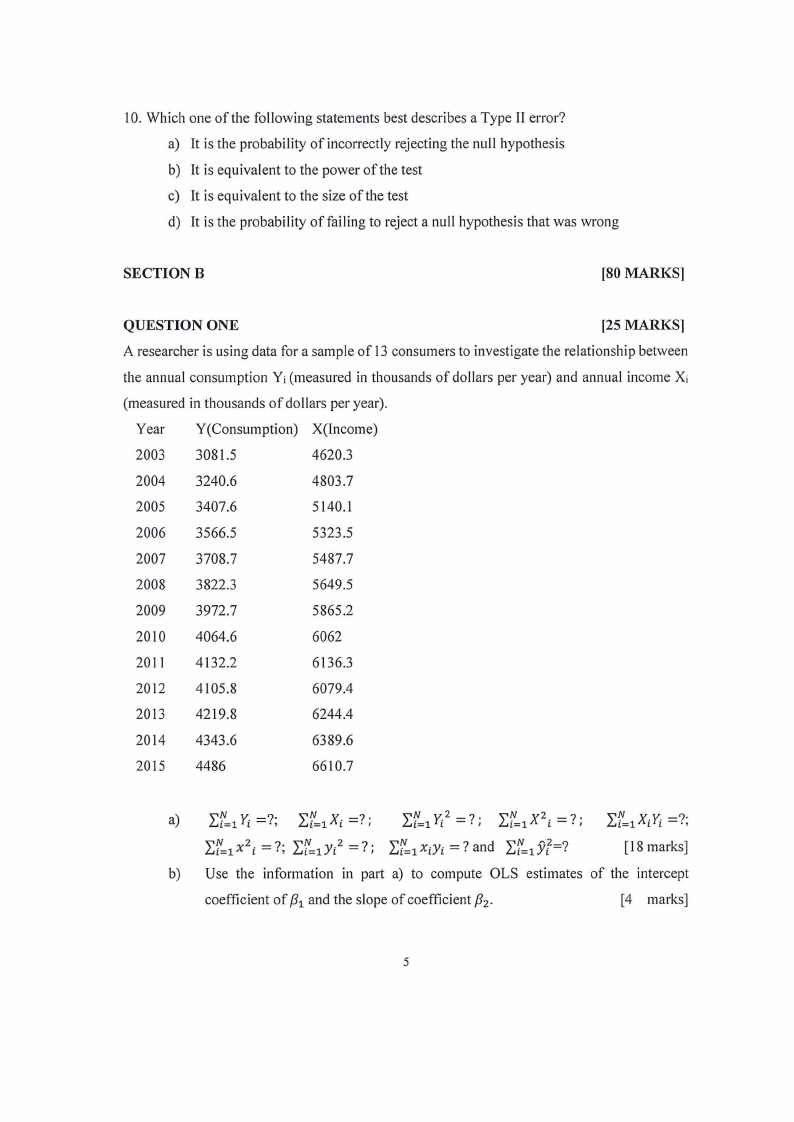
10. Which one of the following statements best describes a Type II error?
a) It is the probability of incorrectly rejecting the null hypothesis
b) It is equivalent to the power of the test
c) It is equivalent to the size of the test
d) It is the probability of failing to reject a null hypothesis that was wrong
SECTIONB
[80 MARKS]
QUESTION ONE
[25 MARKS]
A researcher is using data for a sample of I 3 consumers to investigate the relationship between
the annual consumption Yi (measured in thousands of dollars per year) and annual income Xi
(measured in thousands of dollars per year).
Year Y(Consumption) X(lncome)
2003 3081.5
4620.3
2004 3240.6
4803.7
2005 3407.6
5140.1
2006 3566.5
5323.5
2007 3708.7
5487.7
2008 3822.3
5649.5
2009 3972.7
5865.2
2010 4064.6
6062
2011 4132.2
6136.3
2012 4105.8
6079.4
2013 4219.8
6244.4
2014 4343.6
6389.6
2015 4486
6610.7
a)
L"N..i=l Yi. --.?,·
L"N..i=l Xi --?. ,.
xz _ L"N..i=l Yi, 2 -_ 7· ,. L"N..i=l
i - 7·. ,
L"N..i=l Xi Yi, --?··,
L"N..i=l x2 i _- 7·,. L"N..i=l y i 2 -_ 7· ,. L"N..i=l x i y i _- 7· and L"N..i=l y~i2=?·
[18 marks]
b) Use the information in pait a) to compute OLS estimates of the intercept
coefficient of /31 and the slope of coefficient {32 .
[4 marks]
5
|
|
6 Page 6 |
▲back to top |
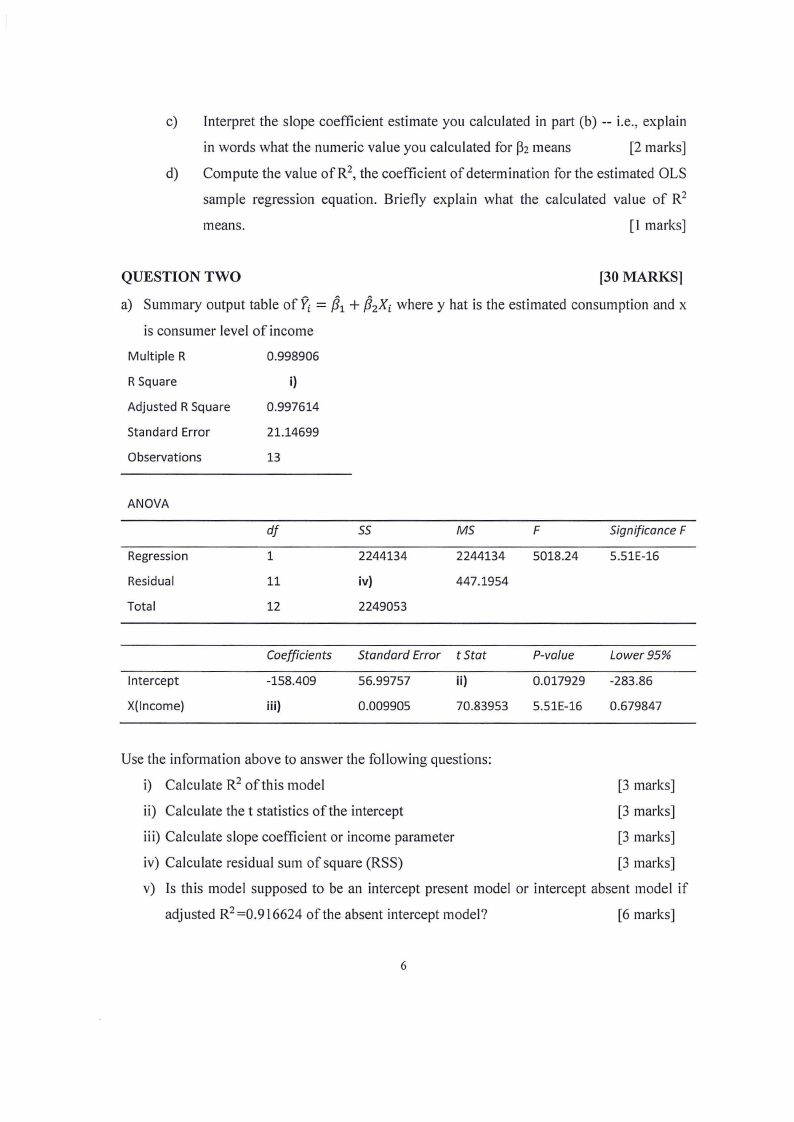
c) Interpret the slope coefficient estimate you calculated in part (b) -- i.e., explain
in words what the numeric value you calculated for P2 means
[2 marks]
d) Compute the value of R2, the coefficient of determination for the estimated OLS
sample regression equation. Briefly explain what the calculated value of R2
means.
[l marks]
QUESTION TWO
[30 MARKS]
/3 a) Summary output table of Yi = 1 + /32Xi where y hat is the estimated consumption and x
is consumer level of income
Multiple R
0.998906
R Square
i)
Adjusted R Square
0.997614
Standard Error
21.14699
Observations
13
ANOVA
df
55
MS
F
Significance F
Regression
1
2244134
2244134 5018.24
5.51E-16
Residual
11
iv)
447.1954
Total
12
2249053
Intercept
X(lncome)
Coefficients
-158.409
iii)
Standard Error t Stat
56.99757
ii)
0.009905
70.83953
P-value
0.017929
5.51E-16
Lower 95%
-283.86
0.679847
Use the information above to answer the following questions:
i) Calculate R2 of this model
[3 marks]
ii) Calculate the t statistics of the intercept
[3 marks]
iii) Calculate slope coefficient or income parameter
[3 marks]
iv) Calculate residual sum of square (RSS)
[3 marks]
v) Is this model supposed to be an intercept present model or intercept absent model if
adjusted R2 =0.916624 of the absent intercept model?
[6 marks]
6
|
|
7 Page 7 |
▲back to top |

b) Given the following two summary output tables
Summary output table 1 [ Yi = /J1 + /J2Xi + /J3 GDd
Regression Statistics
Multiple R
0.999074
R Square
0.998149
Adjusted R Square 0.987779
Standard Error
20.40407
Observations
13
df
55
MS
Regression
2
2244890
1122445
Residual
10
4163.263
416.3263
Total
12
2249053
Coefficients Standard Error t Stat
Intercept
-155.853
55.02788
-2.83226
Xi
0.700197
0.009617
72.80746
GDi
0.000272
0.000202
1.347446
Significance F
2.17E-14
Lower 95%
-278.463
0.678769
-0.00018
Upper95%
-33.2437
0.721626
0.000723
Multiple R
R Square
Adjusted R Square
Standard Error
Observations
Regression
Residual
Total
Intercept
Xi
0.998906
0.997813
0.999914
21.14699
13
df
1
11
12
Coefficients
-158.409
0.701647
55
2244134
4919.149
2249053
Standard Error
56.99757
0.009905
MS
2244134
447.1954
t Stat
-2.77923
70.83953
Significance F
5.5104E-16
Lower 95%
-283.86022
0.67984663
Upper 95%
-32.9586
0.723447
Did we make a mistake by including government debt (GD) in the model? Use evidence from
the two summaries out table to justify your answer.
[12 marks]
7
|
|
8 Page 8 |
▲back to top |
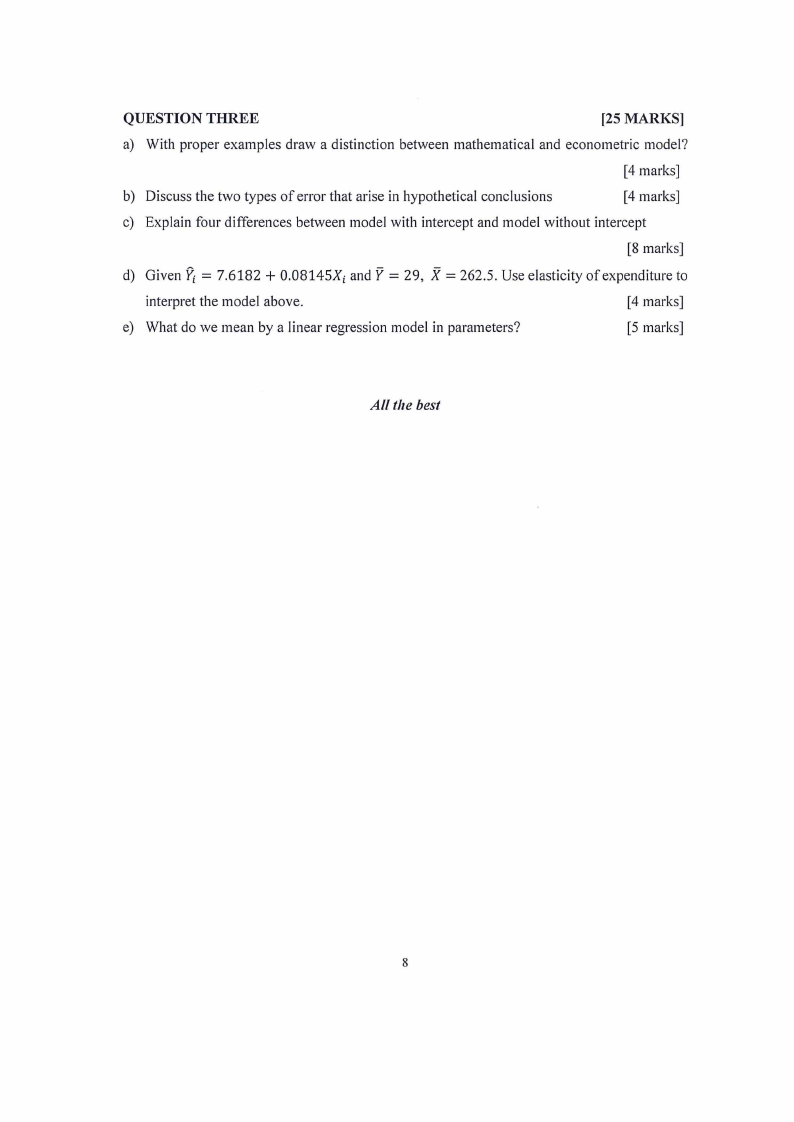
QUESTION THREE
[25 MARKS]
a) With proper examples draw a distinction between mathematical and econometric model?
[4 marks]
b) Discuss the two types of error that arise in hypothetical conclusions
[4 marks]
c) Explain four differences between model with intercept and model without intercept
[8 marks]
d) Given Yi= 7.6182 + 0.08145Xi and Y = 29, X = 262.5. Use elasticity of expenditure to
interpret the model above.
[4 marks]
e) What do we mean by a linear regression model in parameters?
[5 marks]
All the best
8