


 |
ECM712S-ECONOMETRICS-2ND OPP- JULY2024 |
|
|
1 Page 1 |
▲back to top |
nAmI BI AunIVERS ITV
OF SCIEnCE Ano TECHnOLOGY
FACULTY OFCOMMERCE, HUMAN SCIENCE AND EDUCATION
DEPARTMENT OF ECONOMICS, ACCOUNTING AND FINANCE
QUALIFICATION: BACHELOR OF ECONOMICS
QUALIFICATION CODE: 07BECO
LEVEL: 7
COURSE CODE: ECM712s
COURSE NAME: ECONOMETRICS
SESSION: JULY 2024
PAPER: THEORY
DURATION: 3 HOURS
MARKS: 100
SECOND OPPORTUNITY EXAMINATION QUESTION PAPER
EXAMINER(S) MR. PINEHAS NANGULA
MODERATOR:
INSTRUCTIONS
Dr R. KAMATI
1. Answer ALL the questions in section A and B
2. Write clearly and neatly.
3. Number the answers clearly.
PERMISSIBLE MATERIALS
1. Scientific calculator
2. Pen and Pencil
3. Ruler
THIS QUESTION PAPER CONSISTS OF _5_ PAGES (Including this front page)
|
|
2 Page 2 |
▲back to top |
SECTION A
MULTIPLE CHOICE QUESTIONS
1. Data collected at a point in time is called
a) Cross-sectional data
b) Time series data
c) Pooled data
d) Panel data
2. OLSstands for what in Econometrics?
a) Optimally Linearized Solution
b) There is no such thing in Econometrics
c) The only rock band that Econometricians are crazy about
d) Ordinary Least Squares
[20 MARKS]
3. In the estimated model logQ. = 2.25 - 0.7logPi + 0.02Yi, where pis the price and q is the
L
quantity demanded of a certain good and Y is disposable income, what is the meaning of
the coefficient on logP?
a) If the price increases by 1%, the demanded quantity will be 0.007% lower on average,
ceteris paribus
b) If the price increases by 1%, the demanded quantity will be 70% lower on average,
ceteris paribus
c) If the price increases by 1%, the demanded quantity will be 0.7% lower on average,
ceteris paribus
d) None of the answers above is correct
4. In the estimated model logQi = 2.25 - 0.7logP; + 0.02Yu where p is the price and q is the
quantity demanded of a certain good and Y is disposable income, what is the meaning of
the coefficient on logY?
a) If disposable income increases by a thousand dollars, the demanded quantity will be
0.02% higher on average, ceteris paribus
b) If disposable income increases by a thousand dollars, the demanded quantity will be
0.0002% higher on average, ceteris paribus
c) If disposable income increases by a thousand dollars, the demanded quantity will be
2% higher on average, ceteris paribus
d) None of the answers above is correct
5. Data collected for a variable over a period of time is called
2
|
|
3 Page 3 |
▲back to top |
a) Cross-sectional data
b) Time series data
c) Pooled data
d) Panel data
6. . Which of the following statements is TRUEconcerning OLSestimation?
a) OLSminimises the sum of the vertical distances from the points to the line
b) OLSminimises the sum of the squares of the vertical distances from the points to the
line
c) OLSminimises the sum of the horizontal distances from the points to the line
d) OLS minimises the sum of the squares of the horizontal distances from the points to
the line.
7. Which of the following are alternative names for the dependent variable (usually denoted
by y) in linear regression analysis?
a) The regressand
b) The regressor
c) The explanatory variable
d) None of the above
8. Which one of the following statements best describes the algebraic representation of the
fitted regression line?
A
A
A
A
a) Yr= a+ fz1 +u1
bl >'1= a+'A,
9. The residual from a standard regression model is defined as
a) The difference between the actual value, y, and the mean, y-bar
b) The difference between the fitted value, y-hat, and the mean, y-bar
c) The difference between the actual value, y, and the fitted value, y-hat
d) The square of the difference between the fitted value, y-hat, and the mean, y-bar
10. Which one of the following statements best describes a Type II error?
a. It is the probability of incorrectly rejecting the null hypothesis
b. It is equivalent to the power of the test
c. It is equivalent to the size of the test
3
|
|
4 Page 4 |
▲back to top |
d. It is the probability of failing to reject a null hypothesis that was wrong
SECTION B
[80 MARKS]
QUESTION ONE
[30 MARKS]
All questions pertain to the simple (two-variable) linear regression model for which the
population regression equation can be written in conventional notation as:
l't = /31+ /32Xi + u 1 equation 1
where l't and Xi are observable variables, /31 and {32 are unknown (constant) regression
coefficients, and Ui is an unobservable random error term. The Ordinary Least Squares (OLS)
sample regression equation corresponding to regression equation (1) is
Yi = P1 + P2Xi + ui equation 2
P where p 1 is the OLS estimator of the intercept coefficient {31, 2 is the OLS estimator of the
slope coefficient/3 2 , ui is the OLS residual for the i-th sample observation, and N is sample
size (the number of observations in the sample).
a) State the Ordinary Least Squares (OLS) estimation criterion. State the OLS normal
equations.
[5 marks]
b) Derive the OLS normal equations from the OLS estimation criterion.
[5 marks]
c) Show that the OLS slope coefficient estimatorp 1, is a linear function of the l't,sample
values.
[ 10 marks]
d) Stating explicitly all required assumptions, prove that the OLS slope coefficient estimator
p2
is an unbiased
estimator
l
of the slope
coefficient
/32 •
[ 10 marks]
QUESTION TWO
[20 MARKS]
The following is the econometric model which is presented in four different forms. You are
require to interpret each of them.
a) C= - 8.078 +0.706411ncome
[S marks]
b) C= - 18.072+22.73841Loglncome
[5 marks]
c) LogC= 7.203+0.0002181ncome
[S marks]
d) LogC= - 0.2957+1.0464Logincome
[S marks]
4
|
|
5 Page 5 |
▲back to top |
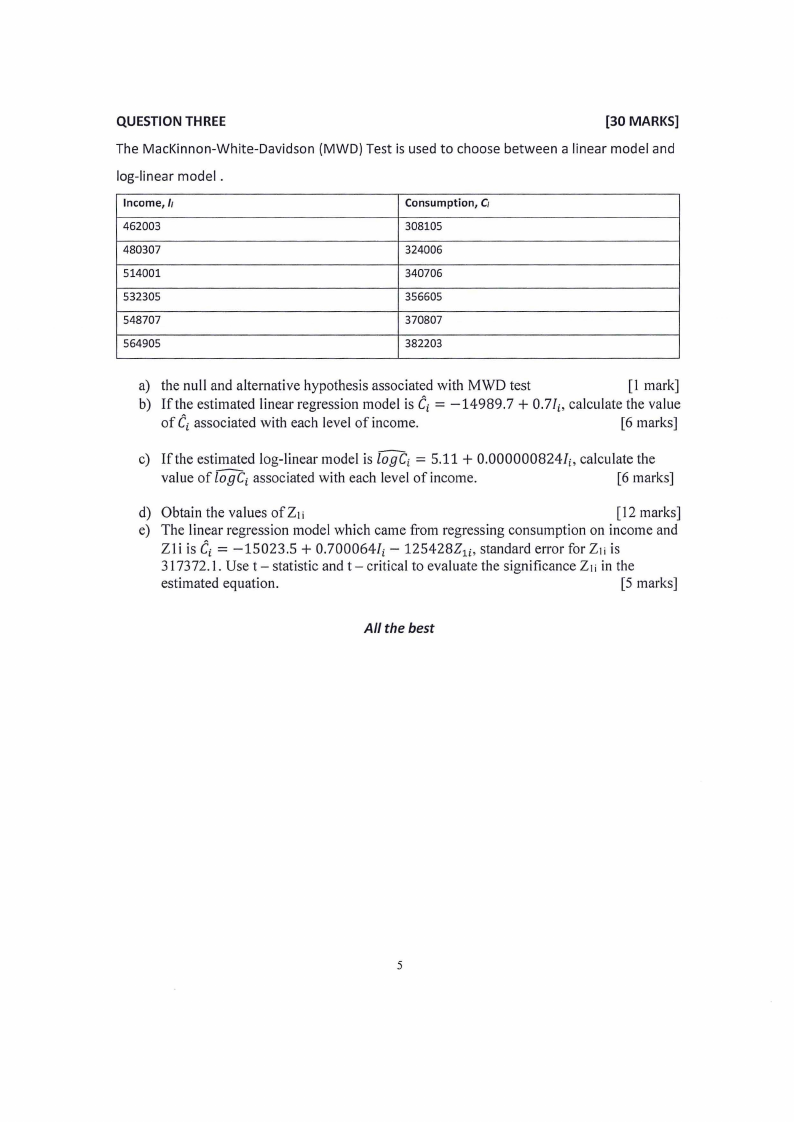
QUESTION THREE
[30 MARKS]
The MacKinnon-White-Davidson {MWD) Test is used to choose between a linear model and
log-linear model .
Income, Ii
462003
480307
514001
532305
548707
564905
Consumption, c,
308105
324006
340706
356605
370807
382203
a) the null and alternative hypothesis associated with MWD test
[I mark]
b) If the estimated linear regression model is Ci= -14989.7 + 0.7/i, calculate the value
of Ci associated with each level of income.
[6 marks]
c) If the estimated log-linear model is log Ci = 5.11 + 0.000000824/i, calculate the
value of log Ci associated with each level of income.
[6 marks]
d) Obtain the values of Z1i
[12 marks]
e) The linear regression model which came from regressing consumption on income and
Zli is Ci= -15023.5 + 0.700064/i - 125428Z 1i, standard error for Zti is
3173 72.1. Use t - statistic and t - critical to evaluate the significance Z Ii in the
estimated equation.
[5 marks]
All the best
5