


 |
DEM602S - DEMOGRAPHY - 2ND OPP - JANUARY 2024 |
|
|
1 Page 1 |
▲back to top |

nAm I BIA un IVERSITY
OF SCIEnCEAno TECHnOLOGY
FacultyofHealthN, atural
ResourceasndApplied
Sciences
Schoool f NaturalandApplied
Sciences
Departmentof Mathematics.
StatisticsandActuariaSl cience
13JacksonKaujeuaStreet
PrivateBag13388
Windhoek
NAMIBIA
T: +264612072S13
E: msas@nust.na
W: www.nust.na
QUALIFICATION : BACHELOR of SCIENCE IN APPLIED MATHEMATICS AND STATISTICS
QUALIFICATION CODE: 07BSAM
LEVEL: 6
COURSE: DEMOGRAPHY
DATE: JANUARY 2024
COURSECODE: DEM602S
SESSION: 1
DURATION: 3 HOURS
MARKS: 80
EXAMINER:
MODERATOR:
SECOND OPPORTUNITY: EXAMINATION QUESTION PAPER
MR. ANDREW ROUX
MR. JAN SWARTZ
INSTRUCTIONS
1. Answer all questions on the separate answer sheet.
2. Please write neatly and legibly.
3. Do not use the left side margin of the exam paper. This must be allowed for the
examiner.
4. No books, notes and other additional aids are allowed.
5. Mark all answers clearly with their respective question numbers.
PERMISSIBLE MATERIAL
1. Non-Programmable Calculator
This paper consists of 5 pages including this front page
|
|
2 Page 2 |
▲back to top |

QUESTION 1
Age Structures
[27)
1.1) State the balancing formula which is used to express population growth.
( identify all variables in the formula)
(5)
1.2) The table below presents figures obtained from 2011 Population and Housing
Census of Namibia (Source : NSA, 2011 Population and Housing Census National
Report)
AGE
0-4
5-9
10-14
15-19
20-24
25-29
30-34
35-39
40-44
45-49
50-54
55-59
60-64
65-69
70-74
75-79
80+
Total
MEN AND
WOMEN
5288700
4502500
4106700
3643900
3205200
2771100
2286900
1912500
1590600
1334000
1083800
890500
711200
538300
383700
234800
159400
34643800
Use the data provided to calculate the following demographic measures:
1.2.1) Child Dependency Ratio
(3)
1.2.2) Age Dependency Ratio
(3)
1.2.3) Total dependency Ratio
(3)
1.2.4) The Median age
(5)
2
|
|
3 Page 3 |
▲back to top |
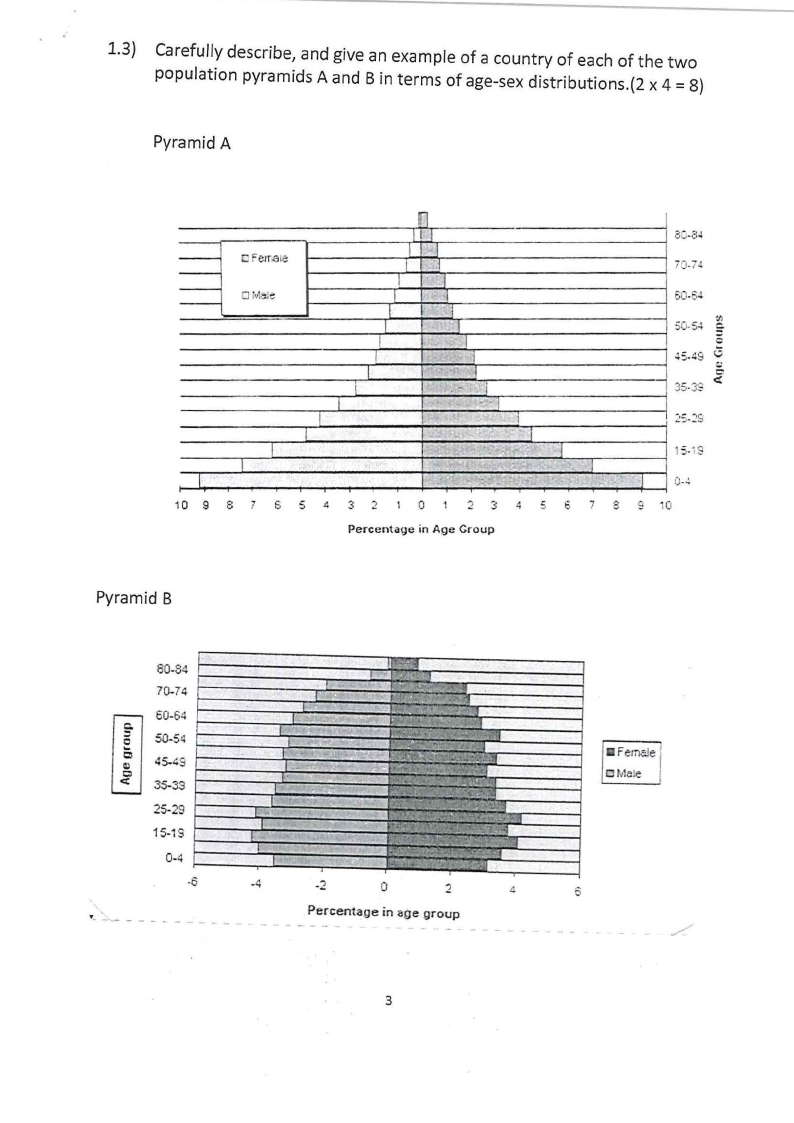
1.3) Carefully describe, and give an example of a country of each of the two
population pyramids A and Bin terms of age-sex distributions.(2 x 4 = 8)
Pyramid A
OMaJ-::
n
II
II
IJ
I
I
I
I
I
I
I
I
I
I
I
J
I
l
I
I
I
II
'I
I
a~a~
7J-7..:.
60-64
..,,
SD-54
C...
45-49 (.;
35.3_ i
_-_-I-771::.:: ~- _-__1--,.-_-_-1_.- _- _- _-_- _- __;-i---_=:..._.._ --::-_-- _- _- ~:---..L. _- ..L._T
--1,1,_..--,---,-.-,---,.--,----,.--+---,---,-.--,.--,--~~~~-:"
. u-~
10 9 8 7 S 5 4 3 '.2 1 0
2 3 4 5 6 7 8 9 10
Percentage in Age Group
Pyramid B
80-84
70-74
60-64
rn50-54
45-49
35-39
25-29
a Female
OMele
15-1 S
0-4
-6
-4
0
2
a
0
·-_...,_- - - - - -
Percentage in age group
3
|
|
4 Page 4 |
▲back to top |
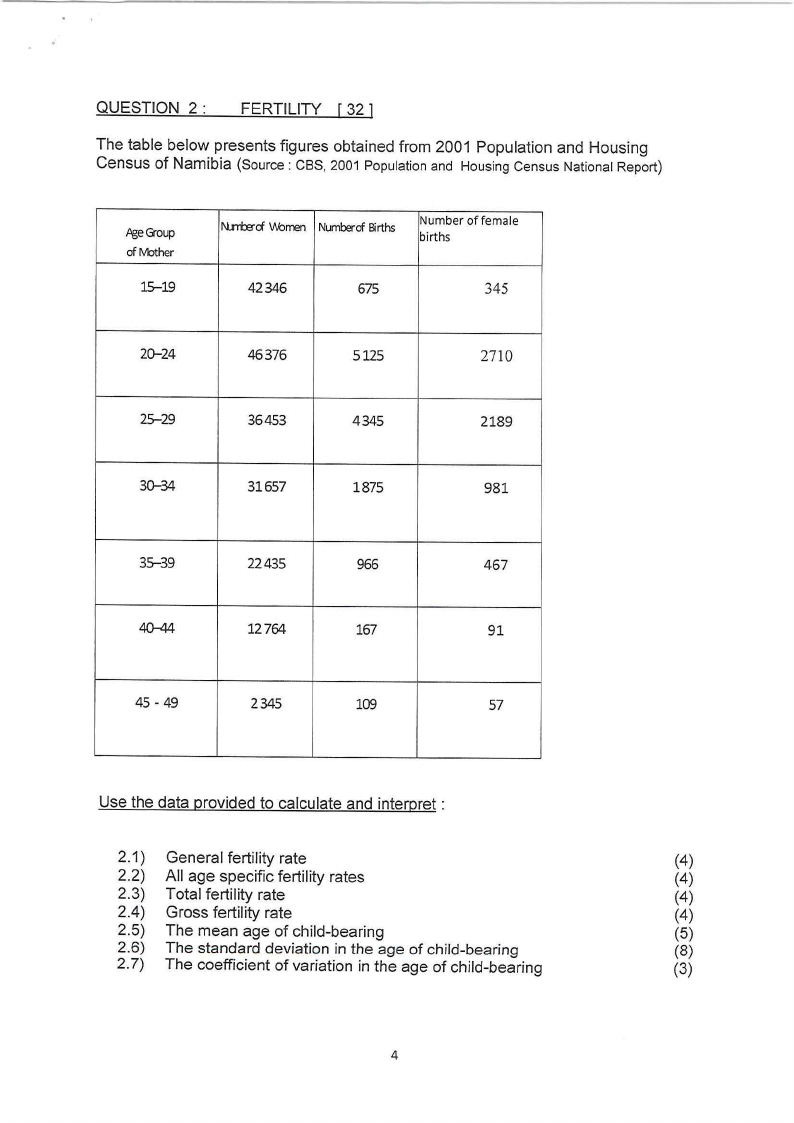
QUESTION 2:
FERTILITY [ 32 l
The table below presents figures obtained from 2001 Population and Housing
Census of Namibia (Source: CBS, 2001 Population and Housing Census National Report)
AgeQ-oup
of 1\\/bther
15--19
N..rrh:n'iM)rren NumberofBirths Number of female
births
42346
675
345
20-24
46376
5125
2710
25--29
36453
4345
2189
30-34
31657
1875
981
35--39
22435
966
467
40-44
12764
167
91
45 - 49
2345
109
57
Use the data provided to calculate and interpret:
2.1) General fertility rate
(4)
2.2) All age specific fertility rates
(4)
2.3) Total fertility rate
(4)
2.4) Gross fertility rate
(4)
2.5) The mean age of child-bearing
(5)
2.6) The standard deviation in the age of child-bearing
(8)
2.7) The coefficient of variation in the age of child-bearing
(3)
4
|
|
5 Page 5 |
▲back to top |
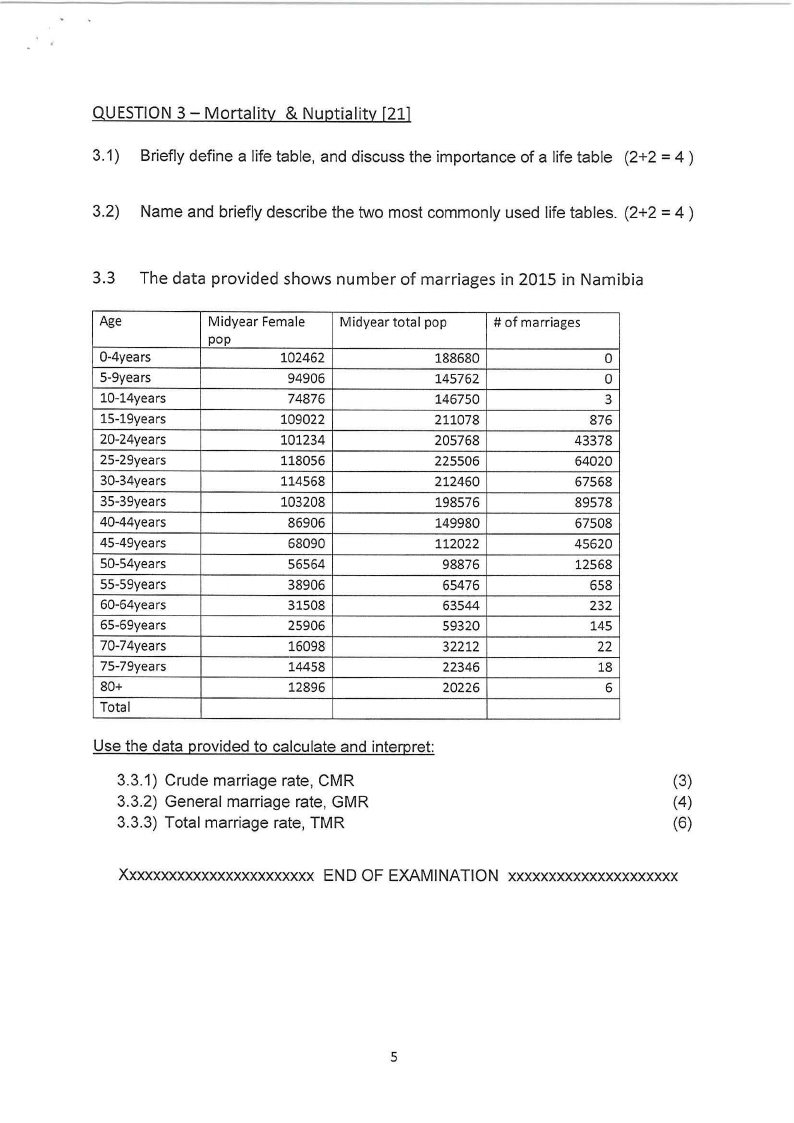
QUESTION 3 - Mortality & Nuptiality [21)
3.1) Briefly define a life table, and discuss the importance of a life table (2+2 = 4 )
3.2) Name and briefly describe the two most commonly used life tables. (2+2 = 4 )
3.3 The data provided shows number of marriages in 2015 in Namibia
Age
0-4years
5-9years
10-14years
15-19years
20-24years
25-29years
30-34years
35-39years
40-44years
45-49years
50-54years
55-59years
60-64years
65-69years
70-74years
75-79years
80+
Total
Midyear Female
pop
102462
94906
74876
109022
101234
118056
114568
103208
86906
68090
56564
38906
31508
25906
16098
14458
12896
Midyear total pop
188680
145762
146750
211078
205768
225506
212460
198576
149980
112022
98876
65476
63544
59320
32212
22346
20226
# of marriages
0
0
3
876
43378
64020
67568
89578
67508
45620
12568
658
232
145
22
18
6
Use the data provided to calculate and interpret:
3.3.1) Crude marriage rate, CMR
(3)
3.3.2) General marriage rate, GMR
(4)
3.3.3) Total marriage rate, TMR
(6)
Xxxxxxxxxxxxxxxxxxxxxxxx END OF EXAM INATl ON xxxxxxxxxxxxxxxxxxxxx
5