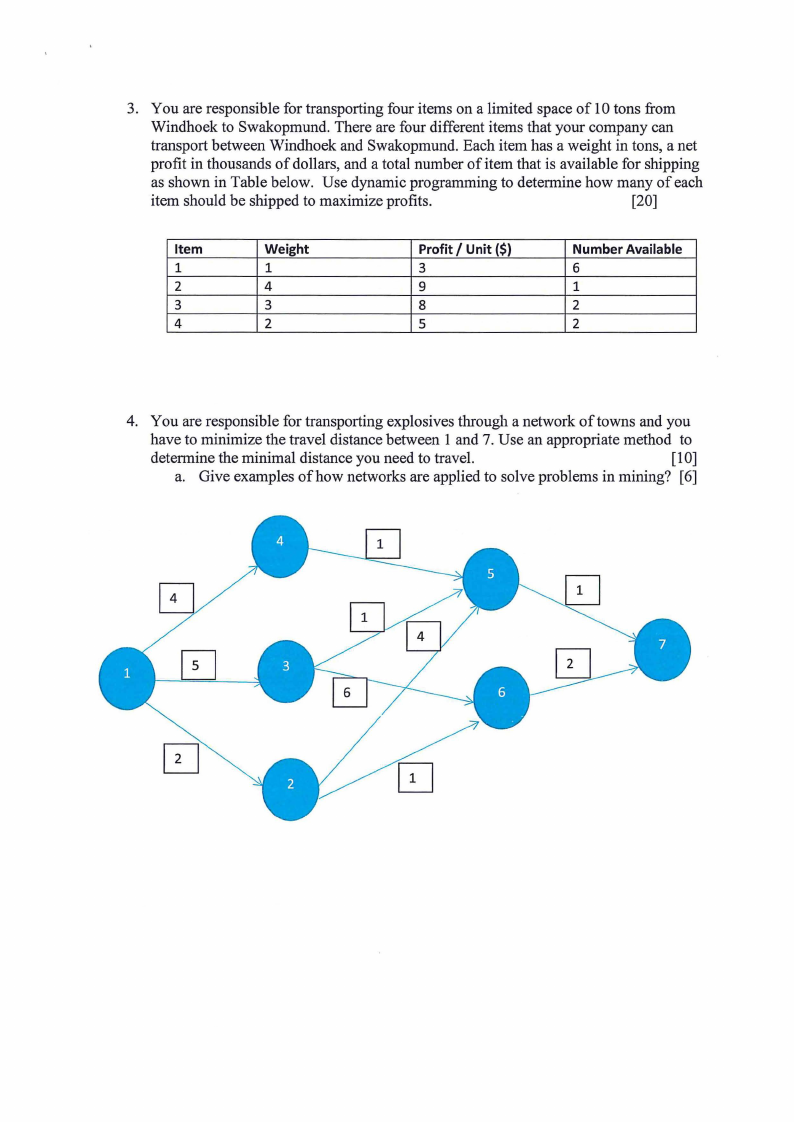
ORC711S - Operations Research 313 - 2nd Opp - June 2022


ORC711S - Operations Research 313 - 2nd Opp - June 2022


1 Page 1

▲back to top


n Am I BI A u n IVER s ITY
OF SCIEnCE Ano TECHnOLOGY
FACULTYOF ENGINEERINGAND SPATIALSCIENCE
DEPARTMENT OF Mining and Process Engineering
QUALIFICATION : Bachelors of Engineering in Mining Engineering
QUALIFICATION CODE: BEMIN
LEVEL: 8
COURSECODE: OPC 711S
COURSE NAME: OPERATIONS RESEARCH
SESSION: JUNE 2022
DURATION: 3 HOURS
PAPER: THEORY
MARKS: 100
EXAMINER(S)
MODERATOR:
SECONDOPPORTUNITYQUESTION PAPER
Lawrence Madziwa
Dr Mallikarjun Rao Pillalamarry
INSTRUCTIONS
1. Answer all questions.
2. Read all the questions carefully before answering.
3. Marks for each questions are indicated at the end of each question.
4. Please ensure that your writing is legible, neat and presentable.
PERMISSIBLEMATERIALS
1. Examination paper.
THIS QUESTION PAPER CONSISTS OF 8 PAGES (Including this front page)

2 Page 2

▲back to top


1. The mine stores manager is concerned about the long queues of lorries waiting to deliver
goods on the mine. Occasionally there are as many as 100 deliveries a week, and in some
cases the lorry drivers have had to wait several hours before they can unload at one
unloading bay. This has resulted in congestion at the warehouse and complaints from the
lorry drivers. You have been asked to make recommendations for improving the situation
and have collected delivery data as in the table below.
[20]
Number
Lorries
arriving
hour
of Number
hours
per
of Unloading
(minutes)
time Number
of
lorries
0
7
0-20
38
1
10
20-40
26
2
8
40-60
10
3
8
60-80
3
4
5
80-100
2
5
2
100-120
1
Deliveries are allowed between 9am and 5pm, Monday to Friday. Any lorry that arrive after
5pm can join the queue awaiting unloading. Unloading crew can work overtime.
a. Explain the conditions which must be satisfied in order to apply the basic single
server queuing model (M/M/1).
(4)
b. Assuming that an M/M/1 model is appropriate, convert the data into suitable
information for queuing.
(4)
Number Number xf
of Lorries of hours
arriving (f)
per hour
(x)
Unloading
y
time
(minutes)
Number yf
of lorries f
0
7
0
0-20
10
38
380
1
10
10
20-40
30
26
780
2
8
16
40-60
50
10
500
3
8
24
j 60-80
70
3
210
4
5
20
80-100
90
2
180
5
2
10
100-120
110
1
110
40
80
80
2160
c. Estimate how many lorries, on average are waiting to be unloaded and also the
time that a lorry would expect to spend at the warehouse.
(4)
At any time the expected number of trucks in the system

3 Page 3

▲back to top


d. The unloading bay is currently staffed by two employees who are each paid
$100 for a 40 hour week, with any overtime being paid at a 4/3 rate. A
suggestion has been made that a third person should be employed in the
unloading ay which, it has been estimated, would result in saving of seven
minutes in the average time to unload a lorry. This, it has been claimed, would
not only reduce the lorry waiting time but would also produce a saving in cost
to the mine. Analyse this suggestion and make a recommendation. (8)
2. A CONSTRUCTION COMPANY has just made the winning bid of $5.4 million to
construct a new plant for a major manufacturer. The manufacturer needs the plant to
go into operation within a year. Therefore, the contract includes the following
prov1s10ns:
• A penalty of $300,000 if the company has not completed construction by the
deadline 47 weeks from start.
• To provide additional incentive for speedy construction, a bonus of $150,000 will be
paid to the company if the plant is completed within 40 weeks.
a. The following details pertaining to the project. Construct the network diagram and
compute the project completion time.
[1O]
Table 1: Activities description and predecessors
Activity
A
8
C
D
£
F
C
H
I
I
K
L
·'··f
N
Activity Description
Excavate
L;iy the foundation
Put up the rough w.ill
Put lJp the roof
lmlall the exterior plumbing
lmlall the inlcrio plumbing
Put up the exterior sidiny
Do the <ixlerior pilmting
Do Uw dcctrical work
Put up U-1cv allboard
lml .1. 11the flooriny
Do the intc.-rior painting
lmtall the exterior fixtures
lmL.111the interior fixture~
Immediate
Predecessors
-
A
B
C
C
E
D
£., C
C
F, I
J
J
H
K, L
Table 2: Activity times

4 Page 4

▲back to top


Activity
Optimistic
Estlmilte
0
Most Likely
Estlmilte
m
Pessimistic
Estlmilte
p
A
1
2
3
8
2
31
2
8
C
6
9
18
D
4
51
2
10
[
1
4.2!.
5
F
4
4
10
G
5
6.!.
2
11
H
5
8
17
I
3
7.!.
2
9
)
3
9
9
K
4
4
4
L
1
5l2
7
M
1
2
3
N
5
51
2
9
Table 3:Time-Cost trade off data for the project activities
Activity
A
8
C
D
[
F
G
H
I
J
K
L
M
N
Time
Cost
Normill
Crilsh
Nonnill
Crilsh
2 weeb
4 weeks
10 weeks
6 weeks
4 weeks
.S weeb
7 wcC!ks
9 weeks
7 week~
8 wccb
4 weeks
5 WCC!KS
2 WCl?ks
6 weeks
1 W<c'E?k
2 weeks
7 weeks
4 Wel?ks
3 weeks
3 w<c-eks
4 weeks
6 weeks
5 weeks
6 wc:c,eks
3 weeks
3 weeks
1 w1c-ek
3 weeks
S180,00D
B20,000
$620,000
$260,000
S410,000
S 180,000
S900,000
S200,000
$210,000
S430,000
:S160,00D
$250,000
S 100,000
$330,000
$ 280,000
$ 420,000
s 860,000
s 340,000
s 570,000
s 260,000
$1,020,000
s 380,000
$ 270,000
$ 49D,000
$ 200,000
s 350,000
s 200,000
$ 510,000
b. What is the probability of completing the project in 40 days?
[5]
c. What is the probability of meeting the deadline of 4 7 days?
[4]
d. Evaluate the option of working towards getting the bonus. What is your comment on this option?
[5]

5 Page 5

▲back to top


3. You are responsible for transporting four items on a limited space of 10 tons from
Windhoek to Swakopmund. There are four different items that your company can
transport between Windhoek and Swakopmund. Each item has a weight in tons, a net
profit in thousands of dollars, and a total number of item that is available for shipping
as shown in Table below. Use dynamic programming to determine how many of each
item should be shipped to maximize profits.
[20]
Item
1
2
3
4
Weight
1
4
3
2
Profit/ Unit ($)
3
9
8
5
Number Available
6
1
2
2
4. You are responsible for transporting explosives through a network of towns and you
have to minimize the travel distance between 1 and 7. Use an appropriate method to
determine the minimal distance you need to travel.
[10]
a. Give examples of how networks are applied to solve problems in mining? [6]

6 Page 6

▲back to top


5. One representation of economic order quantity (EOQ) inventory model is;
Q = 1/2CA/c
Where Q is the economic order quantity
C is the cost of placing an order
A is the annual demand in units
c is the cost of holding one unit in stock for one year
Data relevant to component K used at a mine in 22 different sections include;
Purchase price: $15 per 100,
Annual usage: 100,000 units ,
Cost of buying office: fixed 15,575 per annum and variable is $12 per order,
Rent of warehouse: $3,000 per annum,
Heating: $700 per annum
Interest: 25% per annum, insurance 0.05% per annum based on total purchases, deterioration
has been expressed as 1% per annum of all items purchased.
Questions:
a. Calculate the EOQ for component K.
[5]
b. Calculate the percentage change in total annual variable costs relating to component K
if the annual usage was: (i) 125,000 units, and (ii) 75,000 units.
[8]
c. Use the answers for question b above to comment on the sensitivity of the variable
costs to changes in the annual usage.
[4]
d. Describe two methods to help you modify your EOQ calculations if management
decided that the expected total investment in stocks was 30% too high. [3]
(End of Exam)

7 Page 7

▲back to top


8 Page 8

▲back to top


9 Page 9

▲back to top


TABLE1
S1Jndardnorn1JIcurve areas
~,d~ca
'.
0
•POZ <:I
=
11.00 0.01
II.Ill
0.113 o.o.a 0.05
0.06
0.07
0.08
0.09
0.0 0.5000 0.50-lO 0.5080 0.5120 0.5160 0.5199 0.5231) 0.5279 0.53l'J 0.5359
0.1 0.5''JS 0.5-1'S 0.5-178 0.5517 0.5557 0.55')6 0.56 6 0.5675 0.571-1 0.5753
0.2 0.571JJ 0.5832 0.5S7I 0.591()
o.59S7 0.6026 0.(l{X).l 0.6103 0.61-11
0.3 0.6li9 0.6217 0.6255 0.6293 0.6331 ll.636S 0.6-106
0.6-ISO 0.6517
0.-l 0.655-1 0.6591 0.662 0.666-1 ll.6m) 0.6736 0.6772 0.6SO'
0.6879
0.5 0.6915 0.61J50 0.6'JS5 0.7011) 0.705-1 0.7USS 0.712' 0.7157 0.71')(} 0.722-1
0.6 0.7_57 0.7291 0.732-1 0.7357 0.73,'9 0.7-122 0.7-15-1 0.7-1.'6 0.7517 0.75-19
ll.7 0.75Sll 0.7611 0.76-12 ll.7673 0.77()-1 0.7Hl 0.776-1 0.779-1 0.7S2J 0.7852
0.S 0.7SSI 0.7910 0.71J31J 0.7%7 0.791)5 O.St.m ll.8051 0.S07S 0., 106 0. 133
0.9 U.8159 0.8186 0.8212 0.S23S 0 826-1 0.8289 0., '15 U.83-10 O.S365 O.S'S1J
1.0 O.S-I1J O.S-13S U.8-161 o..--lS5
I. I ll.S6-IJ U.S665 O.S6'6 0.S70S
1.2 0.8.'-19 O.S.'61J o.ssss 0.81)()7
I.
(1.1)032 O.'XJ-19 ()_<J()(\\6 0.90S2
1.-1 0.9192 0.9207 o.1J_22 0.92'6
O.S50S
1Ul729
O.S1J25
o.•JO<)'J
O.'J25I
0.8531
0.S7-11J
0.9115
0.9265
0.855-1
0.8770
0. 962
0.91 'I
0.9279
0. '577
O.S 90
O.S').'0
0.1Jl47
0.1J29_
0.8599
o.s·JO
0 .• 997
U.9162
0.9'06
0.86_)
0..'SJO
0.9015
0.9177
U.9319
1.5 O.<J32 U1.J -15 0.9357 0.9370 0.93S2 0.9'9-1 0.9-106 0.9-11, 0.'J-1_1) 0.9-141
1.6 0.1)-152 0.9-16 0.9-17-1 0.9-IS-I 0.9-11)5 0.9 05 0.1J 15 U.9525 ll.lJ'35 0.9545
1.7 0.955-1 0.')5(H ll.957' 0.9582 0.1)591 0.95')<) U.96US 0.<J616 0.'J625 0.963'
I.S ll.1J6-II ll.'./6-19 O.'J656 U.966-1 0.%71 o.%78 0.%,'6 0.'J6•)' 0.9699 0.9706
1.9 O.'J713 0.1J71'J 0.1J726 0.9732 0.'JTS U.97+1 0.9750 lU756 0.9761 (J.1)767
2.U U.9772 ll.977S o.cmu U.'J7SS 0.'J7'J' 0.971).' 0.'JS03 O.'J·o · U.9'12 0.9817
2.1 0.9.'21 U.9S26 0.%30 0.983-1 0.'JS'8
U.9S-16 O.'JS5ll 0.9.'5-I 0.9S57
2.2 0.'JS61 O.'JS6-I 0.9S6li 11.9871 0.'Jli75 U.9S7S 0.'JSSI U.9.'S-1 U.9'li7 0.9S')(J
2.3 0.9S93 0.'J 096 0.9S9S 0.'J')(JI o.•J9<)-I 0.'Nll6 111..l<JU'J 0.9911 0.9913 0.9')16
1.-l 0.99IS 0.9920 O.'J<J22 0.')925 ll.'J927 ()_')1)_1) ll.'.l'J I 0.9932 0.993-1 ll.9'J36
2.5 ll.'J93li O.'.l'J-10 0.99-11 0.1J1J-13 0.')9-15 ll.1.l'J-16 0.'.l'J-IS 0.99-l'J 0.9951 O.'J<J5_
2.6 0.1)95 0.9')55 0.1J<J56 0.')957 0.9959 U.9'J60 0.9'J61 0.9962 U.9%3 U.9'J6-I
2.7 0.9965 0.'.1')66 0.1.1')67 0.9968 ()_•)%') 0.'J'J70 0.9'J71 11.9972 ll.')973 U.9'J -l
2.li 0.997-1 0.9'J75 O.<J<J76 0.'J1J77 11.9977 U.9'J7S O.'.l'J7'J 0.9979 0.99SO IJ.'J'JSI
2.'J 0.99SI 0.9')S2 0.9'JS2 0.99S U.')9~
0.'.l'JS5 O.'Jt),'5 0.99,'6 0.1J'J,'6
3.0 O.'J9S7 0.99S7 0.'NS7 0.91JSS 0.1J'JSS U.'.l'JS9 11.'NS9 O.'J9S1J 0.9')')() 0.9'J90
3.1 ll.91J90 0.9')91 U1.J<1JI 0.'J'.l'JI 0.'J'J'J2 O.'J'J'J2 O.'.l'J'J2 U.99'J2 0.'J99J 0.'.1')')3
32
ll.999.I 0,9')9.3 0.'.l'J'J-1 ()_(/1)').j
0.1J1J9-l 0.')1)9.J 0.'.1')9-1 0.99')
0.99<)5 ll.'.l'J'J5
3.3 U.9995
3.-1 0.')')')7
0.')')95
0.9'J97
0.9')95
ll.1.l'J97
O.'J9'J6 0.99% O.'J'J'J6 O.'J<J96 0.')')')6
0.99')7 0.9\\J<J7 {)_1)')1)7 0.')')')7
0.99'J7
0.')996
0.')1)97
U.')'JIJ7
0.')')9S

10 Page 10

▲back to top


Queuing Model, Single Server Formulas
J p = Prob [system i~- = I - A
0
empty (idle)
µ
L
= average
number
_
__
2
A__,_,,
q in the queue
µ(µ - .11.)
L = average number = "-'I
in the system
µ- A
W = average time=
Ji.
4 in the queue µ(µ - 2)
W = average time = 1
in the system µ - }"
Note:
}\\, is the arrival rate.
µ is the service rate.