


 |
RMC811S- RESEARCH METHODS FOR NATURAL SCIENCES - 1st Opp - JUNE 2022 |
|
|
1 Page 1 |
▲back to top |
nAmlBIA unlVERSITY
OF SCIEnCE Ano TECHn OLOGY
Faculty of Health, Applied Sciencesand Natural Resources
Department Natural Resources and Agricultural Sciences
QUALIFICATION:Bachelor of Natural Resource Management Honours
QUALIFICATIONCODE: 08BNRH
LEVEL:8
COURSE: Research Methods for Natural Sciences COURSECODE: RMC811S
DATE:June 2022
SESSION:June
DURATION: 3 (three) hours
MARKS: 100
EXAMINER(S)
FIRSTOPPORTUNITYEXAMINATION QUESTIONPAPER
Dr. T. Nzuma (Section A: Scientific Writing)
Dr. M. Mbidzo (Section B: Statistics)
MODERATOR: Dr. M. Mwale
THIS QUESTIONPAPERCONSISTSOF 7 PAGES
(Excluding this front page)
INSTRUCTIONS
1. Answer ALL the questions
2. Write clearly and neatly
3. Number the answers clearly
4. The use of a calculator is permissible
1
|
|
2 Page 2 |
▲back to top |
SECTIONA: SCIENTIFICWRITING
Question 1
[8]
Arrange the following steps into their expected sequence in the general research process
[8]
{ignoring the need for iterative changes).
{a)
Analyse data
{b)
Collect data
{c)
Define topic
{d)
Formulate questions
{e)
Search literature
{f)
Select design and methods
{g)
Write report
{h)
Select units of study
Question 2
[6]
List and explain 3 criteria used for evaluating scientific research
[6]
Question 3
[11)
Develop your own unique research question and answer the following questions.
{a)
Define the topic area:
[2]
In a sentence or two, describe your broad topic or area of research. (Example: "Gender
participation in natural resource management".
{b)
Describe the problem:
[2]
In a sentence or two, describe a problem that could be addressed in your topic or area of
research. {Example: "Participation in natural resource management is often limited
because of complex cultural and psychological factors.")
{c)
Specify the gap and justify the investigation: What is unknown or unresolved? Why [2]
should we bother investigating it? (Example: "We do not know what combination of
cultural and psychological factors is most often associated with participation.")
{d)
Create the research question: Brainstorm 3 (three) questions {1 primary question and 2 [S]
secondary questions) that relate to your research topic/problem/gap.
Note:
Primary - is one main question emerging.
Secondary - sub-questions you need to help you answer the primary question
SUBTOTAL
[25)
2
|
|
3 Page 3 |
▲back to top |
SECTIONB: STATISTICS
Question 1
[10)
Define the following terms. You may provide an example as part of your answer
(a) Inferential statistics
(2)
(b) Inductive research
(2)
(c) Manipulative experiment
(2)
(d) Sampling unit
(2)
(e) Purposive sampling
(2)
Question 2
[17)
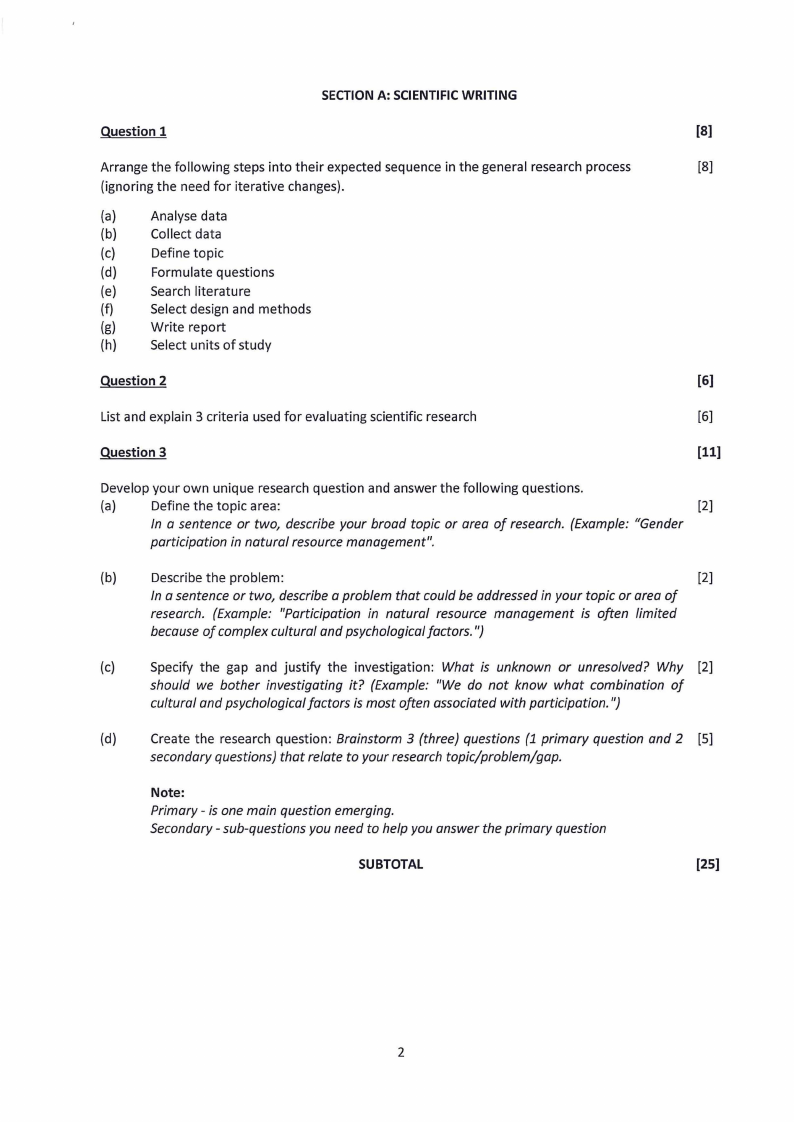
A wildlife ecologist set up an experiment to understand the time taken (in minutes) by springbok
to leave a waterhole in response to a lion sound that is played on two consecutive days.
Assuming that the same springbok individuals come to drink at the waterhole, we hypothesize
that experiencing a fake lion sound on the first day would affect the time springboks took to
leave the waterhole on the second day. Time taken to leave the waterhole is recorded for ten
known springboks and the results are contained in the provided SPSSoutputs. Use these results
to answer the following questions:
(a) What statistical test or analysis is appropriate for this hypothesis?
(1)
(b) Name the two assumptions related to the data of the test mentioned in (a)
(4)
(c) Explain whether the assumptions mentioned in (b) are met or violated and provide
(4)
evidence for your answers.
(d) If your data violated any of the assumptions mentioned in (c), what alternative statistical (1)
test would you use to test the hypothesis that experiencing a fake lion sound on the first
day would affect the time springboks take to leave the waterpoint?
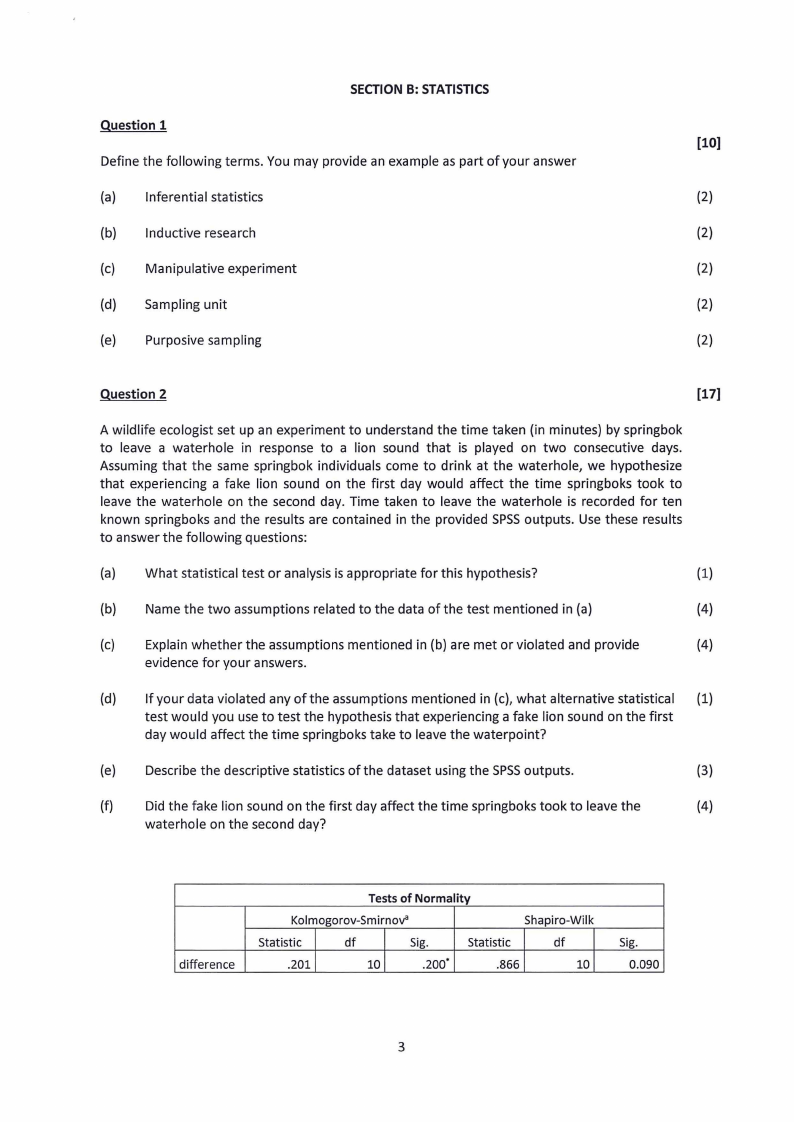
(e) Describe the descriptive statistics of the dataset using the SPSSoutputs.
(3)
(f) Did the fake lion sound on the first day affect the time springboks took to leave the
(4)
waterhole on the second day?
difference
Tests of Normality
Kolmogorov-Smirnov"
Shapiro-Wilk
Statistic
df
Sig.
Statistic
df
.201
10
.200·
.866
10
Sig.
0.090
3
|
|
4 Page 4 |
▲back to top |
8.00
10
0
6.00
4.00
::LOOI------------
.00
difference
Pair 1
Time taken to leave
waterhole on day 2
Time taken in minutes to
leave the watehole on day 1
Statistics
Mean
4.3500
N
Std. Deviation Std. Error Mean
10
2.16551
.68480
2.1900
10
1.11699
.35322
Pair 1 Time taken to
leave
waterhole on
day 2 -Time
taken in
minutes to
leave the
waterhole on
day 1
Test statistics
Paired Differences
95% Confidence
Std. Interval of the
Std.
Error
Difference
Mean Deviation Mean Lower Upper
2.16 2.15572 .68170 .61789 3.70211
Significance
One- Two-
Sided Sided
t df p
p
3.169 9 .006 .011
Question 3
[15]
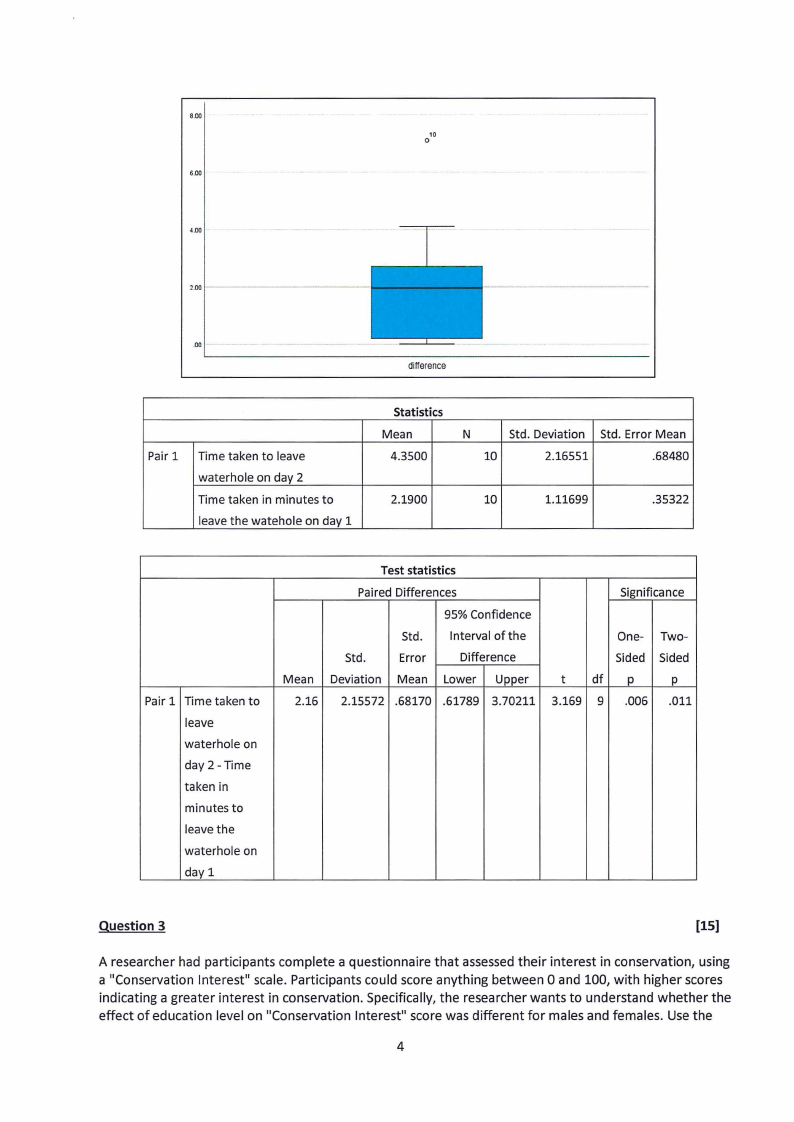
A researcher had participants complete a questionnaire that assessedtheir interest in conservation, using
a "Conservation Interest" scale. Participants could score anything between O and 100, with higher scores
indicating a greater interest in conservation. Specifically, the researcher wants to understand whether the
effect of education level on "Conservation Interest" score was different for males and females. Use the
4
|
|
5 Page 5 |
▲back to top |
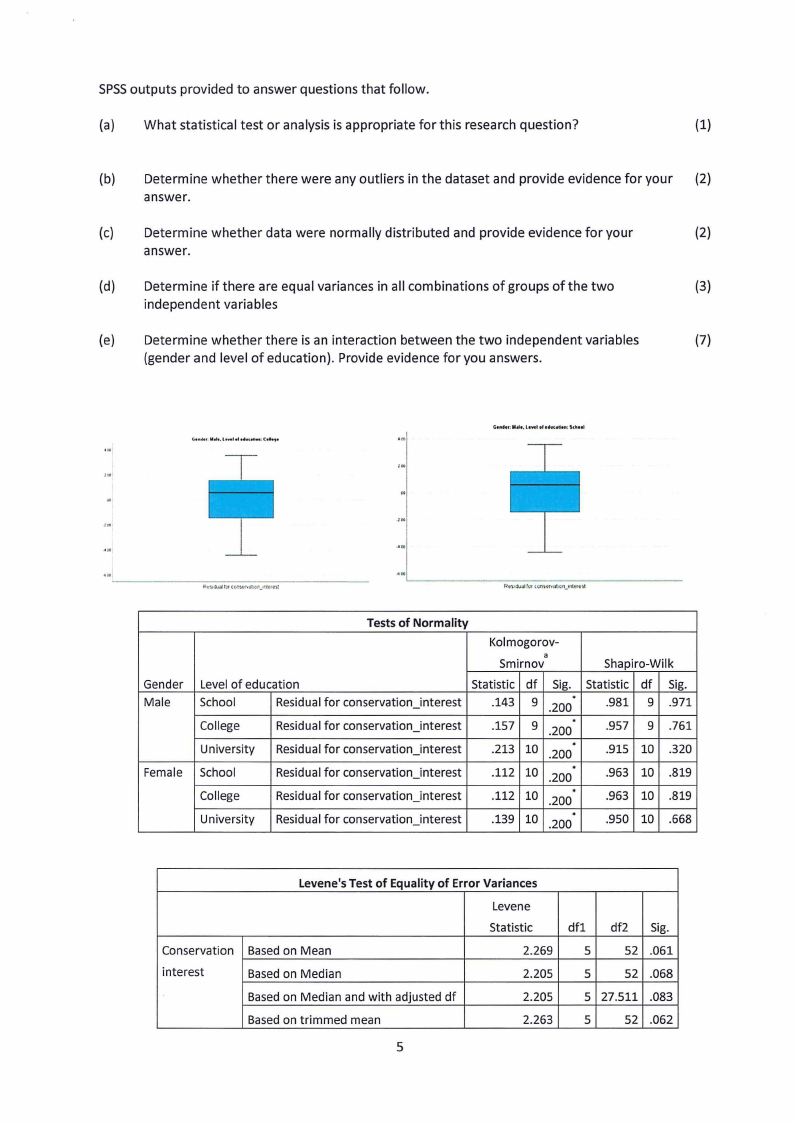
SPSSoutputs provided to answer questions that follow.
(a) What statistical test or analysis is appropriate for this research question?
(1)
(b) Determine whether there were any outliers in the dataset and provide evidence for your (2)
answer.
(c) Determine whether data were normally distributed and provide evidence for your
(2)
answer.
(d) Determine if there are equal variances in all combinations of groups of the two
(3)
independent variables
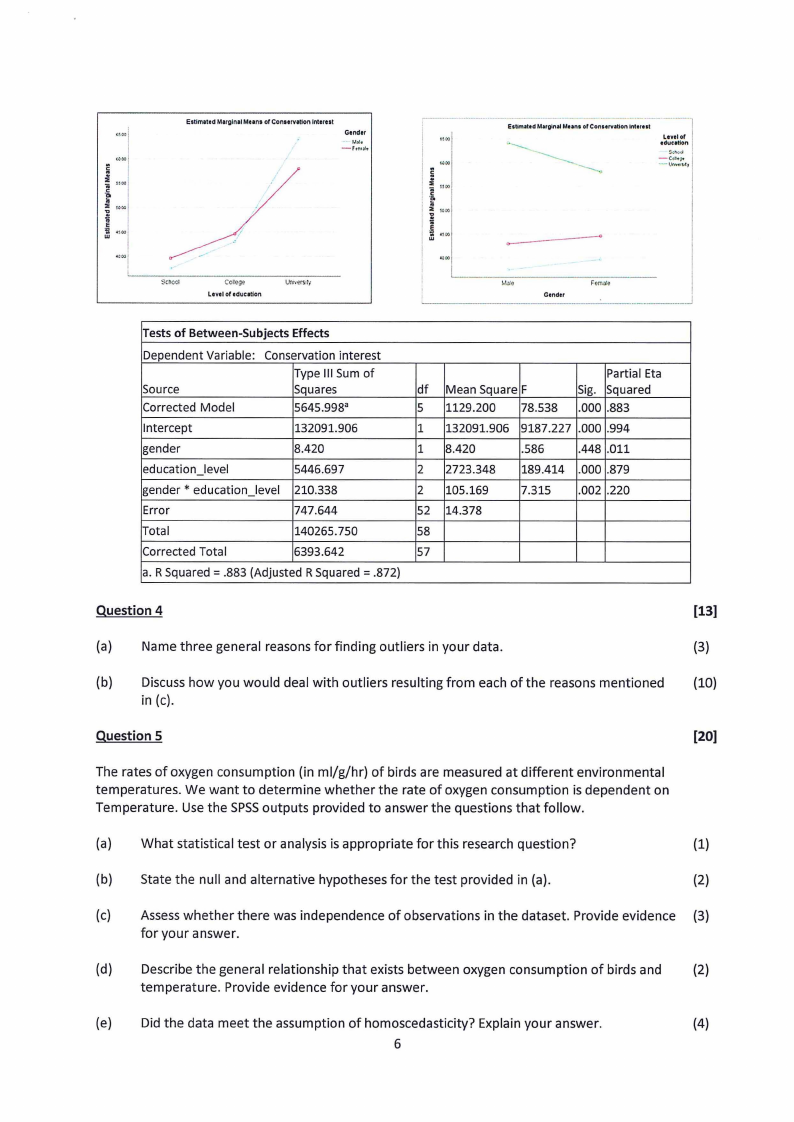
(e) Determine whether there is an interaction between the two independent variables
(7)
(gender and level of education). Provide evidence for you answers.
Gender
Male
Female
Tests of Normality
Kolmogorov-
a
Smirnov
Shapiro-Wilk
Level of education
School
Residual for conservation_interest
College
Residual for conservation_interest
University Residual for conservation_interest
School
Residual for conservation_interest
College
Residual for conservation_interest
Statistic
.143
.157
.213
.112
.112
df
9
9
10
10
10
Sig.
. .200
. .200
. .200
. .200
.. .200
Statistic
.981
.957
.915
.963
.963
df
9
9
10
10
10
Sig.
.971
.761
.320
.819
.819
University Residual for conservation_interest
.139 10 .200
.950 10 .668
Conservation
interest
Levene's Test of Equality of Error Variances
Levene
Statistic
Based on Mean
2.269
Based on Median
2.205
Based on Median and with adjusted df
2.205
Based on trimmed mean
2.263
dfl
df2 Sig.
5
52 .061
5
52 .068
5 27.511 .083
5
52 .062
5
|
|
6 Page 6 |
▲back to top |
E1tim1ttd Marglnal M••n• ofConatrvttion lnttrtat
Gtndtr
E1tim1ttd MarginalMun, or Conurvatlon lnttrut
Ltvtlof
tduc1tion
-co',",.",."'
-\\.k'w.~•u,
Scnoo1
Colcgo
Ltvtl or tduc1tion
Unive111r1
~-------C•_n•_"
___________
_j
Tests of Between-Subjects Effects
Dependent Variable:
Source
Corrected Model
Conservation interest
Type Ill Sum of
Squares
5645.998"
df Mean Square F
5 1129.200 78.538
Partial Eta
Sig. Squared
.000 .883
Intercept
132091.906
1 132091.906 9187.227 .000 .994
gender
8.420
1 8.420
.586
.448 .011
education_level
5446.697
2 2723.348 189.414 .000 .879
gender* education_level 210.338
2 105.169
7.315 .002 .220
Error
747.644
52 14.378
Total
140265.750
58
Corrected Total
6393.642
57
a. R Squared = .883 (Adjusted R Squared = .872)
Question 4
(a) Name three general reasons for finding outliers in your data.
(3)
(b) Discusshow you would deal with outliers resulting from each of the reasons mentioned (10)
in (c).
Question 5
[20]
The rates of oxygen consumption (in ml/g/hr) of birds are measured at different environmental
temperatures. We want to determine whether the rate of oxygen consumption is dependent on
Temperature. Use the SPSSoutputs provided to answer the questions that follow.
(a) What statistical test or analysis is appropriate for this research question?
(1)
(b) State the null and alternative hypotheses for the test provided in (a).
(2)
(c) Assesswhether there was independence of observations in the dataset. Provide evidence (3)
for your answer.
(d) Describe the general relationship that exists between oxygen consumption of birds and (2)
temperature. Provide evidence for your answer.
(e) Did the data meet the assumption of homoscedasticity? Explain your answer.
(4)
6
|
|
7 Page 7 |
▲back to top |
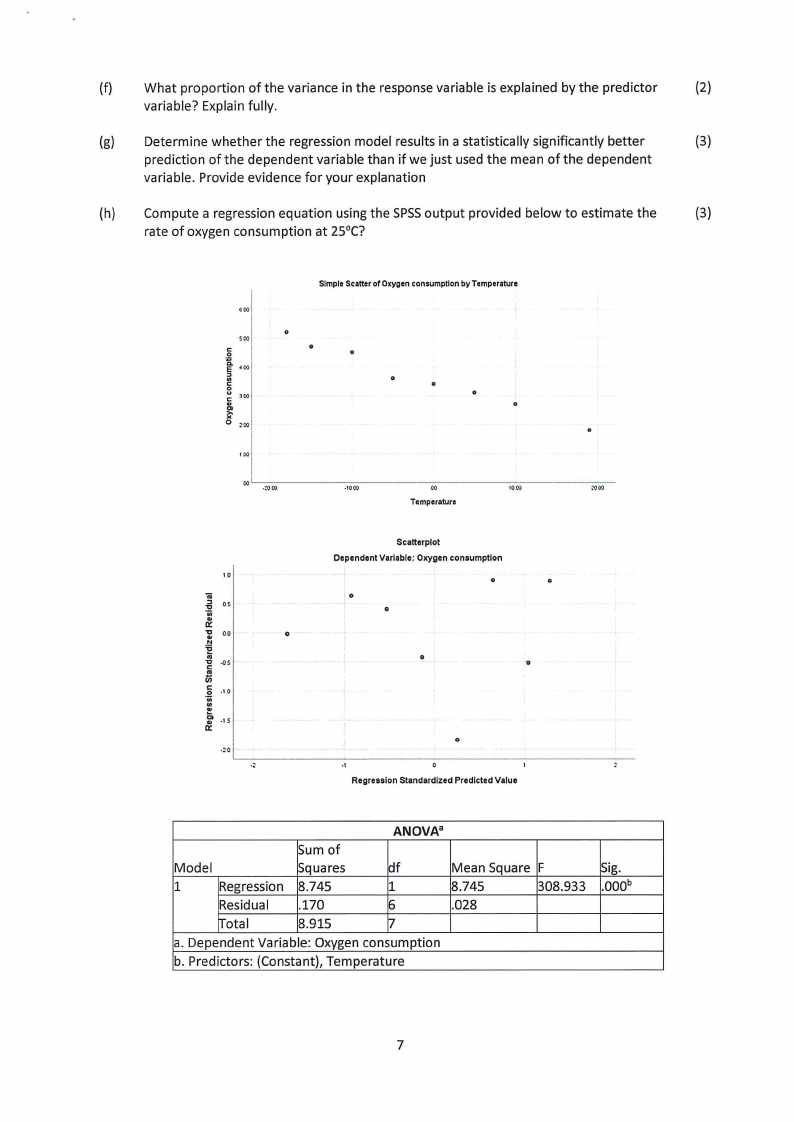
(f) What proportion of the variance in the response variable is explained by the predictor
(2)
variable? Explain fully.
(g) Determine whether the regression model results in a statistically significantly better
(3)
prediction of the dependent variable than if we just used the mean of the dependent
variable. Provide evidence for your explanation
(h) Compute a regression equation using the SPSSoutput provided below to estimate the
(3)
rate of oxygen consumption at 25°C?
Simple Scatteror Oxygenconsumption by Temperature
600
500
C
:0;:,
0
.ioo
iil
C
0
JOO
0 :.oo
0
0
0
1.00
oo'-----------------.1-00-0 -------
00
1000
:-000
Temperature
1.0
..i-i6 o.s
iii
a::
00
N
....-g .Q,S
iii
..§ .,.o
·.;
gt -15
a::
Scatterplot
DependentVariable:Oxygen consumption
0
0
0
0
0
0
0
0
.,
Regression StandardizedPredictedValue
ANOVAa
Model
Sum of
Squares
kH
Mean Square F
1
Regression 8.745
1
8.745
308.933
Residual .170
6
.028
rrotal
8.915
rI
a. Dependent Variable: Oxygen consumption
b. Predictors: (Constant), Temperature
~ig.
.ooob
7
|
|
8 Page 8 |
▲back to top |
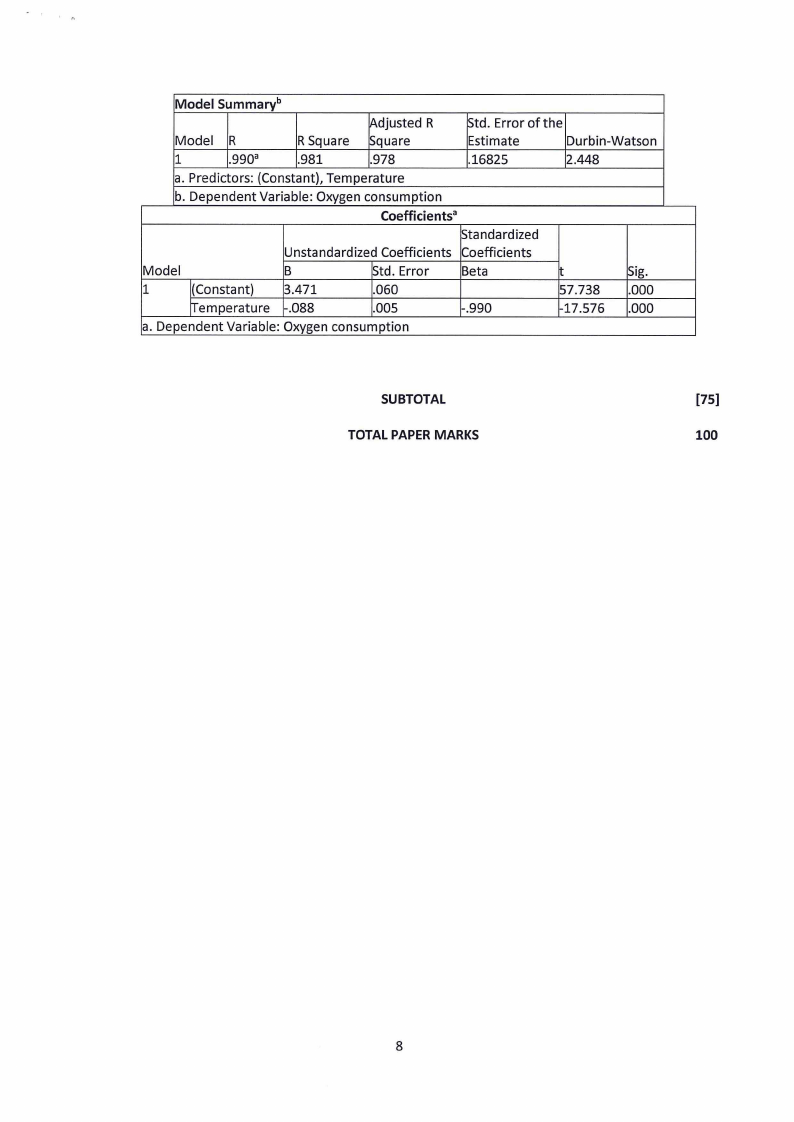
Model Summaryb
Adjusted R !Std. Error of the
Model R
R Square Square
Estimate
Durbin-Watson
1
.990a
.981
.978
.16825
2.448
a. Predictors: (Constant), Temperature
b. Dependent Variable: Oxygen consumption
Coefficientsa
!Standardized
Unstandardized Coefficients Coefficients
Model
B
~td. Error
Beta
!Sig.
1
!(Constant) 3.471
.060
Ifemperature .088
.005
-.990
57.738 .000
17.576 .000
a. Dependent Variable: Oxygen consumption
SUBTOTAL
[75)
TOTAL PAPERMARKS
100
8