


 |
DEM602S - DEMOGRAPHY - 1ST OPP - NOVEMBER 2023 |
|
|
1 Page 1 |
▲back to top |
n Am I BIA u n IVER s ITY
OF SCIEnCEAnOTECHnOLOGY
FacultyofHealthN, atural
ResourceasndApplied
Sciences
Schoool f NaturalandApplied
Sciences
Departmentof Mathematics,
StatisticsandActuarialScience
13JacksonKaujeuaStreet
PrivateBag13388
Windhoek
NAMIBIA
T: •264612072913
E: msas@nust.na
W: www.nust.na
QUALIFICATION: BACHELOR of SCIENCE IN APPLIED MATHEMATICS AND STATISTICS
QUALIFICATIONCODE: 07BSAM
LEVEL:6
COURSE: DEMOGRAPHY
COURSECODE: DEM602S
DATE: NOVEMBER 2023
SESSION: 1
DURATION: 3 HOURS
MARKS: 80
EXAMINER:
MODERATOR:
FIRST OPPORTUNITY: EXAMINATION QUESTION PAPER
MR. ANDREW ROUX
MR. JAN SWARTZ
INSTRUCTIONS
1. Answer all questions on the separate answer sheet.
2. Please write neatly and legibly.
3. Do not use the left side margin of the exam paper. This must be allowed for the
examiner.
4. No books, notes and other additional aids are allowed.
5. Mark all answers clearly with their respective question numbers.
PERMISSIBLE MATERIAL
1. Non-Programmable Calculator
This paper consists of 3 pages including this front page
|
|
2 Page 2 |
▲back to top |
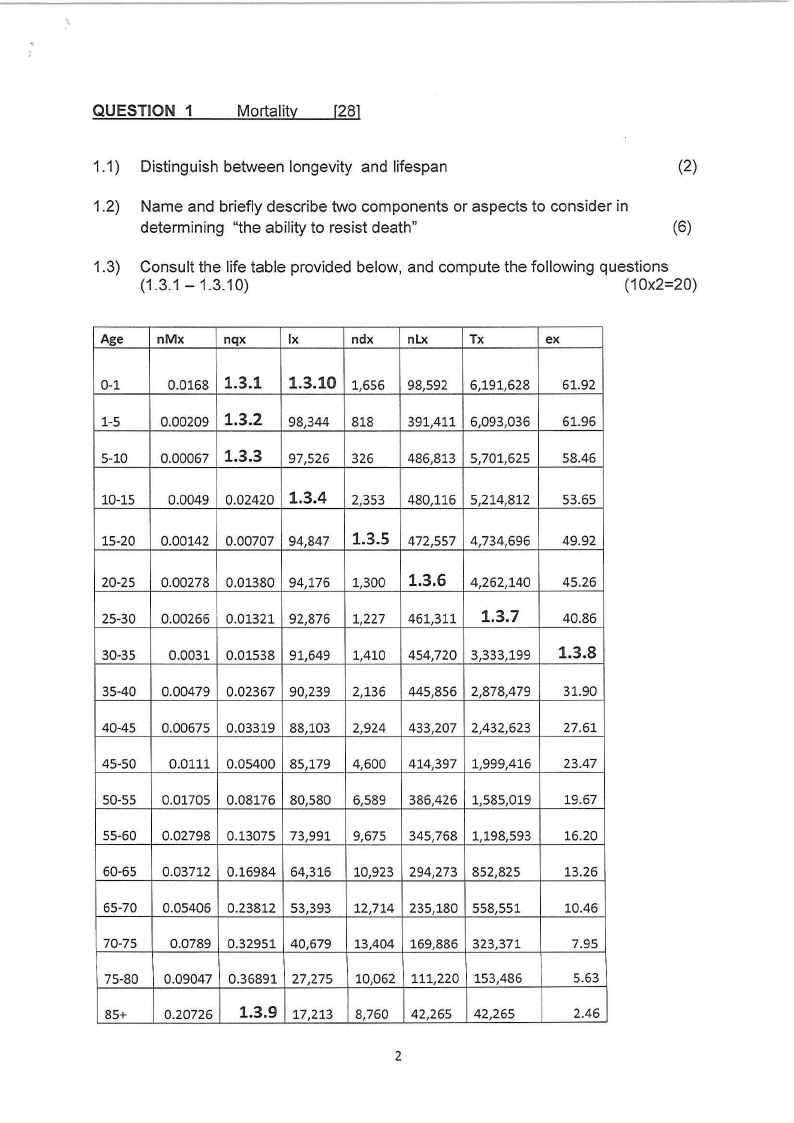
QUESTION 1
Mortality [28]
1.1) Distinguish between longevity and lifespan
(2)
1.2) Name and briefly describe two components or aspects to consider in
determining "the ability to resist death"
(6)
1.3) Consult the life table provided below, and compute the following questions
(1.3.1 - 1.3.10)
(1 0x2=20)
Age nMx nqx
Ix
ndx nlx
Tx
ex
0-1
0.0168 1.3.1 1.3.10 1,656 98,592 6,191,628
1-5
0.00209 1.3.2 98,344 818
391,411 6,093,036
5-10 0.00067 1.3.3 97,526 326 486,813 5,701,625
10-15 0.0049 0.02420 1.3.4 2,353 480,116 5,214,812
15-20 0.00142 0.00707 94,847 1.3.5 472,557 4,734,696
20-25
25-30
0.00278 0.01380 94,176
0.00266 0.01321 92,876
1,300
1,227
1.3.6 4,262,140
461,311 1.3.7
30-35 0.0031 0.01538 91,649 1,410 454,720 3,333,199
35-40 0.00479 0.02367 90,239 2,136 445,856 2,878,479
40-45 0.00675 0.03319 88,103 2,924 433,207 2,432,623
45-50 0.0111 0.05400 85,179 4,600 414,397 1,999,416
50-55 0.01705 0.08176 80,580 6,589 386,426 1,585,019
55-60 0.02798 0.13075 73,991 9,675 345,768 1,198,593
60-65 0.03712 0.16984 64,316 10,923 294,273 852,825
65-70 0.05406 0.23812 53,393 12,714 235,180 558,551
70-75 0.0789 0.32951 40,679 13,404 169,886 323,371
75-80
85+
0.09047 0.36891 27,275
0.20726 1.3.9 17,213
10,062 111,220 153,486
8,760 42,265 42,265
61.92
61.96
58.46
53.65
49.92
45.26
40.86
1.3.8
31.90
27.61
23.47
19.67
16.20
13.26
10.46
7.95
5.63
2.46
2
|
|
3 Page 3 |
▲back to top |
QUESTION 2 : Fertility & Nuptiality [32]
2.1) Distinguish between the following:
2.1.1) Gross reproduction rate and net reproduction rate
(4)
2.1.2) The direct method and the indirect method for calculating the age-
standardised birth rate
(4)
2.1.3) General Marriage rate and the total marriage rate.
(4)
2.2) The total number of marriages for 2022 in the Khomas Region was 11 762
with a midyear population size 652 460 as well as the midyear population of
marriageable persons are 205 684. Use c = 1 000.
2.2.1) Calculate and interpret the crude marriage rate for this region
(5)
2.2.2) Calculate and interpret the general marriage rate for this region (5)
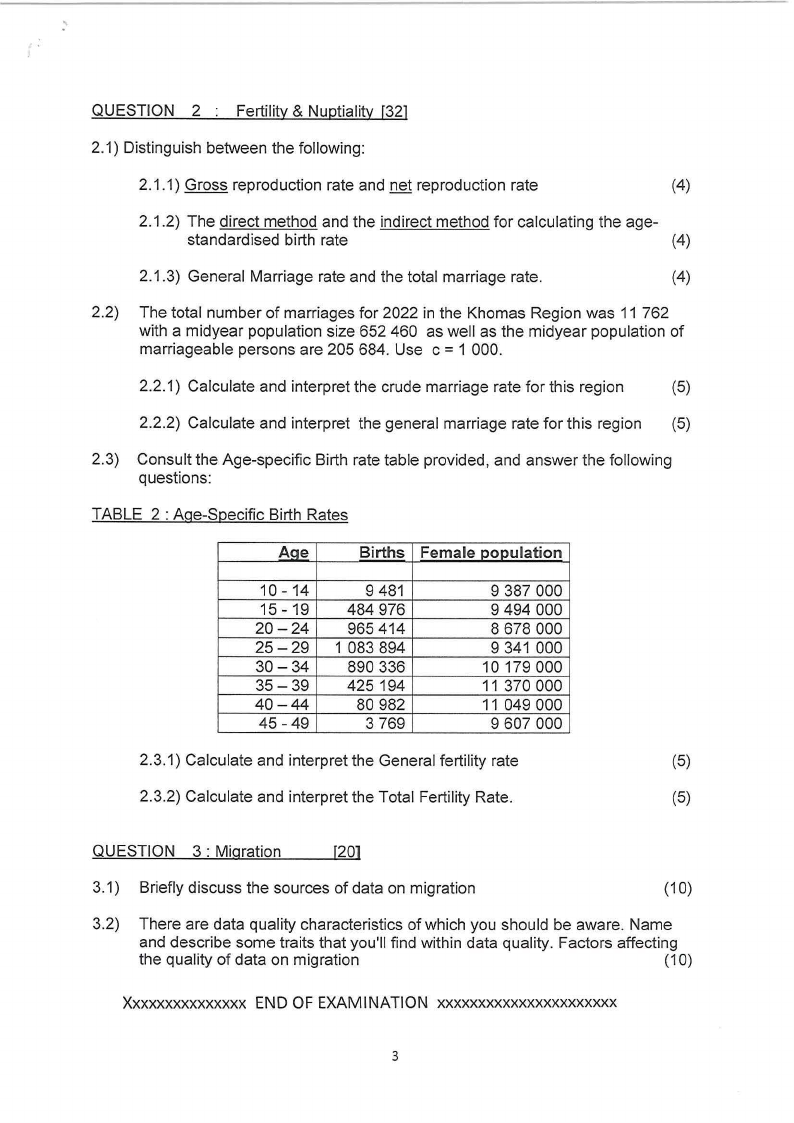
2.3) Consult the Age-specific Birth rate table provided, and answer the following
questions:
TABLE 2 : Age-Specific Birth Rates
Aae
Births Female population
10 - 14
15 - 19
20-24
25-29
30-34
35-39
40-44
45 -49
9 481
484 976
965 414
1 083 894
890 336
425 194
80 982
3 769
9 387 000
9 494 000
8 678 000
9 341 000
10 179 000
11 370 000
11 049 000
9 607 000
2.3.1) Calculate and interpret the General fertility rate
(5)
2.3.2) Calculate and interpret the Total Fertility Rate.
(5)
QUESTION 3 : Migration
[201
3.1) Briefly discuss the sources of data on migration
(10)
3.2) There are data quality characteristics of which you should be aware. Name
and describe some traits that you'll find within data quality. Factors affecting
the quality of data on migration
(10)
Xxxxxxxxxxxxxxx END OF EXAMINATION xxxxxxxxxxxxxxxxxxxxxx
3