


 |
AME820S-ADVANCED MACROECONOMICS-2ND OPP-JAN 2025 |
|
|
1 Page 1 |
▲back to top |
n Am I BI A u n IVE Rs ITY
OF SCIEnCE Ano TECHn OLOGY
FACULTY OF COMMERCE, HUMAN SCIENCES AND EDUCATION
DEPARTMENT OF ECONOMICS, ACCOUNTING AND FINANCE
QUALIFICATION: BACHELOR OF ECONOMICS HONOURS DEGREE
QUALIFICATION CODE:
08HECO
COURSE CODE:
AME820S
LEVEL:
8
COURSE NAME: ADV AN CED
MACROECONOMICS
SESSION:
JAN 2025 PAPER:
THEORY
DURATION:
HOURS
3
MARKS:
100
SECOND OPPORTUNITY EXAMINATION QUESTION PAPER
EXAMINER (S) Prof. T. Sunde
MODERATOR: Dr Reinhold Kamati
INSTRUCTIONS
1. Answer ALL the questions.
2. Write clearly and neatly.
3. Number the answers.
PERMISSIBLE MATERIALS
I.Ruler
2.Calculator
THIS QUESTION PAPER CONSISTS OF 3 PAGES INCLUDING THE COVER
PAGE.
1
|
|
2 Page 2 |
▲back to top |
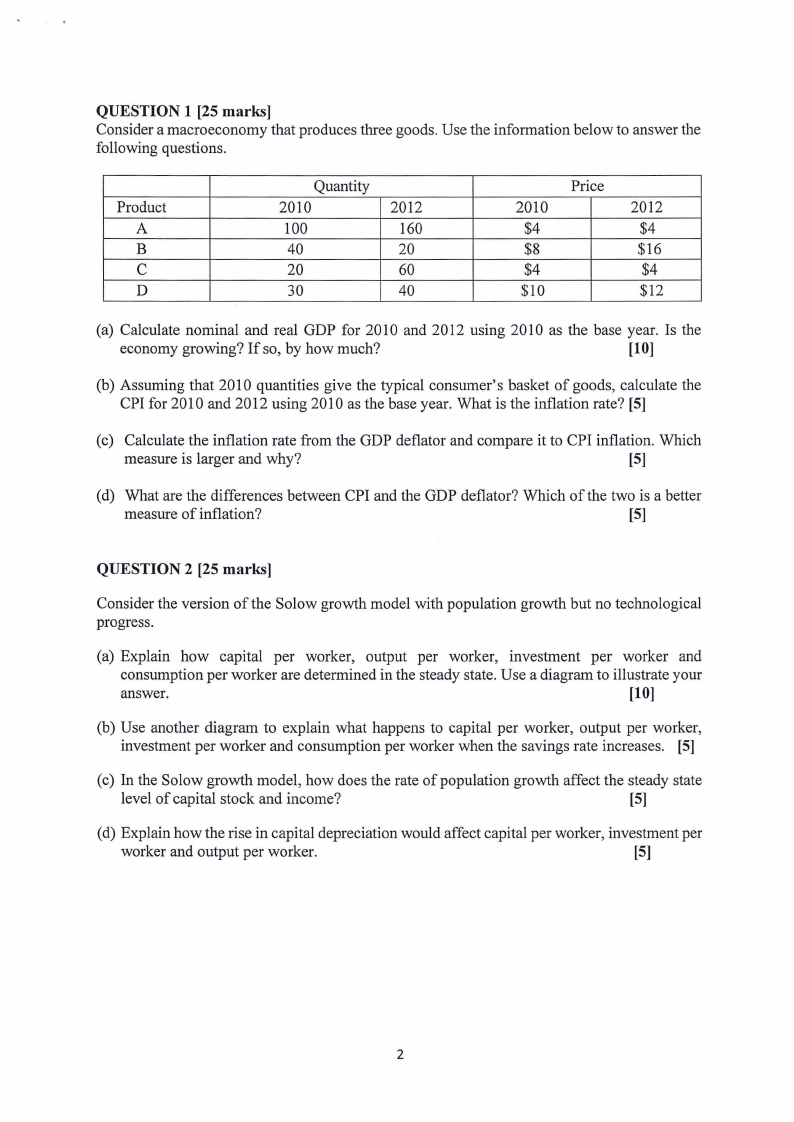
QUESTION 1 [25 marks]
Consider a macroeconomy that produces three goods. Use the information below to answer the
following questions.
Product
A
B
C
D
Quantity
2010
100
40
20
30
2012
160
20
60
40
2010
$4
$8
$4
$10
Price
2012
$4
$16
$4
$12
(a) Calculate nominal and real GDP for 2010 and 2012 using 2010 as the base year. Is the
economy growing? If so, by how much?
[10]
(b) Assuming that 2010 quantities give the typical consumer's basket of goods, calculate the
CPI for 2010 and 2012 using 2010 as the base year. What is the inflation rate? [5]
(c) Calculate the inflation rate from the GDP deflator and compare it to CPI inflation. Which
measure is larger and why?
[5]
(d) What are the differences between CPI and the GDP deflator? Which of the two is a better
measure of inflation?
[5]
QUESTION 2 [25 marks]
Consider the version of the Solow growth model with population growth but no technological
progress.
(a) Explain how capital per worker, output per worker, investment per worker and
consumption per worker are determined in the steady state. Use a diagram to illustrate your
answer.
[10]
(b) Use another diagram to explain what happens to capital per worker, output per worker,
investment per worker and consumption per worker when the savings rate increases. [5]
(c) In the Solow growth model, how does the rate of population growth affect the steady state
level of capital stock and income?
[5]
(d) Explain how the rise in capital depreciation would affect capital per worker, investment per
worker and output per worker.
[5]
2
|
|
3 Page 3 |
▲back to top |
QUESTION 3 [25 marks]
a) This question is based on the AD-SRAS-LRAS model of the economy. Assume that the
SRAS curve is upward-sloping.
(i) Assume that political instability in country X (a neighbour of Namibia) and the
emergence of a terrorist group in Southern Africa have caused households and
businesses to be uncertain about the future of the Namibian economy. In response,
households and businesses are delaying large purchases/projects until the situation is
more under control. Use the AD-SRAS-LRAS diagram to discuss the predicted short-
run and long-run impacts on the price level, real GDP and unemployment.
[10]
(ii) What policy options are available to the Bank of Namibia in the short and long run?
Use the AD-SRAS-LRAS diagram to support your discussion. [5]
b) Suppose Namibia is a small, open economy, and some foreign countries begin to subsidize
investment by instituting an investment tax credit.
[10]
(i) What happens to the world investment demand as a function of the world interest
rate?
(ii) What happens to the world interest rate?
(iii) What happens to investment in Namibia?
(iv) What happens to Namibia's trade balance?
(v) What happens to the nominal and real exchange rates in Namibia?
QUESTION 4 [25 marks]
(a) Discuss why it is easier for the Central Bank to deal with demand than supply shocks.
[10]
(b) The Open Economy in the Short Run: the Mundell-Fleming Model. Answer the following
sub-questions:
(i) Draw a graph describing a small open economy with a fixed exchange rate. In your
graph, show the fixed exchange rate, the IS* curve, and the equilibrium income, and
label both axes correctly (do not draw the LM* curve at this point).
[5]
(ii) Suppose in this economy with a fixed exchange rate, the central bank sets the money
supply at greater than the money demand. Add an LM* curve to your graph that reflects
this monetary policy. Discuss the process through which the money market returns to
equilibrium.
[5]
(iii) Draw another graph describing a small open economy with floating exchange rate. In
your graph, show the IS* curve, the LM* curve, the equilibrium exchange rate and
income, and label both axes correctly.
[5]
3