


 |
SMS701S - SURVEY METHODS AND SAMPLING TECHNIQUES - 2ND OPP - JULY 2022 |
|
|
1 Page 1 |
▲back to top |
NAMIBIA UNIVERSITY
OF SCIENCE AND TECHNOLOGY
FACULTY OF HEALTH AND APPLIED SCIENCES
DEPARTMENT OF MATHEMATICS AND STATISTICS
QUALIFICATION: BACHELOR OF SCIENCES APPLIED MATHEMATICS AND STATISTICS
QUALIFICATION CODE: 07BAMS
LEVEL: 7
COURSE CODE: SMS701S
COURSE NAME: SURVEY METHODS AND
SAMPLING TECHNIQUES
SESSION: JULY 2022
PAPER: THEORY
DURATION: 3 HOURS
MARKS: 100
SUPPLEMENTARY/SECOND OPPORTUNITY EXAMINATION QUESTION PAPER
EXAMINER
Mr. J. J. SWARTZ
MODERATOR:
Dr. 1. NEEMA
INSTRUCTIONS
1. Answer ALL the questions in the booklet provided.
2. Show clearly all the steps used in the calculations.
3. All written work must be done in blue or black ink and sketches must
be done in pencil.
PERMISSIBLE MATERIALS
1. Non-programmable calculator without a cover.
ATTACHMENTS
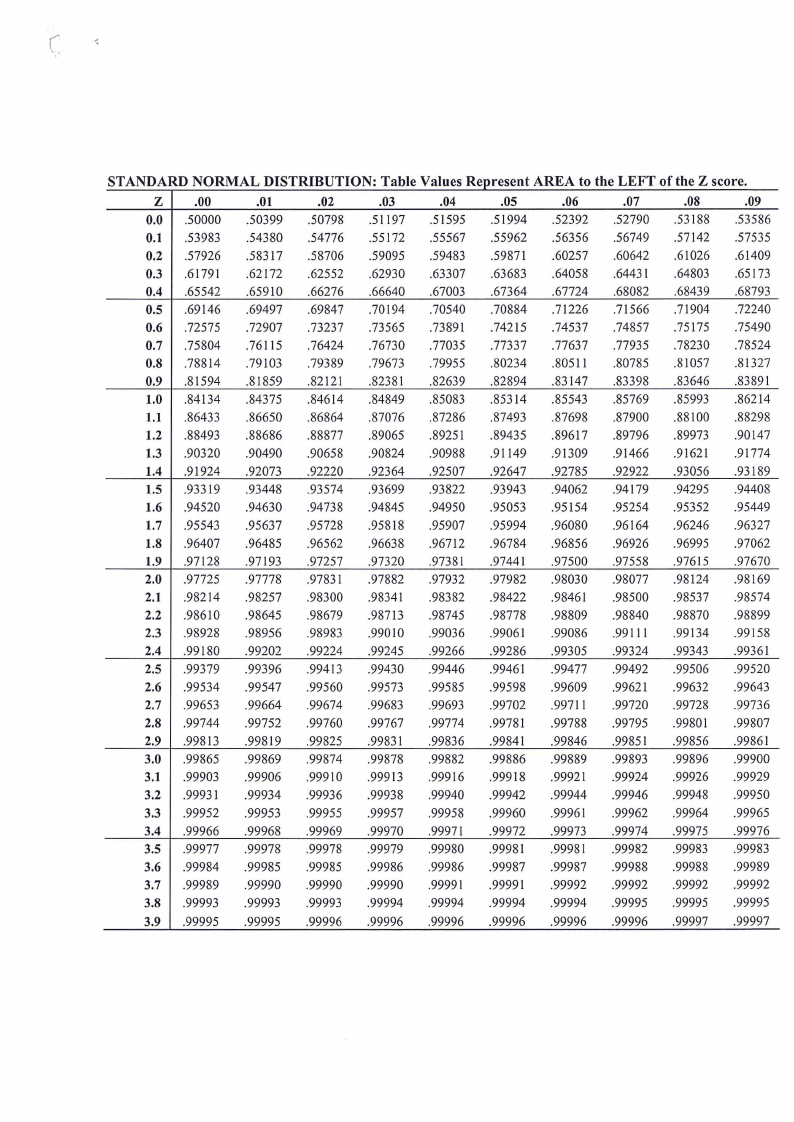
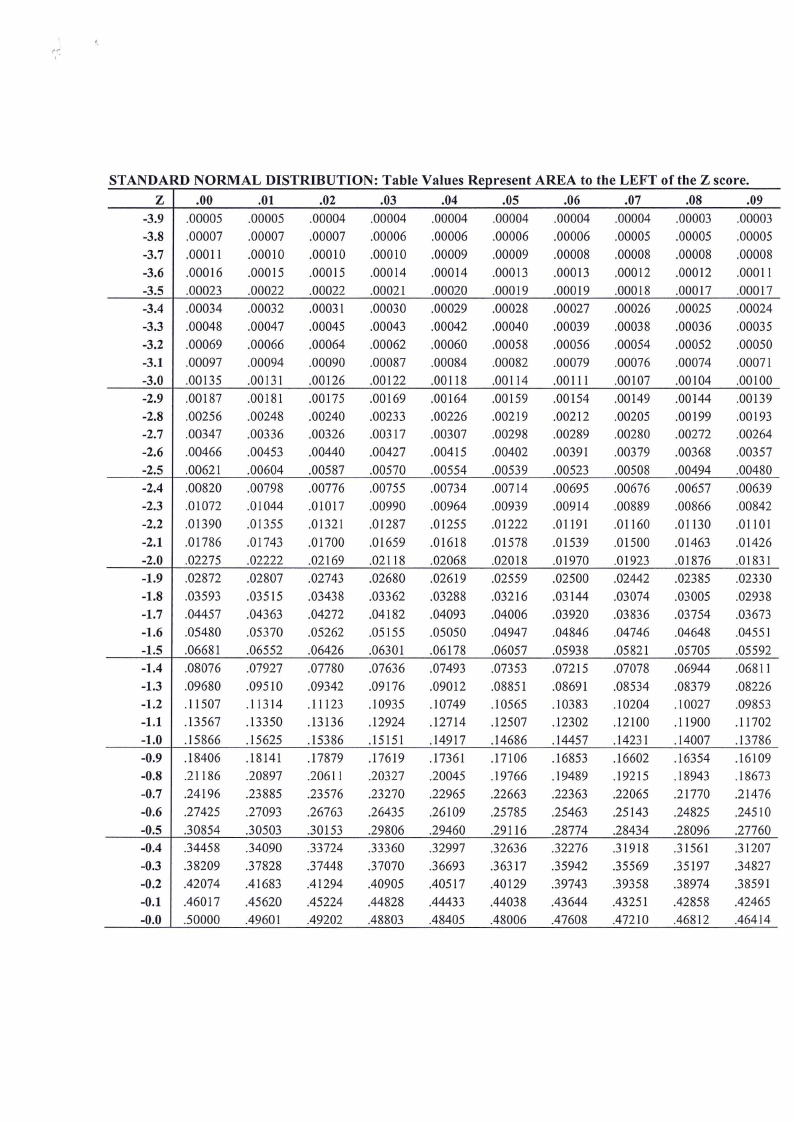
1. Normal distribution table
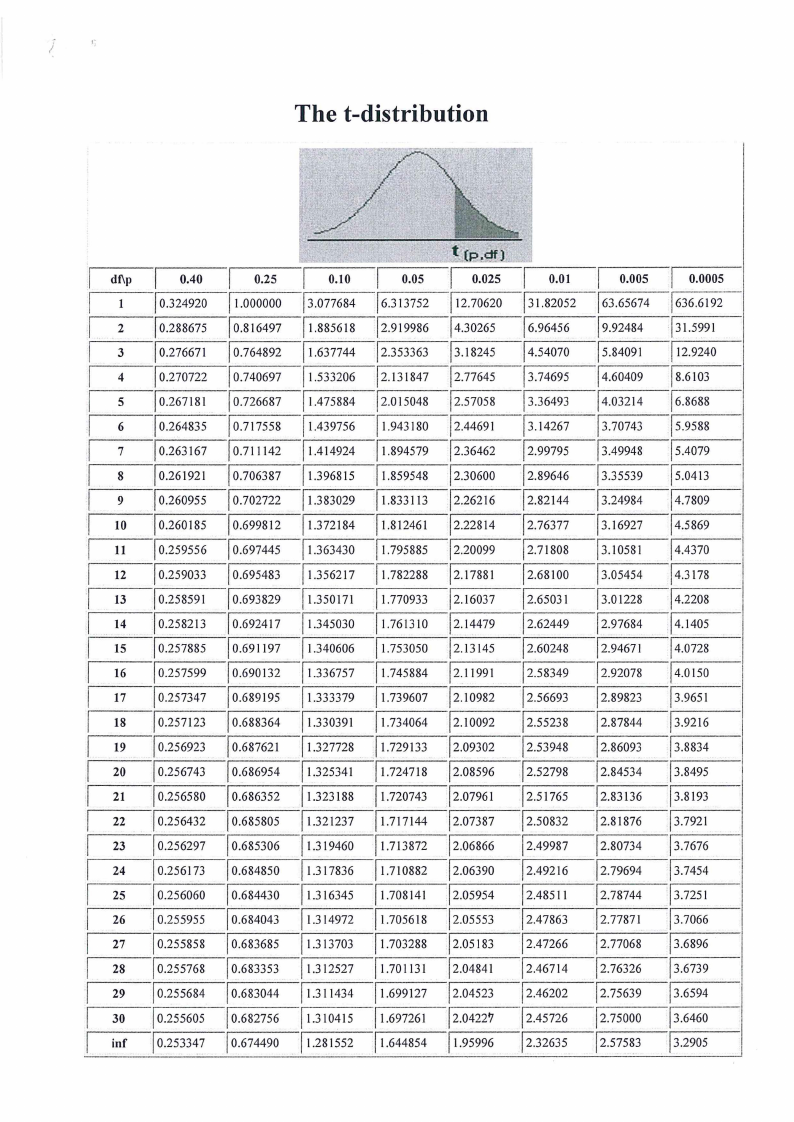
2. T-table
THIS QUESTION PAPER CONSISTS OF 5 PAGES (Including this front page)
1
|
|
2 Page 2 |
▲back to top |
QUESTION 1 [25 MARKS]
1.1 Define the term survey methodology in your own words.
[3]
1.2 The Namibia Statistics Agency (NSA) is mandated to conduct annual Labour Force
Surveys (NLFS). Describe the basic characteristics of the NLFS in terms of the following:
1.2.1 one of the main objectives of the NLFS
1.2.2 the target population they try to describe
1.2.3 the sources from which they draw samples
1.2.4 the design of the way they sample people
1.2.5 the use of interviewers
1.2.6 the mode of data collection
1.2.7 the use of computers in the collection of responses
[7]
1.3 Define the following terms:
1.3.1 A random variable
[1]
1.3.2 Sampling unit
[1]
1.3.3 Population parameter
(1)
1.3.4 Random Sample
[1]
1.3.5 Statistical modeling
[1]
1.4 Provide a diagrammatically representation of a survey lifecycle from a quality
perspective.
[10]
QUESTION 2 [25 MARKS]
2.1 Provide and explain four basic criteria for the acceptability of asampling method? [8]
2.2 Write at least 4 properties of the normal probability distribution
[4]
2
|
|
3 Page 3 |
▲back to top |
2.3 Write a short note on the importance of the normal distribution in sampling theory [3]
2.4 The Ministry of Health and Social Services wants to estimate the rate of incidence of
respiratory disorders among the middle aged male and female smokers in Namibia. How
large a sample should be taken to be 95% confident that the error of estimation of the
proportion of the population with such disorders does not exceed 0.05? The true value of p
is expected to be near 0.20.
[4]
2.5 To estimate the percentage of rats that carries a viral infection which produces a certain
sickness, 128 rats are examined and 72 of them are found to be infected. Calculate the
standard error of the estimated proportion and compute a 95% confidence interval for the
population proportion?
[6]
QUESTION 3 [25 MARKS]
3.1 Distinguish between probability and non-probability sampling in terms of approaches to
sampling.
[4]
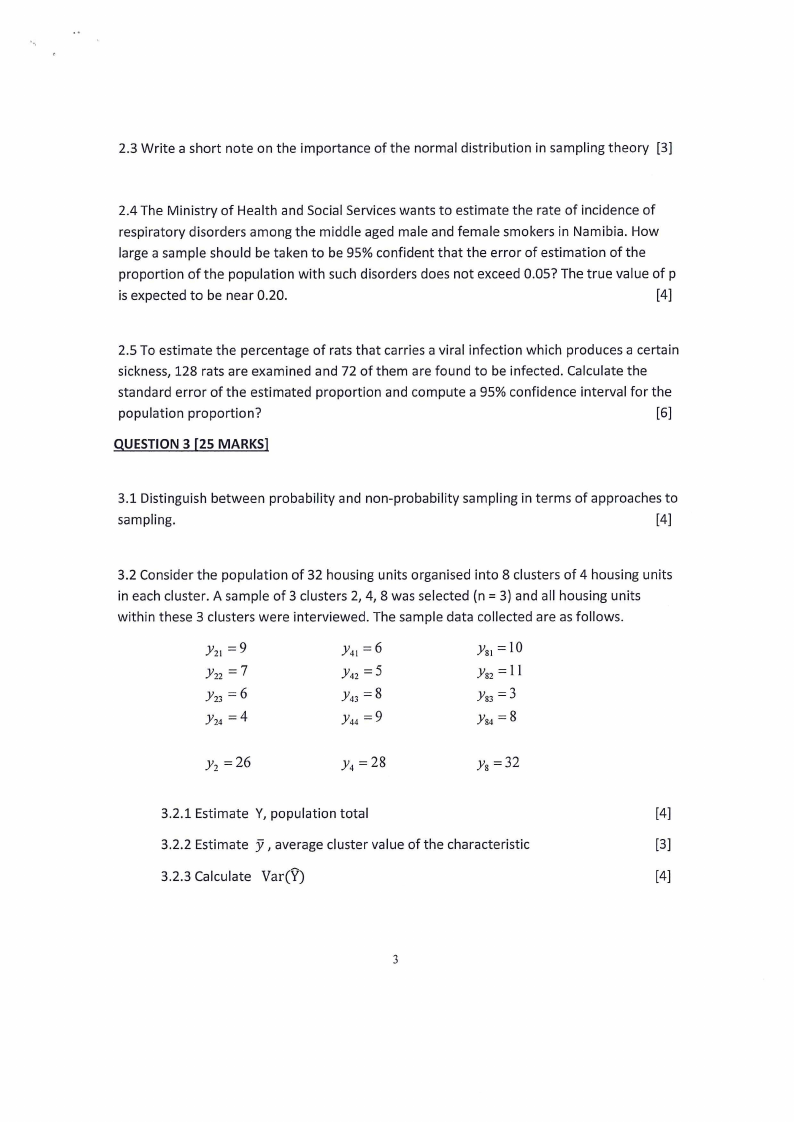
3.2 Consider the population of 32 housing units organised into 8 clusters of 4 housing units
in each cluster. A sample of 3 clusters 2, 4, 8 was selected (n = 3) and all housing units
within these 3 clusters were interviewed. The sample data collected are as follows.
Yn, =9
Yn =7
Vr3 = 6
Voq =4
Ya = 6
Vo =5
Vag =8
Vay =9
Vs, =10
Yeo =11
Ves =3
Veq =8
y, =26
Vy, = 28
Ve= g32
3.2.1 Estimate Y, population total
[4]
3.2.2 Estimate y , average cluster value of the characteristic
[3]
3.2.3 Calculate Var(Y)
[4]
|
|
4 Page 4 |
▲back to top |
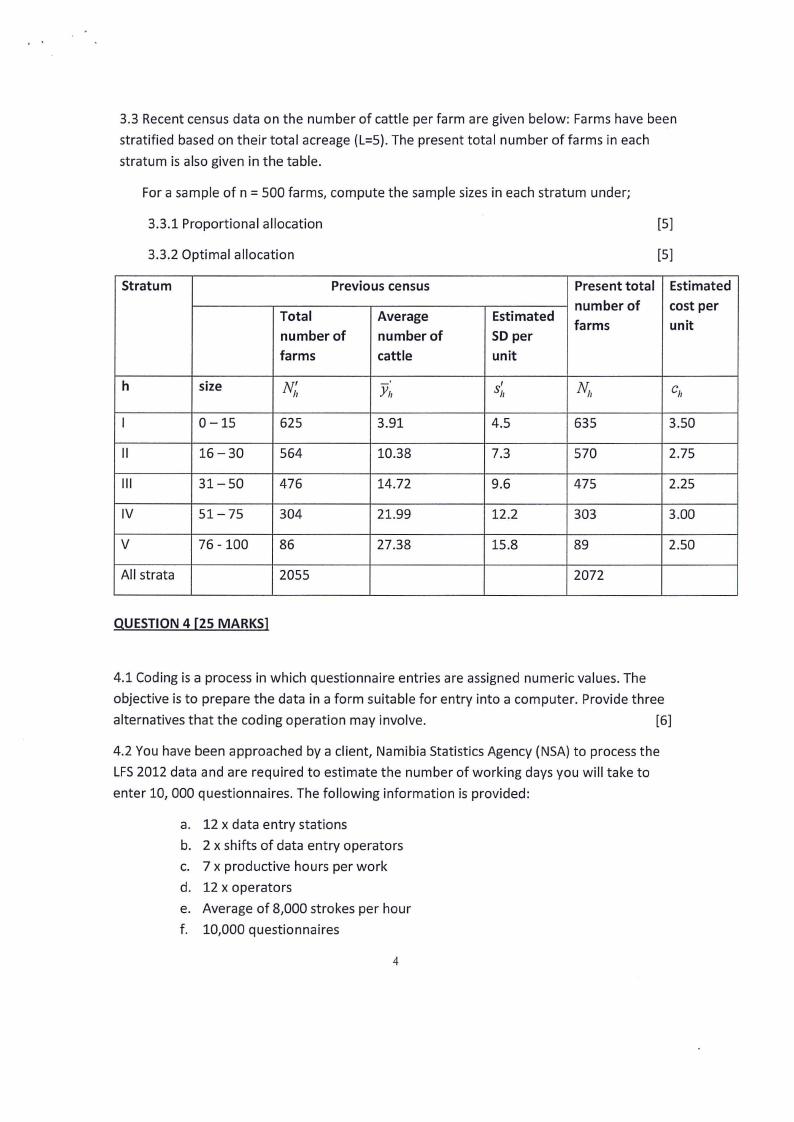
3.3 Recent census data on the number of cattle per farm are given below: Farms have been
stratified based on their total acreage (L=5). The present total number of farms in each
stratum is also given in the table.
For a sample of n= 500 farms, compute the sample sizes in each stratum under;
3.3.1 Proportional allocation
[5]
3.3.2 Optimal allocation
[5]
Stratum
Previous census
Total
number of
farms
Average
number of
cattle
Esti- mated
SD per
unit
Present total | Estimated
number of
farms
cuonsitt. per
h
|
II
Il
IV
V
All strata
size
0-15
16-30
31-50
51-75
76 - 100
N,
625
564
476
304
86
2055
y,
3.91
10.38
14.72
21.99
27.38
Sh
N,
C;,
4.5
635
3.50
7.3
570
2.75
9.6
475
2.25
12.2
303
3.00
15.8
89
2.50
2072
QUESTION 4 [25 MARKS]
4.1 Coding is a process in which questionnaire entries are assigned numeric values. The
objective is to prepare the data in a form suitable for entry into a computer. Provide three
alternatives that the coding operation may involve.
[6]
4.2 You have been approached by a client, Namibia Statistics Agency (NSA) to process the
LFS 2012 data and are required to estimate the number of working days you will take to
enter 10, 000 questionnaires. The following information is provided:
12 x data entry stations
2 x shifts of data entry operators
7 X productive hours per work
12 x operators
Average of 8,000 strokes per hour
10,000 questionnaires
|
|
5 Page 5 |
▲back to top |
g. 2,500 strokes per questionnaires
h. 100 percent verification
[9]
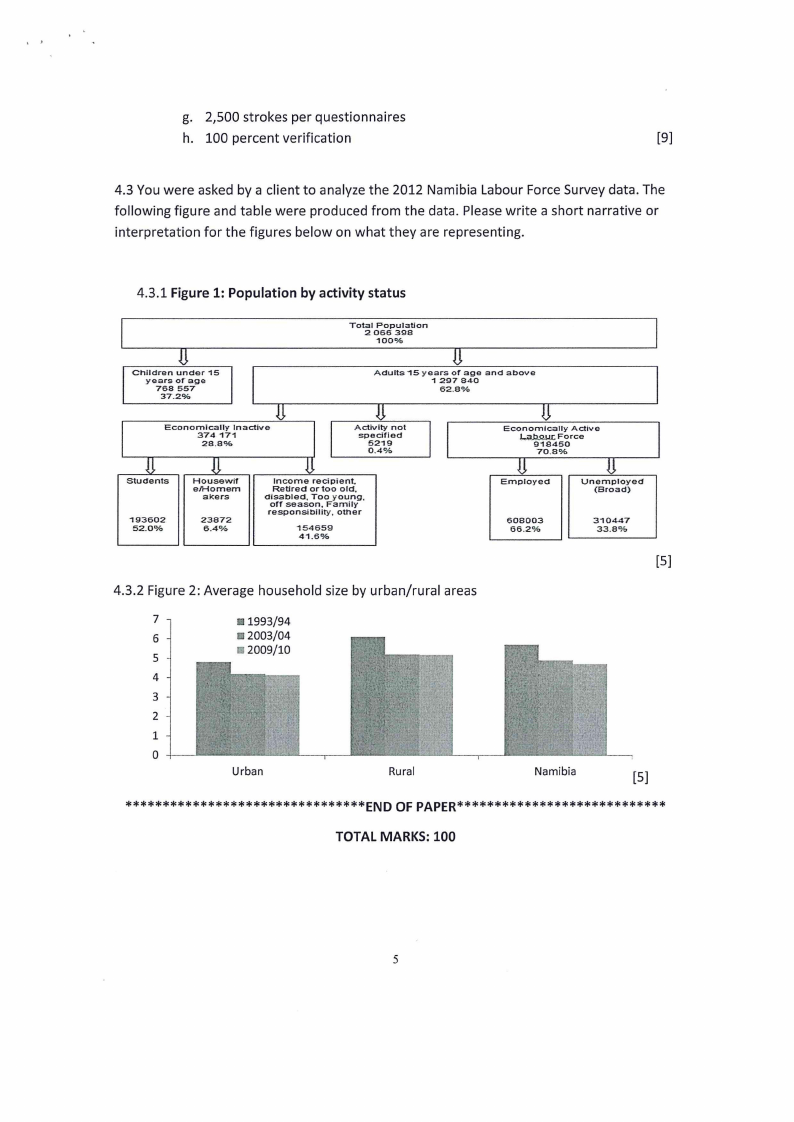
4.3 You were asked by a client to analyze the 2012 Namibia Labour Force Survey data. The
following figure and table were produced from the data. Please write a short narrative or
interpretation for the figures below on what they are representing.
4.3.1 Figure 1: Population by activity status
Tota2l P0o6p6 u3l: ation
100%
Children under 15
years of age
76387.2S%S7
Adults 15 years of age and above
1297 840
62.8%
Economically Inactive
374 171
28.8%
Activity not
specified
50.241%9
Economically Active
Labour Force
97108.485%0
Students
193602
52.0%
Housewit
e/Homem
akers
23872
6.4%
Income recipient,
Retired or too old,
disabled, Too young,
off season, Family
responsibility, other
14514.665% 9
Employed
608003
66.2%
4.3.2 Figure 2: Average household size by urban/rural areas
m 1993/94
m 2003/04
tm 2009/10
Unemployed
(Broad)
310447
33.8%
[5]
Urban
Rural
Namibia
[5]
HERRERA RE ARK KK EK AK KKK KAKA KEE NIP) OF PAPER*® #4 ## HF ERE
TOTAL MARKS: 100
EKA AK ARKH A KAKA K
|
|
6 Page 6 |
▲back to top |
STANDARD NORMAL DISTRIBUTION: Table
Z
00
01
.02
03
0.0 | .50000
50399
50798
1197
0.1 | .53983
54380
54776
55172
0.2 | .57926
58317
58706
59095
0.3 | .61791
.62172
.62552
.62930
0.4 | .65542
-65910
.66276
.66640
0.5 | .69146
69497
.69847
.70194
0.6 | .72575
.72907
73237
.73565
0.7 | .75804
.76115
.76424
.76730
0.8 | .78814
.79103
.79389
.79673
0.9 | .81594
81859
82121
82381
1.0 | .84134
84375
84614
84849
1.1 | .86433
86650
86864
.87076
1.2 | .88493
88686
88877
89065
1.3 | .90320
.90490
90658
90824
1.4 | .91924
.92073
92220
92364
1.5 | 93319
93448
93574
.93699
1.6 | .94520
.94630
.94738
94845
1.7 | .95543
95637
95728
95818
1.8 | .96407
.96485
96562
.96638
1.9 | .97128
97193
97257
97320
2.0 | .97725
.97778
97831
97882
2.1 | .98214
98257
.98300
98341
2.2 | .98610
98645
.98679
98713
2.3 | .98928
98956
98983
99010
2.4 | .99180
99202
99224
99245
2.5 | .99379
99396
99413
99430
2.6 | .99534
99547
99560
99573
2.7 | .99653
99664
99674
99683
2.8 | .99744
99752
.99760
99767
2.9 | .99813
99819
99825
99831
3.0 | .99865
99869
99874
99878
3.1 | .99903
.99906
99910
99913
3.2 | .99931
99934
.99936
99938
3.3 | .99952
99953
99955
99957
3.4 | .99966
99968
99969
99970
3.5 | .99977
99978
99978
99979
3.6 | .99984
99985
99985
99986
3.7 | .99989
99990
99990
99990
3.8 | .99993
99993
99993
99994
3.9 | .99995
99995
99996
99996
Values Represent
.04
05
51595
51994
595567
55962
59483
59871
.63307
.63683
.67003
.67364
.70540
.70884
73891
74215
.77035
17337
«19955
80234
82639
82894
85083
85314
87286
87493
89251
89435
90988
91149
92507
92647
93822
93943
94950
95053
95907
95994
96712
.96784
97381
97441
97932
97982
98382
98422
98745
98778
.99036
99061
99266
99286
99446
99461
99585
99598
99693
99702
99774
99781
99836
99841
99882
99886
99916
99918
99940
99942
99958
99960
99971
99972
99980
99981
99986
99987
99991
99991
99994
99994
99996
.99996
AREA to the LEFT
06
.07
52392
52790
56356
56749
.60257
.60642
.64058
.6443 |
.67724
.68082
.71226
.71566
.74537
.74857
.77637
.77935
80511
80785
83147
83398
85543
85769
87698
.87900
89617
89796
91309
91466
92785
92922
94062
94179
95154
95254
.96080
96164
.96856
.96926
97500
97558
.98030
.98077
.98461
98500
98809
98840
99086
99111
99305
99324
99477
99492
.99609
99621
99711
99720
99788
99795
99846
99851
99889
99893
99921
99924
99944
.99946
99961
99962
99973
99974
99981
99982
99987
99988
99992
99992
99994
99995
99996
99996
of the Z score.
.08
09
53188
53586
57142
57535
.61026
.61409
64803
.65173
68439
.68793
.71904
72240
.75175
-75490
.78230
78524
81057
81327
83646
83891
85993
86214
.88100
88298
89973
90147
91621
91774
93056
93189
94295
94408
= 95352
95449
.96246
96327
96995
.97062
97615
.97670
98124
98169
98537
98574
.98870
98899
99134
99158
_.99343
99361
99506
99520
99632
99643
99728
.99736
99801
99807
99856
99861
99896
99900
99926
99929
.99948
99950
99964
99965
99975
99976
99983
99983
99988
99989
99992
99992
99995
99995
99997
99997
|
|
7 Page 7 |
▲back to top |
STANDARD NORMAL DISTRIBUTION: Table
Z
00
01
02
-03
-3.9 | .00005
.00005
.00004
.00004
-3.8 | .00007
.00007
.00007
.00006
-3.7 | .00011
.00010
.00010
.00010
-3.6 | .00016
.00015
.00015
.00014
-3.5 | .00023
-00022
00022
00021
-3.4 | .00034
.00032
.0003 1
.00030
-3.3 | .00048
.00047
.00045
.00043
-3.2 | .00069
.00066
.00064
.00062
-3.1 | .00097
.00094
.00090
.00087
-3.0 | .00135
.00131
.00126
00122
-2.9 | .00187
00181
.00175
.00169
-2.8 | .00256
.00248
00240
.00233
-2.7 | .00347
.00336
.00326
00317
-2.6 | .00466
.00453
.00440
.00427
-2.5 | .00621
.00604
00587
.00570
-2.4 | .00820
.00798
.00776
.00755
-2.3 | .01072
.01044
01017
.00990
-2.2 | .01390
.01355
.01321
.01287
-2.1 | .01786
01743
.01700
.01659
-2.0 | .02275
02222
02169
02118
-1.9 | .02872
.02807
02743
.02680
-1.8 | .03593
.03515
03438
.03362
-1.7 | .04457
.04363
.04272
04182
-1.6 | .05480
.05370
05262
05155
-1.5 | .06681
06552
06426
.06301
-1.4 | .08076
.07927
.07780
.07636
-1.3 | .09680
.09510
.09342
09176
-1.2 | .11507
11314
11123
.10935
-1.1 | .13567
13350
13136
12924
-1.0 | .15866
15625
15386
15151
-0.9 | .18406
18141
.17879
.17619
-0.8 | .21186
.20897
.20611
.20327
-0.7 | .24196
.23885
.23576
.23270
-0.6 | .27425
.27093
.26763
.26435
-0.5 | .30854
30503
30153
.29806
-0.4 | .34458
34090
33724
33360
-0.3 | .38209
37828
37448
.37070
-0.2 | .42074
41683
41294
40905
-0.1 | .46017
.45620
45224
44828
-0.0 | .50000
49601
49202
48803
Values Represent
.04
05
.00004
.00004
.00006
.00006
.00009
.00009
.00014
.00013
00020
-00019
00029
.00028
00042
.00040
.00060
.00058
.00084
.00082
.00118
.00114
00164
00159
00226
00219
.00307
00298
00415
00402
00554
00539
00734
.00714
.00964
00939
01255
.01222
.01618
01578
.02068
02018
02619
02559
03288
03216
.04093
04006
.05050
04947
06178
06057
07493
07353
09012
08851
.10749
10565
12714
12507
14917
14686
.17361
.17106
.20045
.19766
22965
.22663
.26109
.25785
.29460
29116
32997
32636
36693
36317
40517
40129
44433
44038
48405
.48006
AREA to
06
.00004
.00006
.00008
.00013
00019
00027
.00039
.00056
.00079
00111
00154
00212
00289
.00391
.00523
.00695
.00914
01191
01539
01970
02500
.03 144
.03920
04846
05938
07215
.08691
.10383
12302
14457
16853
19489
22363
.25463
.28774
32276
35942
39743
43644
47608
the LEFT
.07
.00004
.00005
.00008
.00012
.00018
.00026
.00038
.00054
.00076
00107
00149
.00205
00280
.00379
00508
.00676
00889
.01160
.01500
01923
02442
.03074
.03836
.04746
05821
.07078
08534
.10204
12100
14231
.16602
A9215
.22065
25143
.28434
31918
35569
39358
43251
47210
of the Z score.
.08
09
.00003
.00003
.00005
.00005
.00008
.00008
.00012
.00011
00017
-00017
00025
.00024
00036
00035
00052
.00050
.00074
.00071
00104
.00100
.00144
.00139
.00199
00193
.00272
00264
.00368
.00357
00494
.00480
.00657
.00639
.00866
00842
.01130
.01101
01463
.01426
.01876
01831
02385
.02330
.03005
02938
.03754
.03673
04648
04551
.05705
05592
.06944
.06811
.08379
.08226
.10027
09853
.11900
.11702
.14007
13786
.16354
.16109
18943
18673
.21770
.21476
.24825
.24510
28096
.27760
31561
31207
35197
34827
38974
38591
42858
42465
46812
46414
|
|
8 Page 8 |
▲back to top |
The t-distribution
| dip | o40
| 1 [0.324920
| 2 [0.288675
| 3 — [0.276671
| 4 — [0.270722
| 5 [0.267181
| 6 — [0.264835
| 7 [0.263167
| 8 [0.261921
| 9 [0.260955
| 10 [0.260185
| ut {0.259556
| 12 [0.259033
| 13 [0.258591
| 14 [0.258213
| 15 |o.25788s
| 16 [0.257599
| 17 ~— [0.257347
| 18 [0.257123
| 19 [0.256923
| 20 = 0.256743
| 21 — [0.256580
| 22 [0.256432
| 23 [0.256297
| 24 [0.256173
| 25 [0.256060
| 26 [0.255955
| 27 ~— [0.255858
| 28 = [0.255768
| 29 © [0.255684
| 30 [0.255605
| inf | 0.253347
| 025
[1.000000
[0.816497
| 0.764892
[0.740697
| 0.726687
[0.717558
[0.711142
[0.706387
| 0.702722
0.699812
[0.697445
[0.695483
| 0.693829
[0.692417
[0.691197
[0.690132
|0.689195
| 0.688364
[0.687621
[0.686954
| 0.686352
[o.6ssgos
[0.685306
| 0.684850
0.684430
0.684043
| 0.683685
[0.683353
[0.683044
[0.682756
0.674490
| o10
3.077684
[1.885618
[1.637744
| 1.533206
|1.475884
[1.439756
[1.414924
[1.396815
| 1.383029
[1.372184
[1.363430
| 1.356217
[1.350171
1.345030
| 1.340606
| 1.336757
| 1.333379
| 1.330391
[1.327728
[1.325341
| 1.323188
{1.321237
| 1.319460
| 1.317836
| 1.316345
| 1.314972
| 1.313703
[1.312527
[1.311434
[1.310415
[1.281552
| 0s
| 6.313752
[2.919986
[2.353363
[2.131847
| 2.015048
[1.943180
| 1.894579
| 1.859548
| 1.833113
{1.812461
| 1.795885
| 1.782288
| 1.770933
| 1.761310
[1.753050
| 1.745884
| 1.739607
| 1.734064
[1.729133
[1.724718
| 1.720743
[1.717144
| 1.713872
| 1.710882
[1.708141
| 1.705618
| 1.703288
| 1.701131
[1.699127
| 1.697261
|1.644854
| 0025 | 001 | 0.005 | 0.0005
| 12.7620 |31.82052 |63.65674 | 636.6192
[4.30265 [6.96456 [9.92484 31.5991
[3.18245 [4.54070 [5.84091 | 12.9240
|2.77645 [3.74695 [4.60409 8.6103
|2.57058 3.36493 4.03214 | 6.8688
[2.446901 [3.14267 | 3.70743 (| 5.9588
[2.36462 [2.99795 3.49948 ‘| 5.4079
|2.30600 [2.89646 [3.35539 [5.0413
[2.26216 [2.82144 3.24984 | 4.7809
[2.22814 [2.76377 |3.16927 |4.5869
2.20099 2.71808 3.10581 | 4.4370
[2.17881 [2.68100 —|3.05454 4.3178
[2.16037 [2.65031 3.01228 | 4.2208
2.14479 [2.62449 [2.97684 ‘| 4.1405
[2.13145 = [2.60248 [2.94671 [4.0728
|2.11991 |2.58349 [2.92078 | 4.0150
[2.10982 [2.56693 |2.89823 3.9651
[2.10092 2.55238 [2.87844 3.9216
|2.09302 {2.53948 += [2.86093 [3.8834
[2.08596 [2.52798 [2.84534 [3.8495
[2.07961 |2.51765 [2.83136 [3.8193
[2.07387 [2.50832 [2.81876 [3.7921
[2.06866 {2.49987 [2.80734 [3.7676
[2.063900 [2.49216 +~—-| 2.79694 [3.7454
[2.05954 [2.48511 [2.78744 [3.7251
[2.05553 {2.47863 [2.77871 | 3.7066
[2.05183 [2.47266 | 2.77068 ~—| 3.6896
[2.04841 [2.46714 | 2.76326 | 3.6739
[2.04523 [2.46202 |2.75639 | 3.6594
|2.04227 [2.45726 | 2.75000 | 3.6460
[1.95996 |2.32635 ‘| 2.57583 |3.2905