


 |
SQC802S - STATISTICAL QUALITY CONTROL - 2ND OPP - JAN 2023 |
|
|
1 Page 1 |
▲back to top |
n Am I BI A u n IVE Rs ITY
OF SCIEnCE Ano TECHnOLOGY
FACULTY OF HEALTH AND APPLIED SCIENCES
DEPARTMENT OF MATHEMATICS
I QUALIFICATION:
PROGRAMME
I CODE:
I COURSE CODE:
I SESSION:
I DURATION:
BACHELOR OF SCIENCE HONOURS IN APPLIED MATHEMAT-
ICS AND STATISTICS
08BSHS
I LEVEL: 8
SQC802S
JAN 2023
3 HOURS
COURSE
I NAME:
I PAPER:
I MARKS
I STATISTICAL QUALITY CONTROL
THEORY
I
100
I
SUPPLEMENTARY/
I EXAMINER
I MODERATOR
2ND OPPORTUNITY QUESTION PAPER
I Dr. Jacob Ong'ala
I Prof Sathiya Appunni
INSTRUCTION
1. Answer all the questions
2. Show clearly all the steps in the calculations
3. All written work must be done in blue and black ink
THIS QUESTION
PERMISSIBLE MATERIALS
Non-programmable calculator without cover
PAPER CONSISTS OF 7 PAGES (including the front page and
attachment)
1
|
|
2 Page 2 |
▲back to top |
QUESTION ONE - 20 MARKS
(a) A motorcycle manufacturing company uses 4-sigma in its quality control framework. If a
motorcycle consists of an assembly of 76 independent components or parts and all of these
parts must be non-defective for the product to function satisfactorily. What is the proba-
bility that any specific unit of product is non-defective
[3 mks]
(b) A manufacturer of components for automobile transmissions wants to use control charts
to monitor a process producing a shaft. The resulting data from 20 samples of 4 shaft
diameters that have been measured are:
LXi 20
= 10.275
i=l
and
I:R; 20
= 1.012
i=l
(i) Find the control limits that should be used 011 the x and R control charts.
[6 mks]
(ii) What is the expected number of samples that must betaken before the shif is detected
[2 mks
(iii) Find the probability of detecting a shift of 0.8cr in the first sample if the process is
monitored under 3 sigma.
[3 mks]
(c) State 3 advantages and 2 disadvantages of acceptance sampling
[6 mks]
QUESTION TWO - 18 MARKS
(a) Select one specific product and one service of your choice, and discuss how the eight dimen-
sions of quality impact its overall acceptance by consumers
[8 mks]
(b) Quality and process improvement occurs most effectively on a project-by-project basis.
DMAIC is a structured five-step problem-solving procedure that can be used to success-
fully complete projects by proceeding through and implementing solutions that are designed
to solve root causes of quality and process problems, and to establish best practices to en-
sure that the solutions are permanent and can be replicated in other relevant business
operations. Explain the five steps in DMAIC process (stating clearly the goalandactivities
in each step)
[10 mks]
QUESTION THREE - 24 MARKS
A high-voltage power supply should have a nominal output voltage of 350 V. A sample of
four units is selected each day and tested for process-control purposes. The data shown in
Table 1 give the difference between the observed reading on each unit and the nominal voltage
times ten; that is, Xi = (observed voltage on unit i - 350)10.
2
|
|
3 Page 3 |
▲back to top |
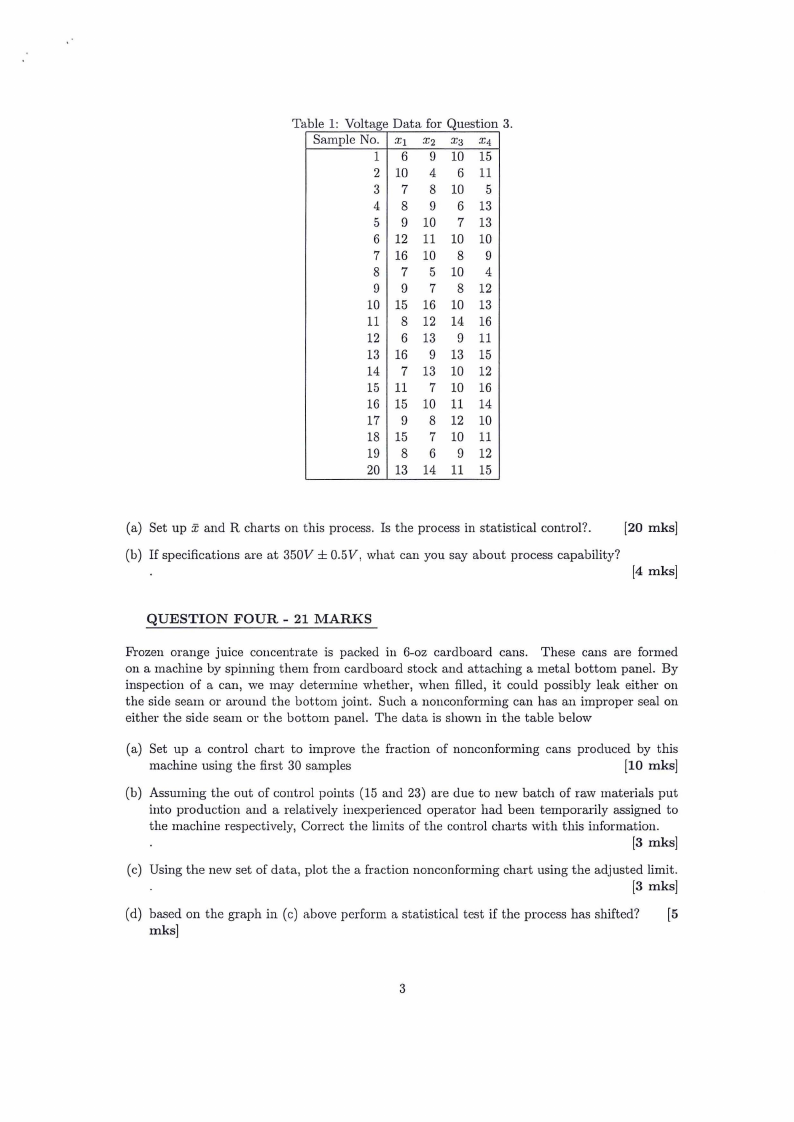
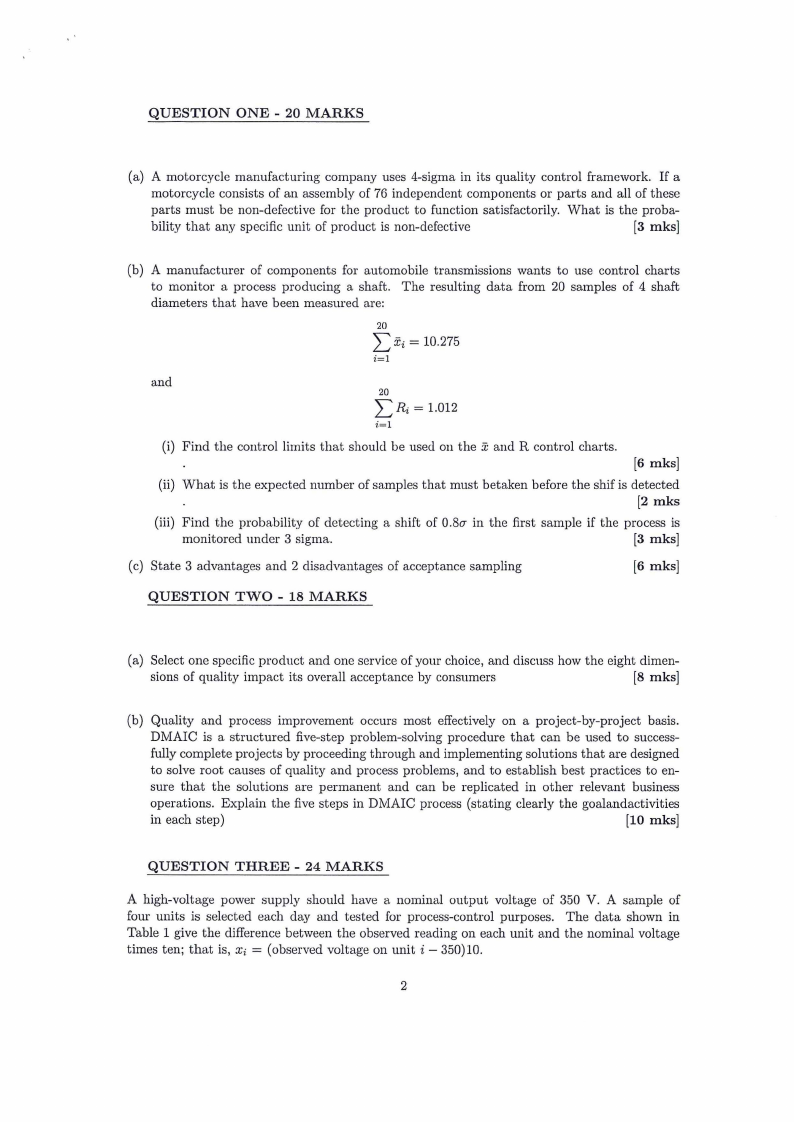
Table 1: Voltage Data for Question 3.
Sample No. XI x2 X3 X4
1 6 9 10 15
2 10 4 6 11
3 7 8 10 5
4 8 9 6 13
5 9 10 7 13
6 12 11 10 10
7 16 10 8 9
8 7 5 10 4
9 9 7 8 12
10 15 16 10 13
11 8 12 14 16
12 6 13 9 11
13 16 9 13 15
14 7 13 10 12
15 11 7 10 16
16 15 10 11 14
17 9 8 12 10
18 15 7 10 11
19 8 6 9 12
20 13 14 11 15
(a) Set up x and R charts on this process. Is the process in statistical control?.
[20 mks]
(b) If specifications are at 350V ± 0.5V, what can you say about process capability?
[4 mks]
QUESTION FOUR - 21 MARKS
Ftozen orange juice concentrate is packed in 6-oz cardboard cans. These cans are formed
on a machine by spinning them from cardboard stock and attaching a metal bottom panel. By
inspection of a can, we may determine whether, when filled, it could possibly leak either on
the side seam or around the bottom joint. Such a nonconforming can has an improper seal on
either the side seam or the bottom panel. The data is shown in the table below
(a) Set up a control chart to improve the fraction of nonconforming cans produced by this
machine using the first 30 samples
[10 mks]
(b) Assuming the out of control points (15 and 23) are due to new batch of raw materials put
into production and a relatively inexperienced operator had been temporarily assigned to
the machine respectively, Correct the limits of the control charts with this information.
[3 mks]
(c) Using the new set of data, plot the a fraction nonconforming chart using the adjusted limit.
[3 mks]
(d) based on the graph in (c) above perform a statistical test if the process has shifted? [5
mks]
3
|
|
4 Page 4 |
▲back to top |
= Sample Size 11 50
Sample
Number
Number or
Nonconforming
Cons,D;
I
12
2
15
3
8
4
JO
5
4
6
7
7
16
8
9
9
14
JO
JO
II
5
12
6
13
17
14
12
15
:22
16
8
Sample
Number
17
18
19
20
21
22
23
24
25
26
27
28
29
30
Number or
Nonconforming
Cuns,D 1
JO
5
13
II
20
18
24
15
9
12
7
13
9
6
Sam1>le
Number
31
32
33
34
35
36
37
38
39
40
41
42
43
Number or
Nonconforming
Cans,D;
9
6
12
5
6
4
6
3
7
6
2
4
3
Sample
Number
44
45
46
47
48
49
50
51
52
53
54
Number or
Nonconforming
Cans, D;
6
5
4
8
5
6
7
5
6
3
5
Figure 1: Number of Defective products from each sample of 50
QUESTION FIVE - 12 MARKS
(a) Why would a typical automobile company manufacturing particular vehicles with about
100,000 components each use six-sigma instead of five-sigma for assessing their quality
performance?
[5 mks]
(b) Consider the Shew hart x control chart with two-sigma limits
(i) Find the probability that a single point falls outside the limits when the process is in
control
[2 mks]
(ii) what sample number will produce an out-of control signal
[2 mks]
(iii) Calculate the standard deviation of the average run length
[2 mks]
(c) Describe the following sampling plans
(i) single-sampling plan
(ii) Double-sampling plan
(iii) Multiple-sampling plan
[2 mks]
[2 mks]
[2 mks]
- END OF QUESTIONS -
4
|
|
5 Page 5 |
▲back to top |
- --------- --------- ....---··--------·-·---- --
Chart rurAn!&JJ.!C."
Cl1arlfor Slane.JardDcl'ialious
Ohscnotious
in
S..mplc,11
Factors fur
Co11trolLin1il'-
,I
.-1.? ,IJ
Fnctorsfur
Center Linc
c, 11c,
Faclnrs for Control 1..imil(i
II_, 11, 115 11•
2
:!.121 i.880 2.659 0. 7979 1.2533 0
3.267 0
2.606
3
i.732 1.()23 1.954 0.8862 1.1284 ()
2.568 0
2.276
4
1_,00 0.729 1.628 0.92 iJ 1.0854 ()
2.266 0
2.088
5
1.342 0.577 1.427 0.9400 1.1)638 0
2.089 0
1.964
6
1.225 0.483 1.287 U.9515 1.05!0 0.030 1.970 0.029 1.874
7
1.134 0.419 1.1~2 0.9594 1.0423 0.118 1.882 0.113 1.806
8
1.061 U.373 1.099 0.%50 i.0363 0.185 1.815 U.179 1.751
9
i.OO!l 0.337 1.()32 0.%93 1.0317 0.239 1.761 0.232 1.707
10
U.308 0.975 0.9727 1.0281
1.716 0.276 1.669
II
0.905 0.285 0.927 0.9754 1.0252 0.321 i.679 0.313 i.637
12
0.866 U.266 0.886 0.9776 l.022lJ
i.646 0.346 i.610
13 0.832 0.249 U.850 U.9794 1.0210 0.382 1.618 0.374 1.585
14
0.802 0.235 U.817 0.9S 10 1.0194 0.-106 1.594 0.31) 1) 1.563
15
0.775 0.223 U.789 0.98.23 1.0180 OA2f; 1.572 0.421
16 0.750 O..:!I:! 0.763 0.9835 1.016K
1.55:! 0.440 1.526
17 0.728 0.203 0.739 0.9K45 U1157 0.-16(,
0.45K 1.511
18 0.707
0.718 0.9854
0.-182 1.518 0.475 IA96
19 0.688 U.187 0.698 0.9862 1.0140 0.-197 1.503 11.490 1.483
20
0.671 0.180 11.680 0.986 1) 1.1113.1 0.510 l.4 4lll ll.50-1 1.4711
21
0.655 0.17.l U.663 11.9876 1.0126 0.52) 1.-177 tl.516 1.-159
21
0.640 0.167 0.647 0.9882 1.0119 0.534 1.466 U.52K 1.448
23
0.626 0.162 0.633 0.9887 1.0114 0.5-15 1.-155 0.531) 1.438
24
0.612 0.157 0.619 0.9R9.2 1.0109 o.s;; 1.4-15 11.5-19 1.4:!9
25
0.600 0.153 U.606 0.9896 J.0J05 U.565 1.-135 0.559 1.-120
Faclors for
Center Line
d,
ltd,
1.128
i.693
2.059
2.326
2.534
2.7().1
2.847
2.970
3.078
3.173
3.258
.l.336
3A07
3Ai2
3.532
3.588
3.640
3.689
3.735
3.778
3.819
3.858
3.895
3.931
0.8865
0.5907
0.4857
0.429'1
0.3946
0.3698
0.3512
0.3367
0.3152
0.3069
0.299R
0.2935
0.2880
0.2831
0.2787
0.2747
0.2711
0.2677
0.26-17
0.2618
0.2592
0.2567
0.2544
Chart for RanJ.!l'S
Factors fur Control Limil"
dJ o, o, /)J o,
0.853 0
0.888 0
0.880 ()
0.864 0
0.848 0
0.833 0.2(14
0.820 0.388
0.808 0.547
0.797 0.687
0.787 0.811
0.778 0.922
0.770 1.025
0.763 1.118
U.756 1.203
0.750 1.282
0.744 J.356
0.739 1.424
0.734 1.487
0.729 1.549
0.724 1.605
11.720 1.659
0.716 1.710
0.712 1.759
0.708 J.806
3.686
4.358
4.698
4.918
5.078
5.204
5.306
5.393
5.469
5.535
5.59-1
5.6%
5.782
5.820
5.856
5.891
5.921
5.951
5.979
6.!Xl6
6.031
6.056
0
u
0
u
0
0.076
0.136
0.184
0.223
0.256
0.283
0.307
0.328
0.347
0.363
0.378
0391
U.403
U.415
0.425
U.434
0:443
0.451
0.459
3.267
2.574
2.282
2.114
2.00l
1.924
i.864
i.816
1.777
i.744
1.717
J.693
1.672
1.653
1.637
J.622
1.608
1.597
1.585
1.575
1.566
1.557
1.548
1541
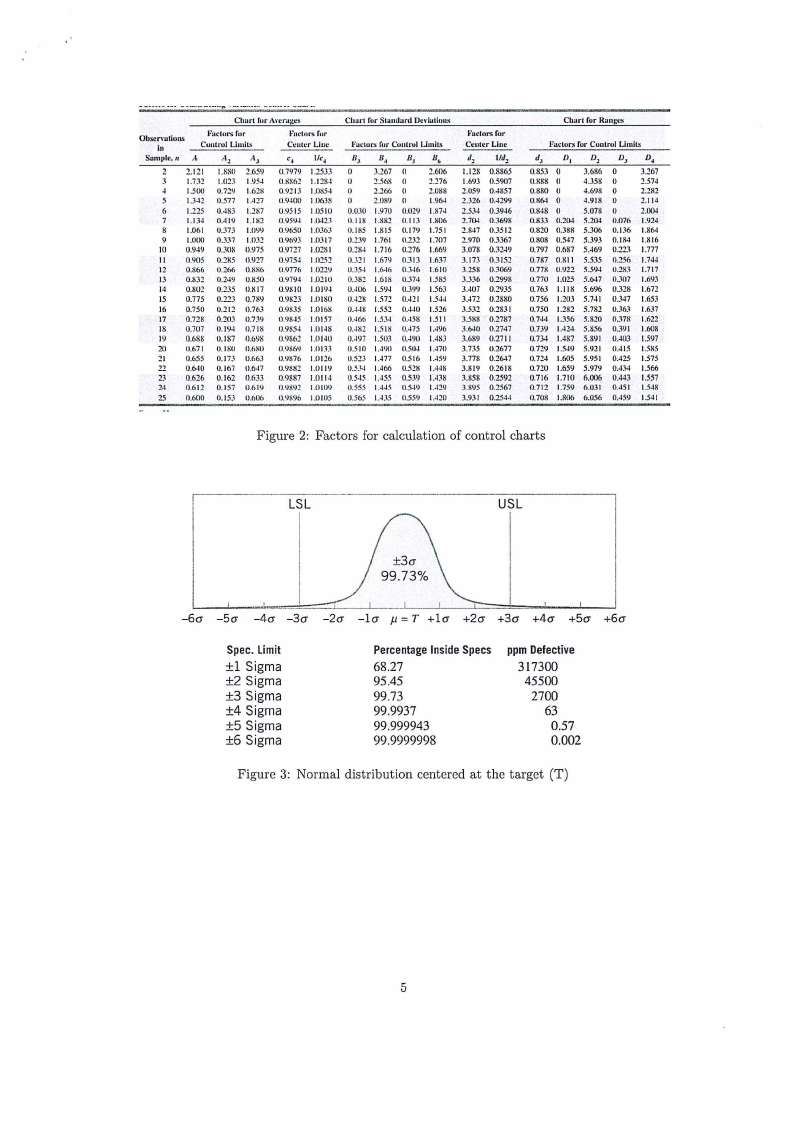
Figure 2: Factors for calculation of control charts
LSL
USL
-6CJ -5CJ -4CJ -3CJ -2CJ -le, µ = T +le, +2CJ +3CJ +4CJ +5!1 +6<1
Spec. Limit
±1 Sigma
±2 Sigma
±3 Sigma
±4 Sigma
±5 Sigma
±6 Sigma
PercentageInsideSpecs
68.27
95.45
99.73
99.9937
99.999943
99.9999998
ppmDefective
317300
45500
2700
63
0.57
0.002
Figure 3: Normal distribution centered at the target (T)
5
|
|
6 Page 6 |
▲back to top |
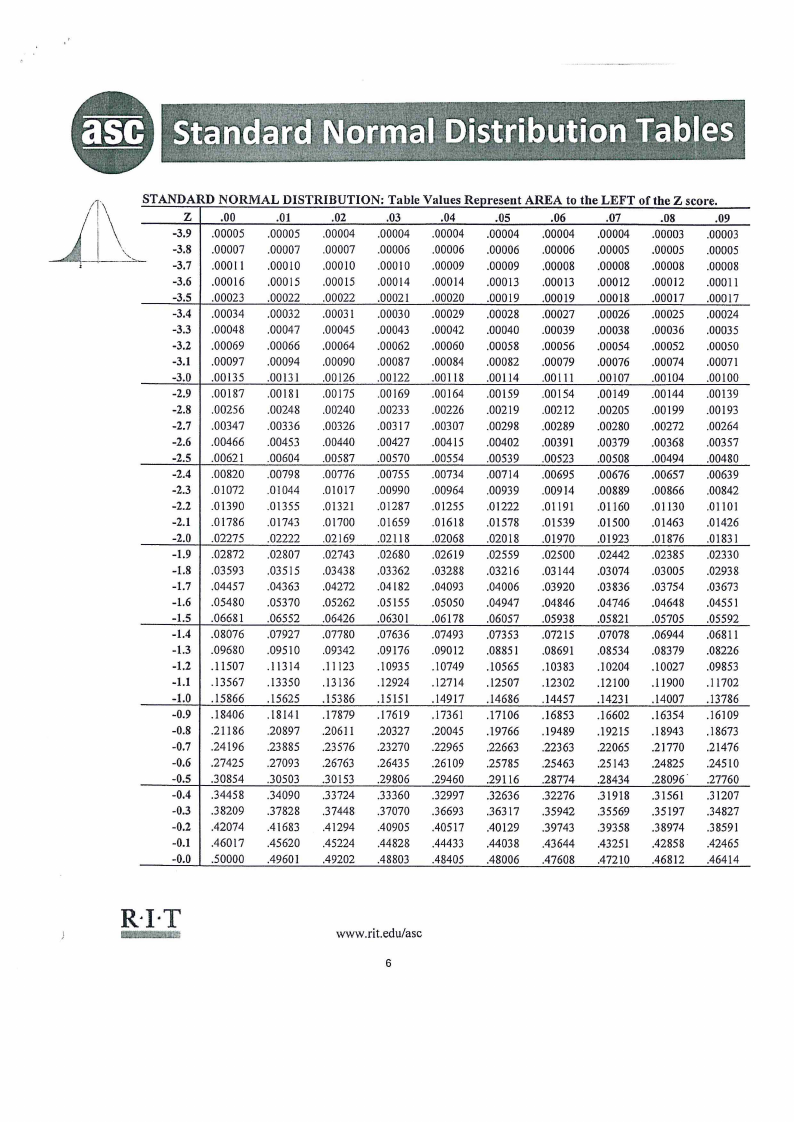
Jl\\:TANDARNDORDMISATLRITBUTION z .00
.01
: abl e VIa ues Represen t AREA t0 the LEFT of the Z score .
.02
.03
.04
.05
. 06
.07
.08
.09
-3.9 .00005 .00005 .00004 .00004 .00004 .00004 .00004 .00004 .00003 .00003
-3.8 .00007 .00007 .00007 .00006 .00006 .00006 .00006 .00005 .00005 .00005
-3.7 .00011 .00010 .00010 .00010 .00009 .00009 .00008 .00008 .00008 .00008
-3.6 .00016 .00015 .00015 .00014 .00014 .00013 .00013 .00012 .00012 .00011
-3.5 .00023 .00022 .00022 .00021 .00020 .00019 .00019 .00018 .00017 .00017
-3.4 .00034 .00032 .00031 .00030 .00029 .00028 .00027 .00026 .00025 .00024
-3.3 .00048 .00047 .00045 .00043 .00042 .00040 .00039 .00038 .00036 .00035
-3.2 .00069 .00066 .00064 .00062 .00060 .00058 .00056 .00054 .00052 .00050
-3.1 .00097 .00094 .00090 .00087 .00084 .00082 .00079 .00076 .00074 .00071
-3.0 .00135 .00131 .00126 .00122 .00118 .00114 .00111 .00107 .00104 .00100
-2.9 .00187 .00181 .00175 .00169 .00164 .00159 .00154 .00149 .00144 .00139
-2.8 .00256 .00248 .00240 .00233 .00226 .00219 .00212 .00205 .00199 .00193
-2.7 .00347 .00336 .00326 .00317 .00307 .00298 .00289 .00280 .00272 .00264
-2.6 .00466 .00453 .00440 .00427 .00415 .00402 .00391 .00379 .00368 .00357
-2.5 .00621 .00604 .00587 .00570 .00554 .00539 .00523 .00508 .00494 .00480
-2.4 .00820 .00798 .00776 .00755 .00734 .00714 .00695 .00676 .00657 .00639
-2.3 .01072 .01044 .01017 .00990 .00964 .00939 .00914 .00889 .00866 .00842
-2.2 .01390 .01355 .01321 .01287 .01255 .01222 .01191 .01160 .01130 .OJ101
-2.1 .01786 .01743 .01700 .01659 .01618 .01578 .01539 .01500 .01463 .01426
-2.0 .02275 .02222 .02169 .02118 .02068 .02018 .01970 .01923 .01876 .01831
-1.9 .02872 .02807 .02743 .02680 .02619 .02559 .02500 .02442 .02385 .02330
-1.8 .03593 .03515 .03438 .03362 .03288 .03216 .03144 .03074 .03005 .02938
-1.7 .04457 .04363 .04272 .04182 .04093 .04006 .03920 .03836 .03754 .03673
-1.6 .05480 .05370 .05262 .05155 .05050 .04947 .04846 .04746 .04648 .04551
-1.5 .06681 .06552 .06426 .06301 .06178 .06057 .05938 .05821 .05705 .05592
-1.4 .08076 .07927 .07780 .07636 .07493 .07353 .07215 .07078 .06944 .06811
-1.3 .09680 .09510 .09342 .09176 .09012 .08851 .08691 .08534 .08379 .08226
-1.2 .11507 .11314 .11123 .10935 .10749 .10565 .10383 .10204 .10027 .09853
-1.1 .13567 .13350 .13136 .12924 .12714 .12507 .12302 .12100 .11900 .11702
-1.0 .15866 .15625 .15386 .15151 .14917 .14686 .14457 .14231 .14007 .13786
-0.9 .18406 .18141 .17879 .17619 .17361 .17106 .16853 .16602 .16354 .16109
-0.8 .21186 .20897 .20611 .20327 .20045 .19766 .19489 .19215 .18943 .18673
-0.7 .24196 .23885 .23576 .23270 .22965 .22663 .22363 .22065 .21770 .21476
-0.6 .27425 .27093 .26763 .26435 .26109 .25785 .25463 .25143 .24825 .24510
-0.5 .30854 .30503 .30153 .29806 .29460 .29116 .28774 .28434 .28096' .27760
-0.4 .34458 .34090 .33724 .33360 .32997 .32636 .32276 .3 I 918 .31561 .31207
-0.3 .38209 .37828 .37448 .37070 .36693 .36317 .35942 .35569 .35197 .34827
-0.2 .42074 .41683 .41294 .40905 .40517 .40129 .39743 .39358 .38974 .38591
-0.1 .46017 .45620 .45224 .44828 .44433 .44038 .43644 .43251 .42858 .42465
-0.0 .50000 .49601 .49202 .48803 .48405 .48006 .47608 .47210 .46812 .46414
R·I·T
www .rit.edu/asc
6
|
|
7 Page 7 |
▲back to top |
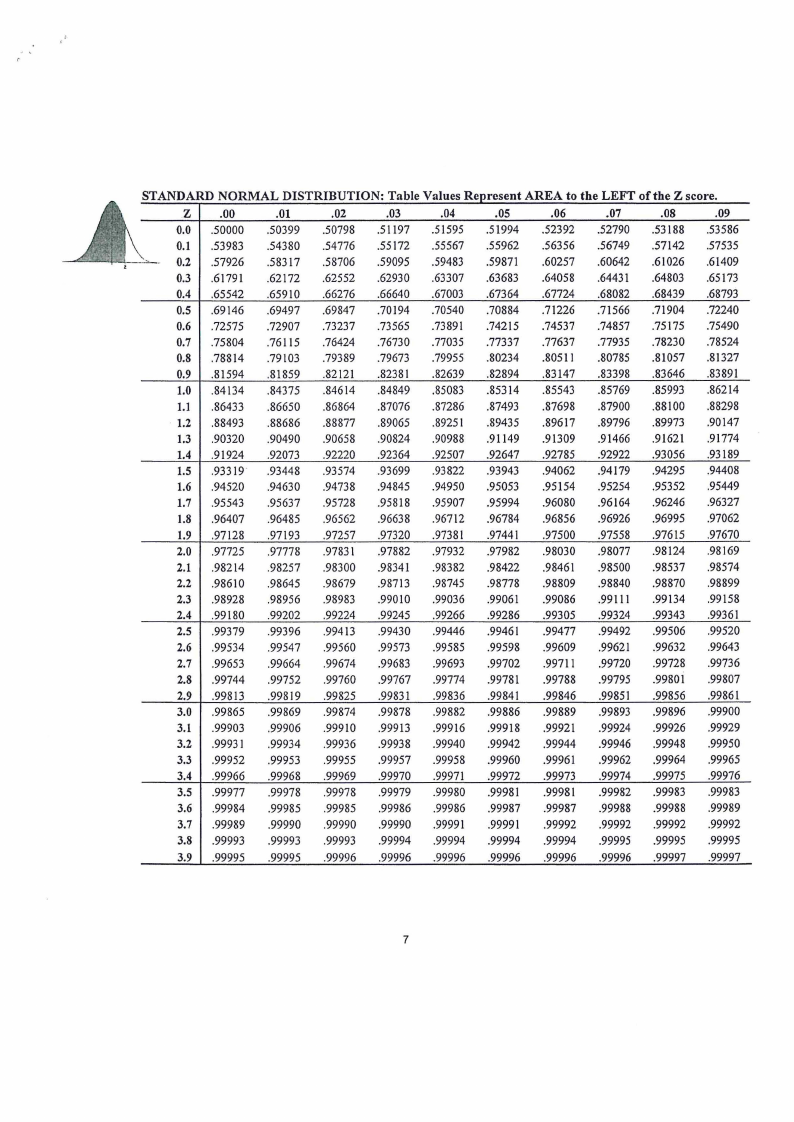
TANDARD NORMAL DISTRIBUTION: Table Values Reorcsent AREA to the LEFT of the Z score.
z .00
.01
.02
.03
.04
.05
.06
.07
.08
.09
0.0 .50000 .50399 .50798 .51197 .51595 .51994 .52392 .52790 .53188 .53586
0.1 .53983 .54380 .54776 .55172 .55567 .55962 .56356 .56749 .57142 .57535
'· 0.2 .57926 .58317 .58706 .59095 .59483 .59871 .60257 .60642 .61026 .61409
0.3 .61791 .62172 .62552 .62930 .63307 .63683 .64058 .64431 .64803 .65173
0.4 .65542 .65910 .66276 .66640 .67003 .67364 .67724 .68082 .68439 .68793
0.5 .69146 .69497 .69847 .70194 .70540 .70884 .71226 .71566 .71904 .72240
0.6 .72575 .72907 .73237 .73565 .73891 .74215 .74537 .74857 .75175 .75490
0.7 .75804 .76115 .76424 .76730 .77035 .77337 .77637 .77935 .78230 .78524
0.8 .78814 .79103 .79389 .79673 .79955 .80234 .80511 .80785 .81057 .81327
0.9 .81594 .81859 .82121 .82381 .82639 .82894 .83147 .83398 .83646 .83891
1.0 .84134 .84375 .84614 .84849 .85083 .85314 .85543 .85769 .85993 .86214
1.1 .86433 .86650 .86864 .87076 .87286 .87493 .87698 .87900 .88100 .88298
1.2 .88493 .88686 .88877 .89065 .89251 .89435 .89617 .89796 .89973 .90147
1.3 .90320 .90490 .90658 .90824 .90988 .91149 .91309 .91466 .91621 .91774
1.4 .91924 .92073 .92220 .92364 .92507 .92647 .92785 .92922 .93056 .93189
1.5 .93319 .93448 .93574 .93699 .93822 .93943 .94062 .94179 .94295 .94408
1.6 .94520 .94630 .94738 .94845 .94950 .95053 .95154 .95254 .95352 .95449
1.7 .95543 .95637 .95728 .95818 .95907 .95994 .96080 .96164 .96246 .96327
1.8 .96407 .96485 .96562 .96638 .96712 .96784 .96856 .96926 .96995 .97062
1.9 .97128 .97193 .97257 .97320 .97381 .97441 .97500 .97558 .97615 .97670
2.0 .97725 .97778 .97831 .97882 .97932 .97982 .98030 .98077 .98124 .98169
2.1 .98214 .98257 .98300 .98341 .98382 .98422 .98461 .98500 .98537 .98574
2.2 .98610 .98645 .98679 .98713 .98745 .98778 .98809 .98840 .98870 .98899
2.3 .98928 .98956 .98983 .99010 .99036 .99061 .99086 .99111 .99134 .99158
2.4 .99180 .99202 .99224 .99245 .99266 .99286 .99305 .99324 .99343 .99361
2.5 .99379 .99396 .99413 .99430 .99446 .99461 .99477 .99492 .99506 .99520
2.6 .99534 .99547 .99560 .99573 .99585 .99598 .99609 .99621 .99632 .99643
2.7 .99653 .99664 .99674 .99683 .99693 .99702 .99711 .99720 .99728 .99736
2.8 .99744 .99752 .99760 .99767 .99774 .99781 .99788 .99795 .99801 .99807
2.9 .99813 .99819 .99825 .99831 .99836 .99841 .99846 .99851 .99856 .99861
3.0 .99865 .99869 .99874 .99878 .99882 .99886 .99889 .99893 .99896 .99900
3.1 .99903 .99906 .99910 .99913 .99916 .99918 .99921 .99924 .99926 .99929
3.2 .99931 .99934 .99936 .99938 .99940 .99942 .99944 .99946 .99948 .99950
3.3 .99952 .99953 .99955 .99957 .99958 .99960 .99961 .99962 .99964 .99965
3.4 .99966 .99968 .99969 .99970 .99971 .99972 .99973 .99974 .99975 .99976
3.5 .99977 .99978 .99978 .99979 .99980 .99981 .99981 .99982 .99983 .99983
3.6 .99984 .99985 .99985 .99986 .99986 .99987 .99987 .99988 .99988 .99989
3.7 .99989 .99990 .99990 .99990 .99991 .99991 .99992 .99992 .99992 .99992
3.8 .99993 .99993 .99993 .99994 .99994 .99994 .99994 .99995 .99995 .99995
3.9 .99995 .99995 .99996 .99996 .99996 .99996 .99996 .99996 .99997 .99997
7