


 |
FMA712S - FINANCIAL MANAGEMENT AGRICULTURE - 1ST OPP - NOV 2024 |
|
|
1 Page 1 |
▲back to top |
nAm I BIA un IVERSITY
OF SCIEnCE Ano TECHnOLOGY
FACULTY OF HEALTH, NATURAL RESOURCES AND APPLIED SCIENCES
SCHOOL OF AGRICULTURE AND NATURAL RESOURCE SCIENCES
DEPARTMENT OF AGRICULTURAL SCIENCES AND AGRIBUSINESS
QUALIFICATION: BACHELOR OF AGRICULTURE/BSc: AGRICULTURE
QUALIFICATION CODE: 07BAGR/07BAGA
COURSE CODE: FMA712S/FMA720S
SESSION: NOVEMBER 2024
LEVEL:?
COURSE NAME: FINANCIAL MANAGEMENT-
AG RICULTURE
PAPER: THEORY AND CALCULATIONS
DURATION: 3 HOURS
MARKS: 100
EXAMINER
MODERATOR
FIRST OPPORTUNITY EXAMINATION QUESTION PAPER
Lameck Odada
Dr Kennedy Sean Kalundu
INSTRUCTIONS
1. This examination question paper consists of FOUR (4) questions
2. Answer ALL the questions in blue or black ink only. NO PENCIL.
3. Start each question on a new page and number the answers correctly and clearly.
4. Write clearly and neatly, showing all your workings/assumptions.
5. Work with at least four (4) decimal places in all your calculations and round off only final
answers to two (2) decimal places.
6. Questions relating to this examination may be raised in the initial 30 minutes after the start
of the examination. Thereafter, candidates must use their initiative to deal with any
perceived errors or ambiguities, and any assumptions the candidate makes should be
clearly stated.
PERMISSIBLE MATERIALS
1. Silent, non-programmable calculators
THIS QUESTION PAPER CONSISTS OF _8_ PAGES (including this front page)
|
|
2 Page 2 |
▲back to top |
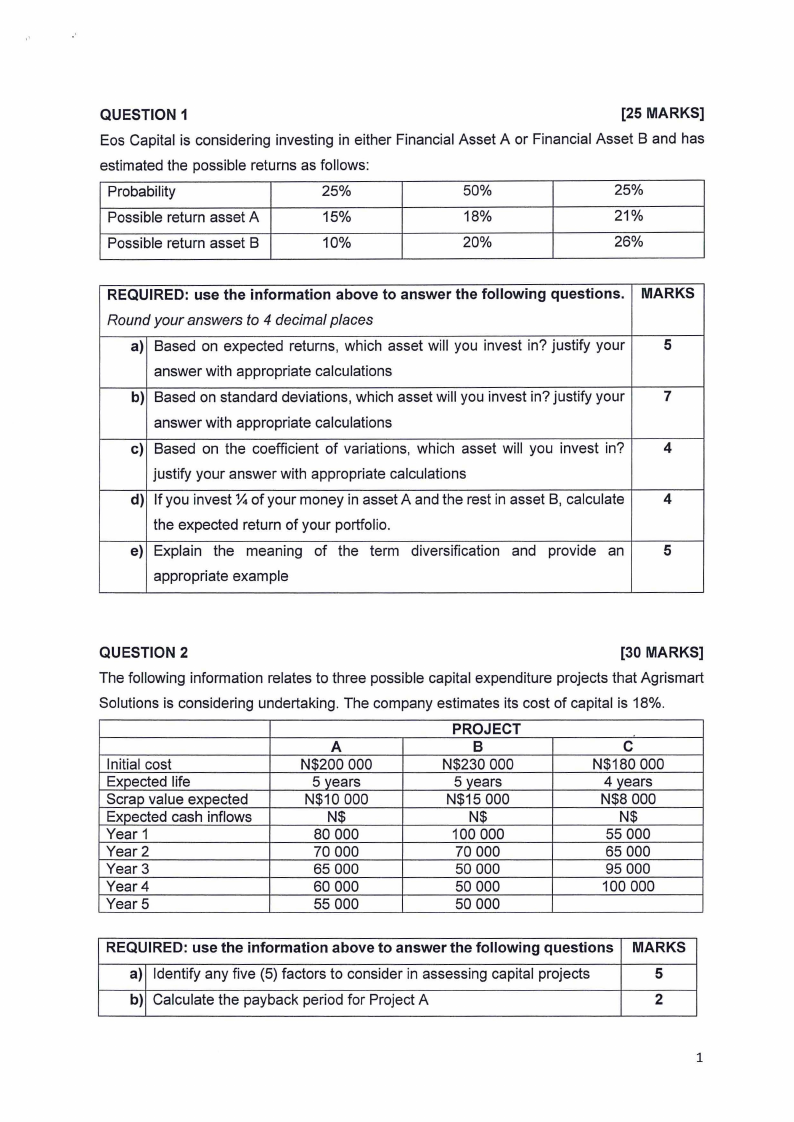
QUESTION 1
[25 MARKS]
Eos Capital is considering investing in either Financial Asset A or Financial Asset B and has
estimated the possible returns as follows:
Probability
25%
50%
25%
Possible return asset A
15%
18%
21%
Possible return asset 8
10%
20%
26%
REQUIRED: use the information above to answer the following questions.
Round your answers to 4 decimal places
a) Based on expected returns, which asset will you invest in? justify your
answer with appropriate calculations
b) Based on standard deviations, which asset will you invest in? justify your
answer with appropriate calculations
c) Based on the coefficient of variations, which asset will you invest in?
justify your answer with appropriate calculations
d) If you invest ¼ of your money in asset A and the rest in asset 8, calculate
the expected return of your portfolio.
e) Explain the meaning of the term diversification and provide an
appropriate example
MARKS
5
7
4
4
5
QUESTION 2
[30 MARKS]
The following information relates to three possible capital expenditure projects that Agrismart
Solutions is considering undertaking. The company estimates its cost of capital is 18%.
Initial cost
Expected life
Scrap value expected
Expected cash inflows
Year1
Year2
Year3
Year4
Years
A
N$200 000
5 years
N$10 000
N$
80 000
70 000
65 000
60 000
55 000
PROJECT
B
N$230 000
5 years
N$15 000
N$
100 000
70 000
50 000
50 000
50 000
C
N$180 000
4 years
N$8 000
N$
55 000
65 000
95 000
100 000
REQUIRED: use the information above to answer the following questions
a) Identify any five (5) factors to consider in assessing capital projects
b) Calculate the payback period for Project A
MARKS
5
2
1
|
|
3 Page 3 |
▲back to top |
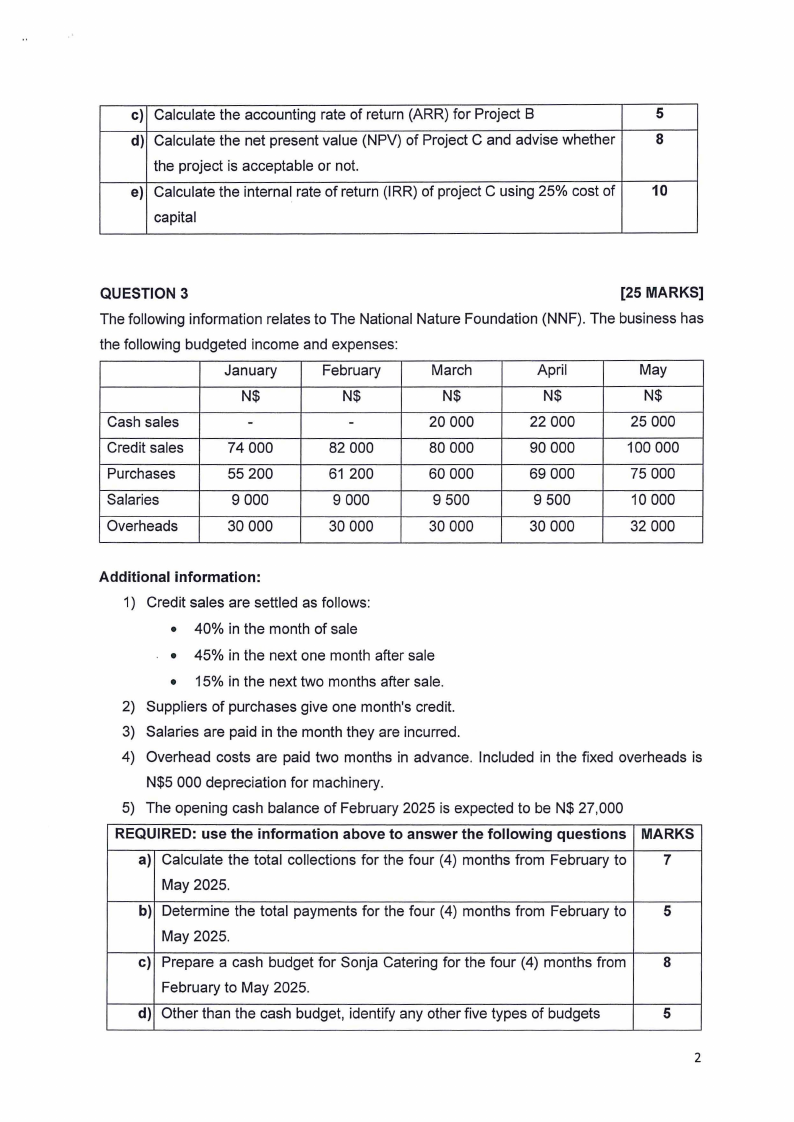
c) Calculate the accounting rate of return (ARR) for Project B
5
d) Calculate the net present value (NPV) of Project C and advise whether
8
the project is acceptable or not.
e) Calculate the internal rate of return (IRR) of project C using 25% cost of
10
capital
QUESTION 3
[25 MARKS]
The following information relates to The National Nature Foundation (NNF).The business has
the following budgeted income and expenses:
January
February
March
April
May
N$
N$
N$
N$
N$
Cash sales
-
-
20 000
22 000
25 000
Credit sales
74 000
82 000
80 000
90 000
100 000
Purchases
55 200
61 200
60 000
69 000
75 000
Salaries
9 000
9 000
9 500
9 500
10 000
Overheads
30 000
30 000
30 000
30 000
32 000
Additional information:
1) Credit sales are settled as follows:
• 40% in the month of sale
• 45% in the next one month after sale
• 15% in the next two months after sale.
2) Suppliers of purchases give one month's credit.
3) Salaries are paid in the month they are incurred.
4) Overhead costs are paid two months in advance. Included in the fixed overheads is
N$5 000 depreciation for machinery.
5) The opening cash balance of February 2025 is expected to be N$ 27,000
REQUIRED: use the information above to answer the following questions MARKS
a) Calculate the total collections for the four (4) months from February to
7
May 2025.
b) Determine the total payments for the four (4) months from February to
5
May 2025.
c) Prepare a cash budget for Sonja Catering for the four (4) months from
8
February to May 2025.
d) Other than the cash budget, identify any other five types of budgets
5
2
|
|
4 Page 4 |
▲back to top |
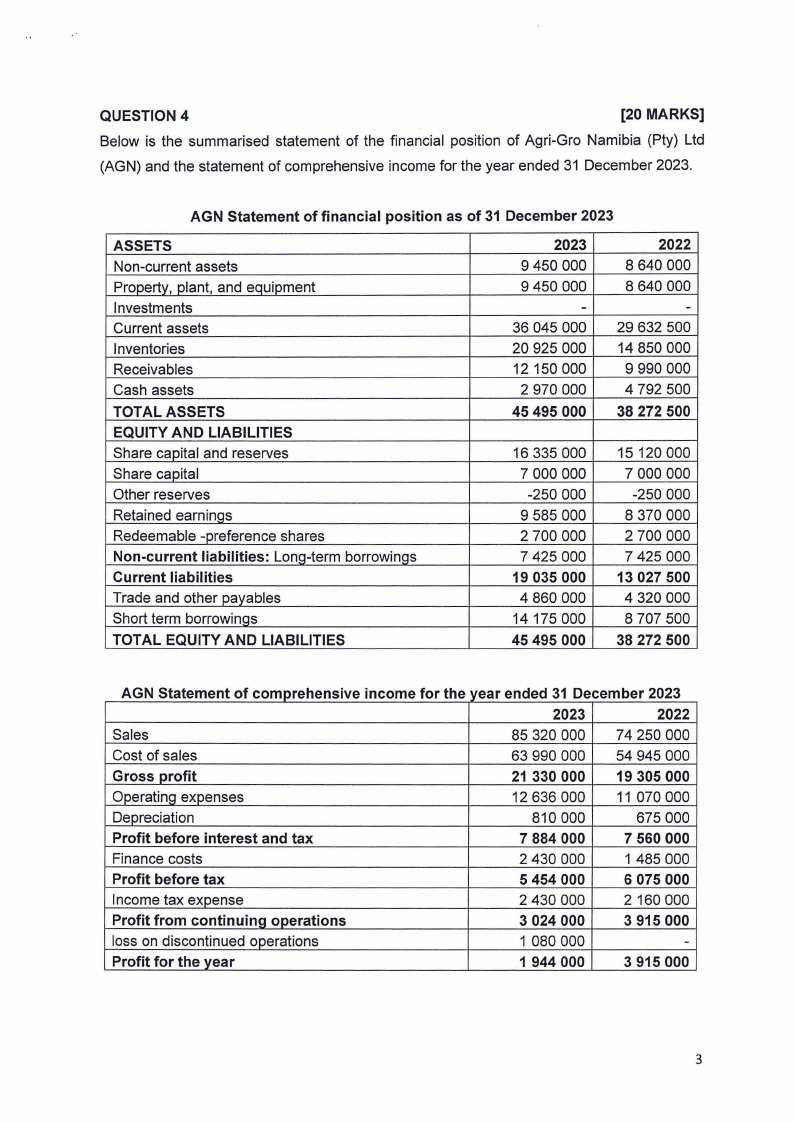
QUESTION 4
[20 MARKS]
Below is the summarised statement of the financial position of Agri-Gro Namibia (Pty) Ltd
(AGN) and the statement of comprehensive income for the year ended 31 December 2023.
AGN Statement of financial position as of 31 December 2023
ASSETS
Non-current assets
Propertv, plant, and equipment
Investments
Current assets
Inventories
Receivables
Cash assets
TOTAL ASSETS
EQUITY AND LIABILITIES
Share capital and reserves
Share capital
Other reserves
Retained earninas
Redeemable -preference shares
Non-current liabilities: LonQ-term borrowinqs
Current liabilities
Trade and other payables
Short term borrowinqs
TOTAL EQUITY AND LIABILITIES
2023
9 450 000
9 450 000
-
36 045 000
20 925 000
12 150 000
2 970 000
45 495 000
2022
8 640 000
8 640 000
-
29 632 500
14 850 000
9 990 000
4 792 500
38 272 500
16 335 000
7 000 000
-250 000
9 585 000
2 700 000
7 425 000
19 035 000
4 860 000
14 175 000
45 495 000
15 120 000
7 000 000
-250 000
8 370 000
2 700 000
7 425 000
13 027 500
4 320 000
8 707 500
38 272 500
AGNS tatement of compre hensIve income for the year ended 31 December 2023
2023
2022
Sales
85 320 000 74 250 000
Cost of sales
63 990 000 54 945 000
Gross profit
21 330 000 19 305 000
Operating expenses
12 636 000 11 070 000
Depreciation
810 000
675 000
Profit before interest and tax
7 884 000
7 560 000
Finance costs
2 430 000
1485000
Profit before tax
5 454 000
6 075 000
Income tax expense
2 430 000
2 160 000
Profit from continuing operations
loss on discontinued operations
3 024 000
1 080 000
3 915 000
-
Profit for the vear
1944000
3 915 000
3
|
|
5 Page 5 |
▲back to top |
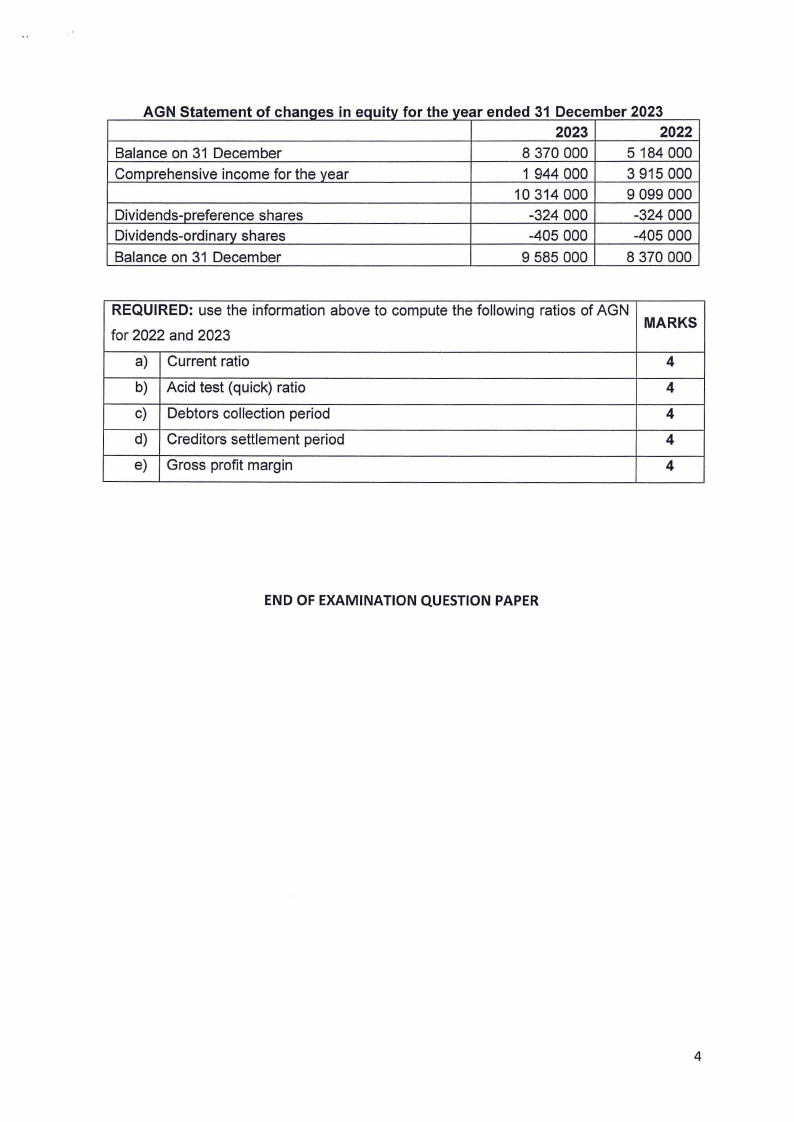
AGN Statement of changes m equi.ty for the year ended 31 Decem ber 2023
2023
2022
Balance on 31 December
8 370 000
5 184 000
Comprehensive income for the vear
1 944 000
3 915 000
10 314 000
9 099 000
Dividends-preference shares
-324 000
-324 000
Dividends-ordinarv shares
-405 000
-405 000
Balance on 31 December
9 585 000
8 370 000
REQUIRED: use the information above to compute the following ratios of AGN
for 2022 and 2023
a) Current ratio
b) Acid test (quick) ratio
c) Debtors collection period
d) Creditors settlement period
e) Gross profit margin
MARKS
4
4
4
4
4
END OF EXAMINATION QUESTION PAPER
4
|
|
6 Page 6 |
▲back to top |
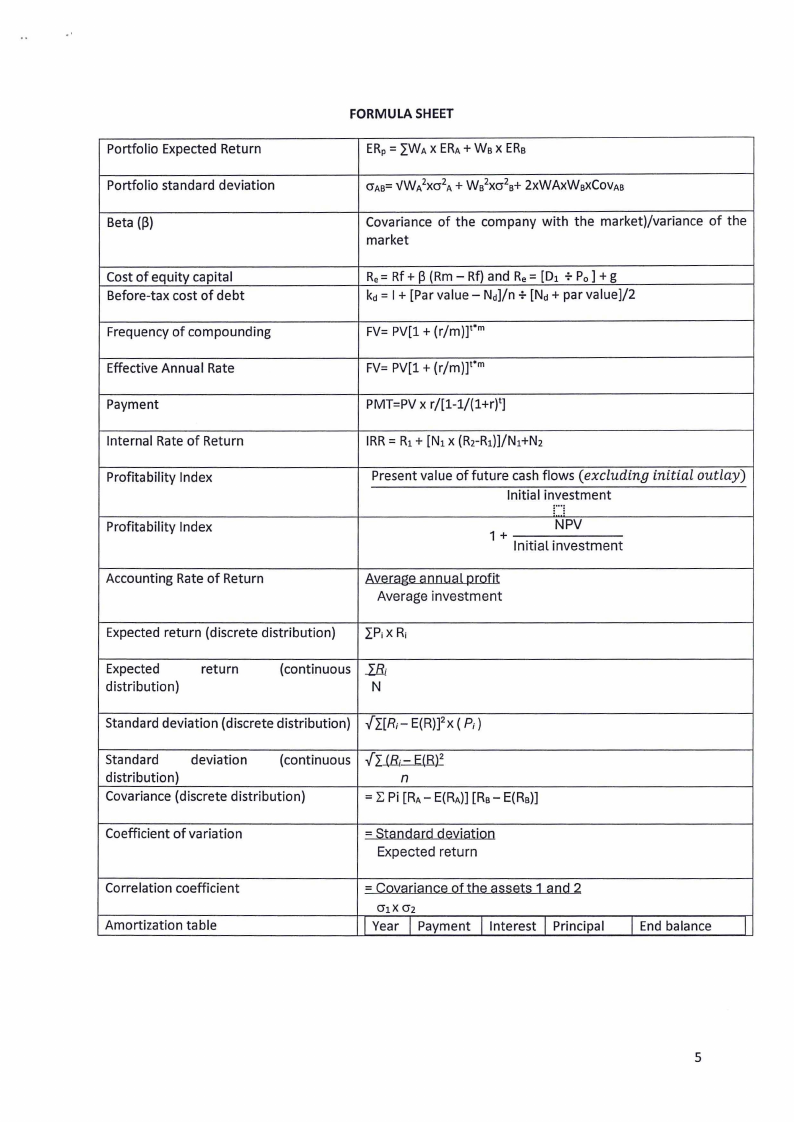
FORMULA SHEET
Portfolio Expected Return
Portfolio standard deviation
ERp= "'j_WAX ERA+Ws X ERs
O"As=vW/xcr 2A+ Ws2xc2rs+ 2xWAxWsXCOVAs
Beta(~)
Covariance of the company with the market)/variance of the
market
Cost of equity capital
Before-tax cost of debt
Re= Rf+~ (Rm-Rf) and Re= [D1 + Po] +g
kd= I+ [Par value - Nd]/n +[Nd+ par value]/2
Frequency of compounding
FV= PV[l + (r/m)fm
Effective Annual Rate
FV= PV[l + (r/m)fm
Payment
PMT=PV x r/[1-1/(l+rJt]
Internal Rate of Return
Profitability Index
Profitability Index
Accounting Rate of Return
IRR= R1+ [N1x (R2-R1)]/N1+N2
Present value of future cash flows (excluding
Initial investment
..
NPV
1 + Ini.tia. l .investment
initial
outlay)
Average investment
Expected return (discrete distribution)
LP;XR;
Expected
distribution)
return
(continuous EL
N
Standard deviation (discrete distribution) lr[R;- E(Rll2x ( P;l
Standard
deviation
(continuous
distribution)
Covariance (discrete distribution)
,f LJ&- E(B)2
n
=~Pi [RA- E(RA)][Rs- E(Rs)]
Coefficient of variation
= S!aodard de~ia!ioo
Expected return
Correlation coefficient
Amortization table
= Co~ariaoce of tbe assets J aod 2
cr1xcr2
I I I I I Year Payment Interest Principal
End balance
I
5
|
|
7 Page 7 |
▲back to top |
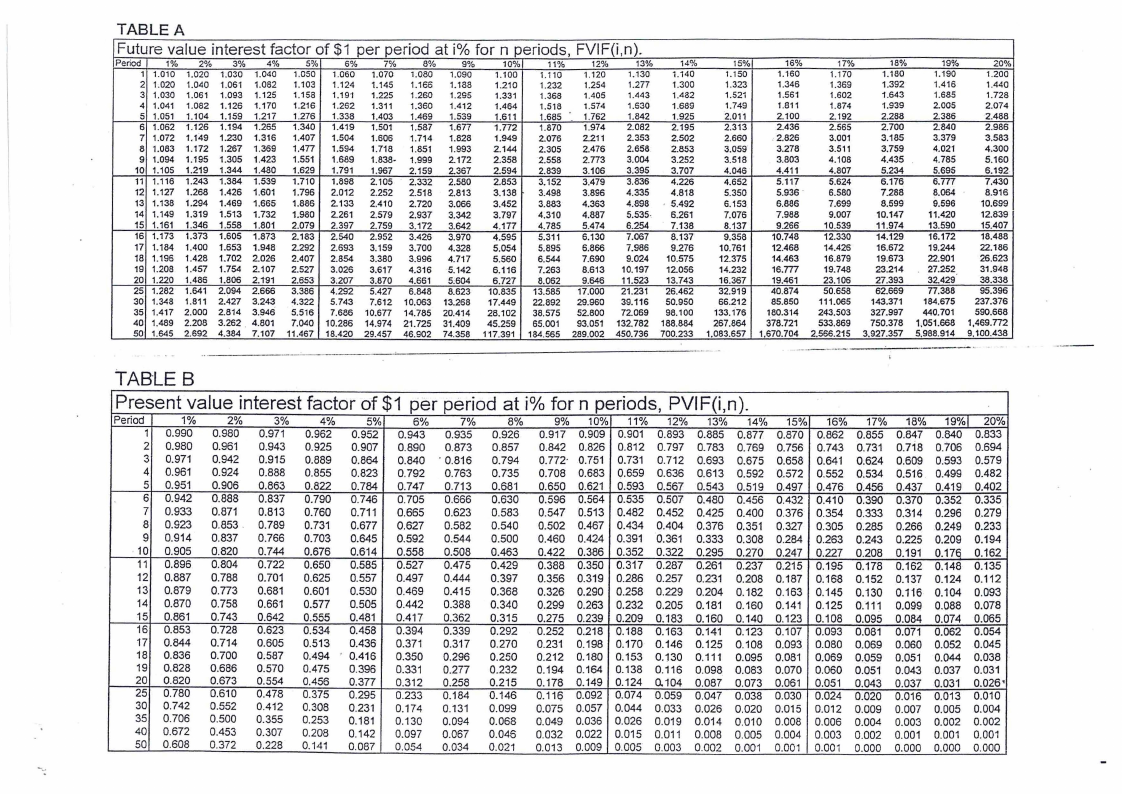
TABLE A
Future value interest factor of $1 per period at i% for n periods, FVIF(i,n).
Period
1%
1 1.010
2 1.020
3 1.030
4 1.041
2%
1.020
1.040
1.061
1.082
3%
1.030
1.061
1.093
1.126
4%
1.040
1.082
1.125
1.170
5%
1.050
1.103
1.158
1.216
6%
1.060
1.124
1.19'1
1.262
7%
1.070
1.145
1.225
1.311
8%
1.080
1.166
1.260
1.360
9%
1.090
1.188
1.295
1.412
10%
1.100
1.210
1.331
1.464
11%
1.110
1.232
1.368
1.518
12%
1.120
1.254
1.405
1.574
13%
1.-130
1.277
1.443
1.630
5 1.051
6 1.062
7 1.072
8 1.063
1.104
1.126
1.149
1.172
1.159
1.194
1.230
1.267
1.217
1.265
1.316
1.369
1.276
1.340
1.407
1.477
1.338
1.419
1.504
1.594
1.403
1.501
1.606
1.718
1.469
1.587
1.714
1.851
1.539
1.677
1.628
1.993
1.611
1.772
1.949
2.144
1.685 ·. 1.762
1.870 1.974
2.076 2.211
2.305 2.476
1.842
2.062
2.353
2.656
9 1.094 1.195 1.305 1.423 1.551 1.689 1.636· 1.999 2.172
10 1.105 1.219 1.344 1.480 1.629 1.791 1.967 2.159 2.367
2.356
2.594
2.556
2.639
2.773
3.106
3.004
3.395
11 1.116 1.243 1.364 1.539 1.710 1.898 2.105 2.332 2.560
12 1.127 1.266 1.426 1.601 1.796 2.012 2.252 2.516 2.813
2.853
3.138
3.152
3.496
3.479
3.696
3.836
4.335
13 1.136
14 1.149
15 1.161
16 1.173
17 1.184
18 1.196
19 1.208
20 1.220
25 1.282
30 1.348
35 1.417
40 1.489
50 1.645
1.294
1.319
1.346
1.373
1.400
1.428
1.457
1.486
1.641
1.811
2.000
2.208
2.692
1.469 1.665
1.513 1.732
1.556 1.801
1.605 1.873
1.653 1.948
1.702 2.026
1.754 2.107
1.806 2.191
2.094 2.666
2.427 3.243
2.814 3.946
3.262 . 4.801
4.384 7.107
1.686
1.960
2.079
2.183
2.292
2.407
2.527
2.653
3.386
4.322
5.516
7.040
11.467
2.133
2.261
2.397
2.540
2.693
2.854
3.026
3.207
4.292
5.743
7.686
10.286
18.420
2.410
2.579
2.759
2.952
3.159
3.380
3.617
3.870
5.427
7.612
10.677
14.974
29.457
2.720
2.937
3.172
3.426
3.700
3.996
4.316
4.661
6.648
10.063
14.785
21.725
46.902
3.066
3.342
3.642
3.970
4.328
4.717
5.142
5,604
8.623
13.268
20.414
31.409
74.358
3.452
3.797
4.177
4.595
5.054
5.560
6.116
6.727
10.835
17.449
28.102
45.259
117.391
3.883
4.310
4.785
5.311
5.895
6.544
7.263
8.062
13.585
22.892
38.575
65.001
184.565
4.363
4.887
5.474
6.130
6.866
7.690
8.613
9.646
17.000
29.960
52.800
93.051
289.002
4.898
5.535-
6.254
7.067
7.986
9.024
10.197
11.523
21.231
39.116
72.069
132.782
450.736
14%
1.140
1.300
1.482
1.689
1.925
2.195
2.502
2.853
3.252
3.707
4.226
4.616
, 5.492
6.261
7.138
8.137
9.276
10.575
12056
13.743
26.462
50.950
98.100
188.864
700.233
15%
1.150
1.323
1.521
1.749
2.011
2.313
2.660
3_059·
3.516
4.046
4.652
5.350
6.153
7.076
6.137
9.358
10.761
12.375
14.232
16.367
32.919
66.212
133.176
267.864
1.083.657
16%
17%
1.160
1.170
1.346
1.369
1.561
1.602
1.811
1.874
2.100
2.192
2.436
2.565
2.826
3.001
3.278
3.511
3.603
4.106
4.411
4.607
5.117
5.624
5.936 · 6.560
6.866
7.699
7.988
9.007
9.266
10.539
10.748
12.330
12.468
14.426
14.463
16.879
16.TT7 19.748
19.461
23.106
40.874
50.658
85.850 111.065
180.314 243.503
378.721 533.869
1.670.704 2.566.215
18%
19%
1.180
1.190
1.392
1.416
1.643
1.685
1.939
2.005
2.288
2.386
2.700
2.640
3.185
3.379
3.759
4.021
4.435 . 4.765
5.234
5.695
6.176
6.TT7
7.288
8.064
8.599
9.596
10.147
11.420
11.974
13.590
14.129
16.172
16.672
19.244
19.673
22.901
23.214
27.252
27.393
32.429
62.669
77.388
143.371 164.675
327.997 440.701
750.378 1,051.668
3.927.357 5,988.914
20%
1.200
1.440
1.728
2.074
2.488
2.966
3.583
4.300
5.160
6.192
7.430
6.916
10.699
12.639
15.407
18.486
22.186
26.623
31.948
38.338
95.396
237.376
590.668
1,469.772
9.100.438
TABLE B
Present value interest factor of $1 per period at io/ofor n periods, PVIF(i,n).
Period
1
2
3
4
5
6
7
8
9
10
11
12
13
14
15
16
17
18
19
20
25
30
35
40
50
1%
0.990
0.980
0.971
0.961
0.951
0.942
0.933
0.923
0.914
0.905
0.896
0.887
0.879
0.870
0.861
0.853
0.844
0.836
0.828
0.820
0.780
0.742
0.706
0.672
0.608
2%
0.980
0.961
0.942
0.924
0.906
0.888
0.871
0.853.
0.837
0.820
0.804
0.788
0.773
0.758
0.743
0.728
0.714
0.700
0.686
0.673
0.610
0.552
0.500
0.453
0.372
3%
0.971
0.943
0.915
0.888
0.863
0.837
0.813
0.789
0.766
0.744
0.722
0.701
0.681
0.661
0.642
0.623
0.605
0.587
0.570
0.554
0.478
0.412
0.355
0.307
0.228
4%
5%
0.962 0.952
0.925 0.907
0.889 0.864
0.855 0.823
0.822 0.784
0.790 0.746
0.760 0.711
0.731 0.677
0.703 0.645
0.676 0.614
0.650 0.585
0.625 0.557
0.601 0.530
0.577 0.505
0.555 0.481
0.534 0.458
0.513 0.436
0.494 ' 0.416
0.475 0.396
0.456 0.377
0.375 0.295
0.308 0.231
0.253 0.181
0.208 0.142
0.141 0.087
6%
0.943
0.890
0.840
0.792
0.747
0.705
0.665
0.627
0.592
0.558
0.527
0.497
0.469
0.442
0.417
0.394
0.371
0.350
0.331
0.312
0.233
0.174
0.130
0.097
0.054
7%
0.935
0.873
· 0.816
0.763
0.713
0.666
0.623
0.582
0.544
0.508
0.475
0.444
0.415
0.388
0.362
0.339
0.317
0.296
0.277
0.258
0.184
0.131
0.094
0.067
0.034
8%
0.926
0.857
0.794
0.735
0.681
0.630
0.583
0.540
0.500
0.463
0.429
0.397
0.368
0.340
0.315
0.292
0.270
0.250
0.232
0.215
0.146
0.099
0.068
0.046
0.021
9% 10% 11% 12% 13% 14% 15% 16% 17% 18% 19%1 20%
0.917 0.909 0.901 0.893 0.885 0.877 0.870 0.862 0.855 0.847 0.840 0.833
0.842 0.826 0.812 0.797 0.783 0.769 0.756 0.743 0.731 0.718 0.706 0.694
0.772· 0.751 0.731 0.712 0.693 0.675 0.658 0.641 0.624 0.609 0.593 0.579
0.708 0.683 Q.659 0.636 0.613 0.592 0.572 0.552 0.534 0.516 0.499 0.482
0.650 0.621 0.593 0.567 0.543 0.519 0.497 0.476 0.456 0.437 0.419 0.402
0.596 0.564 0.535 0.507 0.480 0.456 0.432 0.410 0.390 0.370 0.352 0.335
0.547 0.513 0.482 0.452 0.425 0.400 0.376 0.354 0.333 0.314 0.296 0.279
0.502 0.467 0.434 0.404 0.376 0.351 0.327 0.305 0.285 0.266 0.249 0.233
0.460 0.424 0.391 0.361 0.333 0.308 0.284 0.263 0.243 0.225 0.209 0.194
0.422 0.386 0.352 0.322 0.295 0.270 0.247 0.227 0.208 0.191 0.176 0.162
0.388 0.350 0.317 0.287 0.261 0.237 0.215 0.195 0.178 0.162 0.148 0.135
0.356 0.319 0.286 0.257 0.231 0.208 0.187 0.168 0.152 0.137 0.124 0.112
0.326 0.290 0.258 0.229 0.204 0.182 0.163 0.145 0.130 0.116 0.104 0.093
0.299 0.263 0.232 0.205 0.181 0.160 0.141 0.125 0.111 0.099 0.088 0.Q78
0.275 0.239 0.209 0.183 0.160 0.140 0.123 0.108 0.095 0.084 0.074 0.065
0.252 0.218 0.188 0.163 0.141 0.123 0.107 0.093 0.081 0.071 0.062 0.054
0.231 0.198 0.170 0.146 0.125 0.108 0.093 0.080 0.069 0.060 0.052 0.045
0.212 0.180 0.153 0.130 0.111 0.095 0.081 0.069 0.059 0.051 0.044 0.038
0.194 0.164 0.138 0.116 0.098 0.083 0.070 0.060 0.051 0.043 0.037 0.031
0.178 0.149 0.124 0.104 0.087 0.073 0.061 0.051 0.043 0.037 0.031 0.026•
0.11Ei 0.092 0.074 0.059 0.047 0.038 0.030 0.024 0.020 0.016 0.013 0.010
0.075 0.057 0.044 0.033 0.026 0.020 0.015 0.012 0.009 0.007 0.005 0.004
0.049 0.036 0.026 0.019 0.014 0.010 0.008 0.006 0.004 0.003 0.002 0.002
0.032 0.022 0.015 0.011 0.008 0.005 0.004 0.003 0.002 0.001 0.001 0.001
0.013 0.009 0.005 0.003 0.002 0.001 0.001 0.001 0.000 0.000 0.000 0.000
|
|
8 Page 8 |
▲back to top |
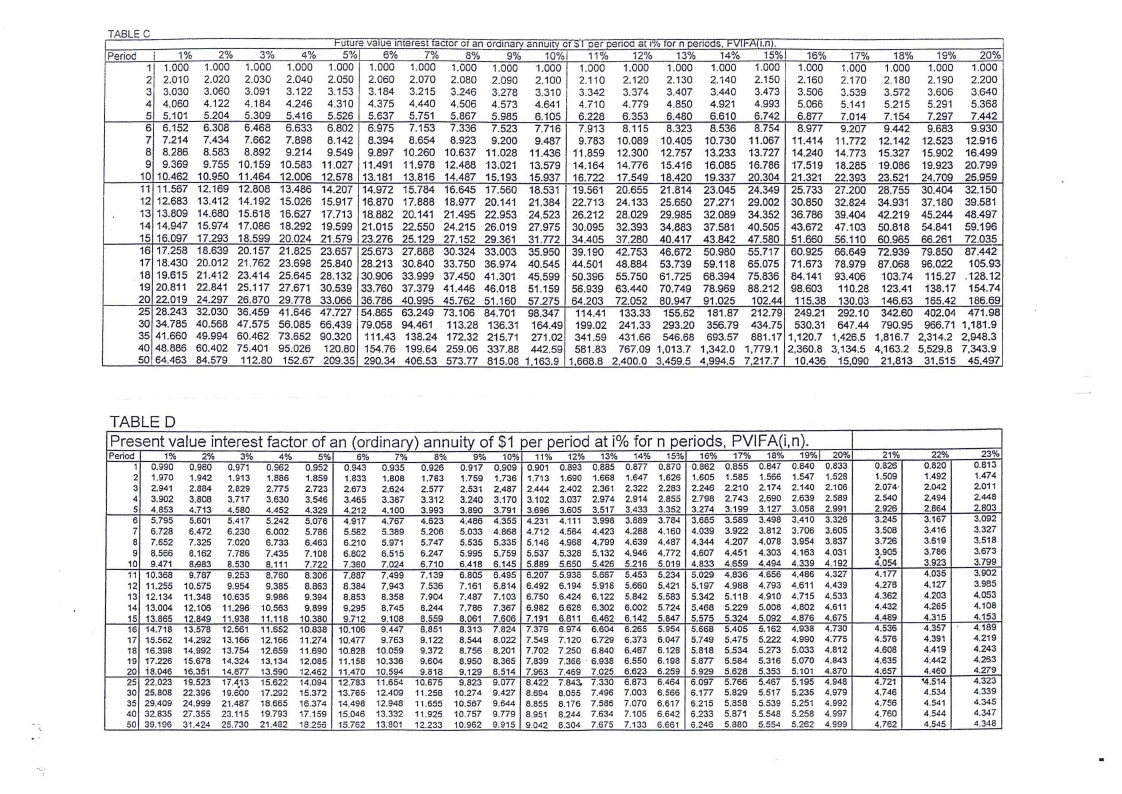
TABLE C
Future va1ue ,merest tactor or an oroinar1 annuity er ::ncer oenoa at 1/o ror nnenons. 1-vlFAl1.n1.
Period i 1% 2% 3% 4~'o 5%1 6% 7% 8% 9% 10%1 11% 12% 13% 14% 15%1 16% 17% 18% 19% 20%
1 1.000 1.000 1.000 1.000 1.000 1.000 1.000 1.000 1.000 1.000 1.000 1.000 1.000 1.000 1.000 1.000 1.000 1.000 1.000 1.000
2 2.010 2.020 2.030 2.040 2.050 2.060 2.070 2.080 2.090 2.100 2.110 2.120 2.130 2.140 2.150 2.160 2.170 2.180 2.190 2.200
3 3.030 3.060 3.091 3.122 3.153 3.184 3.215 3.246 3.278 3.310 3.342 3.374 3.407 3.440 3.473 3.506 3.539 3.572 3.606 3.640
4 4.060 4.122 4.184 4.246 4.310 4.375 4.440 4.506 4.573 4.641 4.710 4.779 4.850 4.921 4.993 5.066 5.141 5.215 5.291 5.368
5 5.101 5.204 5.309 5.416 5.526 5.637 5.751 5.867 5.985 6.105 6.228 6.353 6.480 6.610 6.742 6.877 7.014 7.154 7.297 7.442
6 6.152 6.308 6.468 6.633 6.802 6.975 7.153 7.336 7.523 7.716 7.913 8.115 8.323 8.536 8.754 8.977 9.207 9.442 9.683 9.930
7 7.214 7.434 7.662 7.898 8.142 8.394 8.654 8.923 9.200 9.487 9.783 10.089 10.405 10.730 11.067 11.414 11.772 12.142 12.523 12.916
8 8.286 8.583 8.892 9.214 9.549 9.897 10.260 10.637 11.028 11.436 11.859 12.300 12.757 13.233 13.727 14.240 14.773 15.327 15.902 16.499
9 9.369 9.755 10.159 10.583 11.027 11.491 11.978 1-2.488 13.021 13.579 14.164 14.776 15.416 16.085 16.786 17.519 18.285 19.086 19.923 20.799
10 10.462 10.950 11.464 12.006 12.578 13.181 13.816 14.487 15.193 15.937 16.722 17.549 18.420 19.337 20.304 21.321 22.393 23.521 24.709 25.959
11 11.567 12.169 12.808 13.486 14.207 14.972 15.784 16.645 17.560 18.531 19.561 20.655 21.814 23.045 24.349 25.733 27.200 28.755 30.404 32.150
12 12.683 13.412 14.192 15.026 15.917 16.870 17.888 18.977 20.141 21.384 22.713 24.133 25.650 27.271 29.002 30.850 32.824 34.931 37.180 39.581
13 13.809 14.680 15.618 16.627 17.713 18.882 20.141 21.495 22.953 24.523 26.212 28.029 29.985 32.089 34.352 36.786 39.404 42.219 45.244 48.497
14 14.947 15.974 17.086 18.292 19.599 21.015 22.550 24.215 26.019 27.975 30.095 32.393 34.883 37.581 40.505 43.672 47.103 50.818 54.841 59.196
15 16.097 17.293 18.599 20.024 21.579 23.276 25.129 27.152 29.361 31.772 34.405 37.280 40.417 43.842 47.580 51.660 56.110 60.965 66.261 72.035
16 17.258 18.639 20.157 21.825 23.657 25.673 27.888 30.324 33.003 35.950 39.190 42.753 46.672 50.980 55.717 60.925 66.649 72.939 79.850 87.442
17 18.430 20.012 21.762 23.698 25.840 28.213 30.840 33.750 36.974 40.545 44.501 48.884 53.739 59.118 65.075 71.673 78.979 87.068 96.022 105.93
18 19.615 21.412 23.414 25.645 28.132 30.906 33.999 37.450 41.301 45.599 50.396 55.750 61.725 68.394 75.836 84.141 93.406 103.74 115.27 .128.12
19 20.811 22.841 25.117 27.671 30.539 33.760 37.379 41.446 46.018 51.159 56.939 63.440 70.749 78.969 88.212 98.603 110.28 123.41 138.17 154.74
20 22.019 24.297 26.870 29.778 33.066 36.786 40.995 45.762 51.160 57.275 64.203 72.052 80.947 91.025 102.44 115.38 130.03 146.63 165.42 186.69
25 28.243 32.030 36.459 41.646 47.727 54.865 63.249 73.106 84.701 98.347 114.41 133.33 155.62 181.87 212.79 249.21 292.10 342.60 402.04 471.98
30 34.785 40.568 47.575 56.085 66.439 79.058 94.461 113.28 136.31 164.49 199.02 241.33 293.20 356.79 434.75 530.31 647.44 790.95 966.71 1,181.9
35 41.660 49.994 60.462 73.652 90.320 111.43 138.24 172.32 215.71 271.02 341.59 431.66 546.68 693.57 881.17 1,120.7 1,426.5 1,816.7 2,314.2 2,948.3
40 48.886 60.402 75.401 95:026 120.80 154.76 199.64 259.06 337.88 442.59 581.83 767.09 1,013.7 1,342.0 1,779.1 2,360.8 3,134.5 4,163.2 5,529.8 7,343.9
50 64.463 84.579 112.80 152.67 209.35 290.34 406.53 573.77 815.08 1,163.9 1,668.8 2,400.0 3,459.5 4,994.5 7,217.7 10.436 15,090 21.813 31,515 45.497
TABLED
Present value interest factor of an (ordinary) annuity of $1 per period at i% for n periods, PVIFA(i,n).
Period
1
2
3
4
5
6
7
8
1%
0.990
1.970
2.941
3.902
4.853
5.795
6,728
7.652
2%
0,980
1,942
2.884
3.808
4.713
5.601
6.472
7.325
3%
0.971
1.913
2.829
3.717
4.580
5,417
6.230
7.020
4%
0.962
1.886
2.n5
3.630
4,452
5.242
6.002
6.733
5%
0.952
1.859
2.723
3.546
4.329
5.076
5.786
6.463
6%
0.943
1.833
2.673
3.465
4.212
4,917
5.562
6.210
7%
0.935
1.808
2,624
3.387
4.100
4.767
5.389
5.971
8%
0.926
1.783
2.5n
3.312
3.993
4.623
5.206
5.747
9%
0.917
1.759
2.531
3.240
3.890
4.486
5.033
5.535
10%
0,909
1.736
2.487
3.170
3.791
4,355
4.868
5.335
11%
0.901
1.713
2.444
3.102
3.696
4.231
4.712
5.146
12%
0,893
1.690
2.402
3,037
3.605
4.111
4,564
4.968
13%
0.885
1.668
2.361
2.974
3.517
3.998
4.423
4.799
14%
0.877
1.647
2.322
2.914
3.433
3.889
4,288
4.639
15~'<> 16%
0.870 0.862
1.626 1.605
2.283 2.246
2.855 2.798
3.352 3.274
3,784 3.685
4,160 4.039
4.487 4,344
17%
0.855
1.585
2.210
2.743
3.199
3.589
3.922
4.207
18%
0.847
1.566
2.174
2.690
3.127
3.498
3.812
4,078
19%1 20%
0.840 0.833
1.547 1.528
2.140 2.106
2.639 2.589
3,058 2.991
3.410 3.326
3.706 3.605
3.954 3,837
9 8,566
10 9.471
8.162
8:983
7.786
8,530
7.435
8.111
7.108
7.722
6.802
7.360
6,515
7.024
6,247
6.710
5.995 5,759 5.537 5.328 5.132 4.946 4.772 4.607 4.451 4.303 4.163 4.031
6.418 6.145 5.889 5,650 5.426 5.216 5.019 4.833 4.659 4.494 4.339 4.192
11 10,368 9,787 9.253 8.760 8.306 7.887 7.499 7.139 6.805 6.495 6.207 5.938 5.687 5.453 5.234 5.029 4,836 4.656 4.486 4.327
12 11.255 10.575 9.954 9.385 8.863 8.384 7,943 7.536 7.161 6.814 6.492 6.194 5.916 5.660 5.421 5.197 4.988 4.793 4.611 4.439
13 12.134 11.348 10,635 9.986 9.394 8.853 8.358 7.904 7.487 7.103 6.750 6.424 6.122 5,842 5.583 5.342 5.118 4.910 4.715 4.533
14 13.004 12.106 11.296 10.563 9.899 9.295 8,745 8.244 7.786 7.367 6.982 6.628 6.302 6.002 5.724 5.468 5.229 5.008 4.802 4.611
15 13.865 12.849 11.938 11.118 10.380 9.712 9.108 8.559 8.061 7.606 7.191 6.811 6.462 6.142 5.847 5.575 5.324 5.092 4.876 4.675
16 14.718 13.578 12.561 11.552 10.838 10.106 9.447
17 15.562 14.292 13.166 12.166 11.274 10.4TT 9.763
8.851
9.122
8.313 7.824 7.379 6.974 6.604 6.265 5.954 5.668 5.405 5.162 4.938 4.730
8.544 8.022 7.549 7.120 6.729 6.373 6.047 5.749 5.475 5.222 4.990 4.n5
18 16.398 14.992 13.754 12.659 11.690 10.828 10.059 9.372 8.756 8.201 7.702 7.250 6.840 6.467 6.128 5.818 5.534 5.273 5.033 4.812
19 17.226 15.678 14,324 13.134 12.085 11.158 10.336 9.604 8.950 8.365 7.839 7.366 · 6.938 6.550 6.198 5.877 5.584 5.316 5.070 4.843
20 18.046 16.351 14.8TT 13.590 12.462 11.470 10.594 9.818 9.129 8.514 7,963 7.469 7.025 6,623 6.259 5.929 5.628 5,353 5.101 4,870
25 22.023 19,523 17.413 15.622 14.094 12.783 11.654 10.675 9.823
8.422 7.843, 7.330 6.873 6.464 6.097 5.766 5.467 5.195 4.948
30 25.808 22.396 19.600 17.292 15.372 13.765 12.409 11.258 10.274 9.427 8.694 8.055 7.496 7.003 6.566 6.177 5.829 5.517 5.235 4.979
35 29.409 24.999 21.487 18.665 16.374 14.498 12.948 11,655 10.567 9.644 8,855 8.1i6 7,586 7.070 6.617 6.215 5.858 5.539 5,251 4.992
40 32.835 27.355 23.115 19.793 17.159 15.046 13.332 11.925 10.757 9.779 8.951 8.244 7.634 7.105 6.642 6.233 5,871 5.548 5.258 4.997
50 39.196 31.424 25.730 21.482 18,256 15.762 13.801 12.233 10.962 9.915 9.042 8.304 7.675 7.133 6.661 6.246 5,880 5,554 5,262 4.999
21%
0.826
1.509
2.074·
2.540
2.926
3.245
3.508
3.726
3.905
4.054
4,177
4.278
4.362
4.432
4.489-
4.536
4.576
4.608
4.635
4.657
4.721
4.746
4,756
4.760
4.762
22%
0.820
1.492
2.042
2.494
2.864
3.167
3.416
3.619
3.786
3.923
4.035
4.127
4.203
4.265
4.315
4.357
4.391
4.419
4.442
4.460
•4.514
4.534
4,541
4,544
4.545
23%
0.813
1.474
2.011
2.448
2.803
3.092
3.327
3,518
3.673
3.799
3.902
3.985
4.053
4.108
4.153
4.189
4.219
4.243
4.263
4,279
4.323
4,339
4.345
4.347
4,348
-~
'