


 |
ECM712S-ECONOMETRICS -2ND OPP-JULY 2022 |
|
|
1 Page 1 |
▲back to top |
FAcuLTvoFHEALTHAND
DEPARTMENT OF
nAm1s1A un1vERSITY
OF SCIEnCE Ano TECHn
ECONOMICSAND FINANCE
APPLIEDSCIENCES
ACCOUNTING,
QUALIFICATION: BACHELOROF ECONOMICS
QUALIFICATION CODE: 07BECO
LEVEL: 7
COURSECODE: ECM712s
COURSENAME: ECONOMETRICS
SESSION:June 2022
PAPER:THEORY
DURATION: 3 HOURS
MARKS: 100
SECONDOPPORTUNITY EXAMINATION QUESTION PAPER
EXAMINER(S} MR. PINEHAS NANGULA
MODERATOR: Dr R. KAMAT!
INSTRUCTIONS
1. Answer ALL the questions in section A and B
2. Write clearly and neatly.
3. Number the answers clearly.
PERMISSIBLEMATERIALS
1. Scientific calculator
2. Pen and Pencil
3. Ruler
THIS QUESTION PAPERCONSISTSOF _5_ PAGES{Including this front page)
|
|
2 Page 2 |
▲back to top |
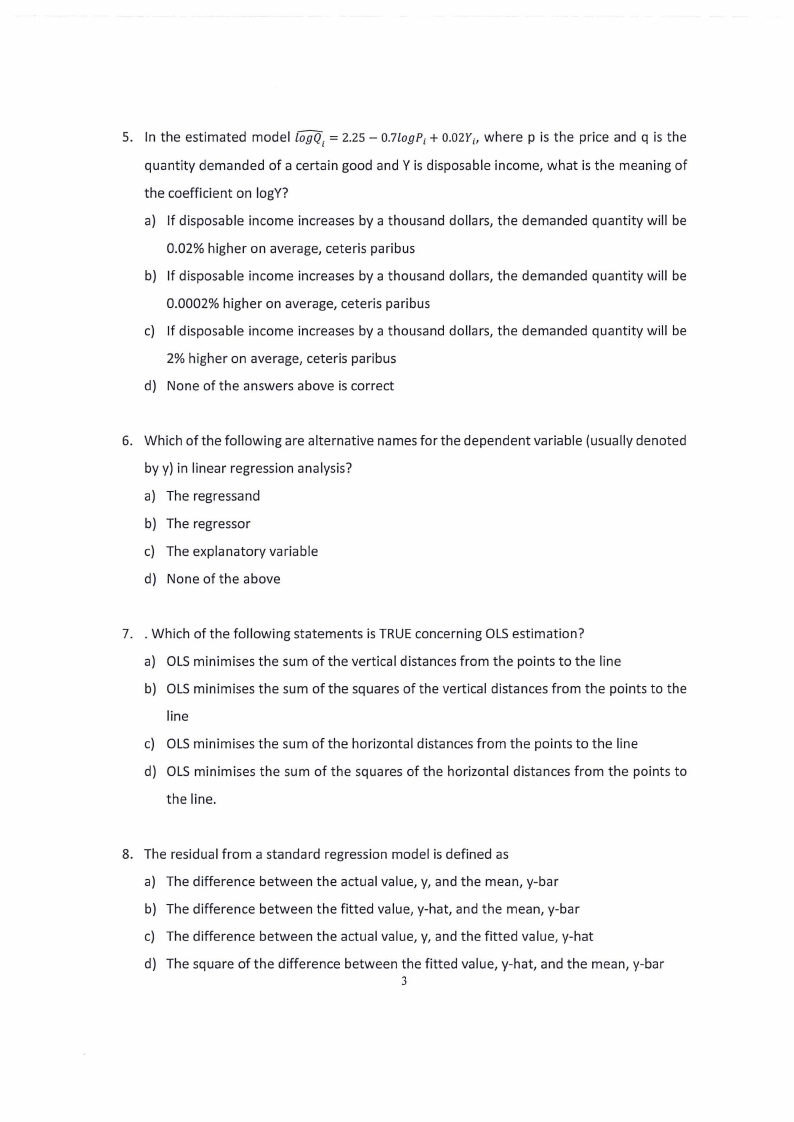
SECTION A
MULTIPLE CHOICE QUESTIONS
1. OLSstands for what in Econometrics?
a) Optimally Linearized Solution
b) There is no such thing in Econometrics
c) The only rock band that Econometricians are crazy about
d) Ordinary Least Squares
[20 MARKS]
2. Data collected at a point in time is called
a) Cross-sectional data
b) Time series data
c) Pooled data
d) Panel data
3. Data collected for a variable over a period of time is called
a) Cross-sectional data
b) Time series data
c) Pooled data
d) Panel data
4. In the estimated model logQ. = 2.25 - 0.7logP; + 0.02Y;, where pis the price and q is the
I
quantity demanded of a certain good and Y is disposable income, what is the meaning of
the coefficient on logP?
a) If the price increases by 1%, the demanded quantity will be 0.007% lower on average,
ceteris paribus
b) If the price increases by 1%, the demanded quantity will be 70% lower on average,
ceteris paribus
c) If the price increases by 1%, the demanded quantity will be 0.7% lower on average,
ceteris paribus
d) None of the answers above is correct
2
|
|
3 Page 3 |
▲back to top |
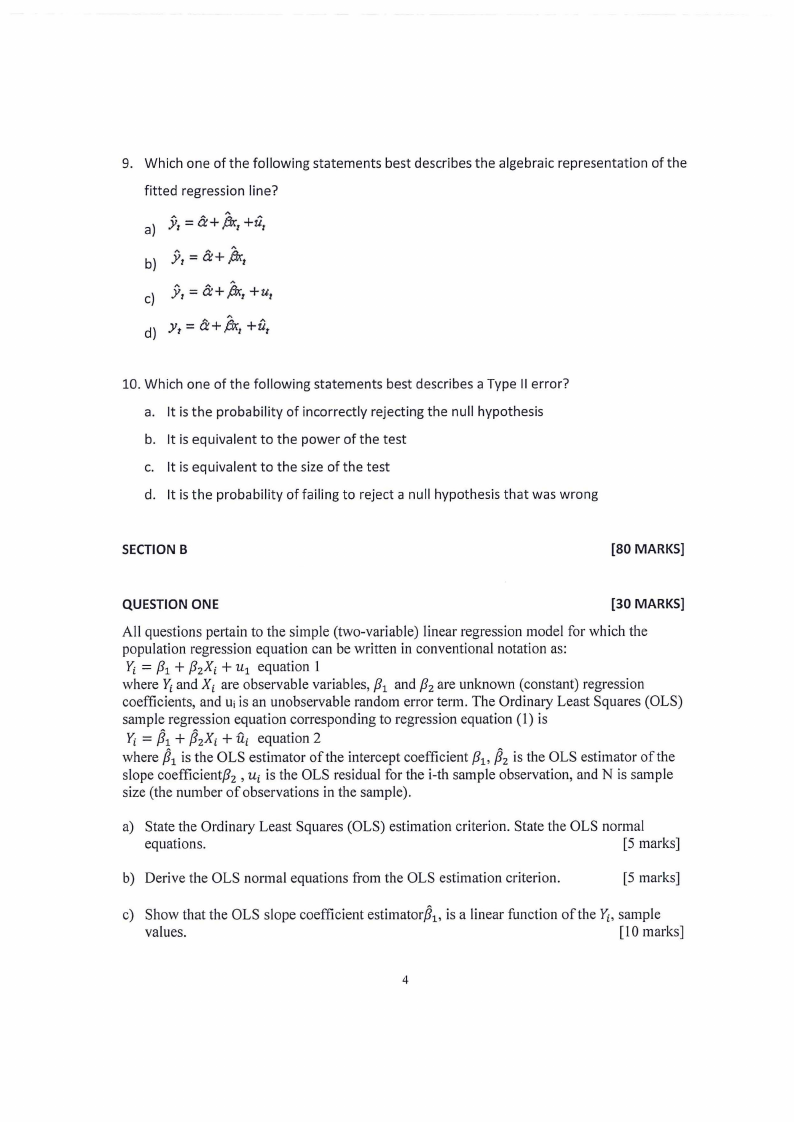
5. In the estimated model logQ. = 2.25 - 0.7logP; + 0.02Y;, where p is the price and q is the
I
quantity demanded of a certain good and Y is disposable income, what is the meaning of
the coefficient on logY?
a) If disposable income increases by a thousand dollars, the demanded quantity will be
0.02% higher on average, ceteris paribus
b) If disposable income increases by a thousand dollars, the demanded quantity will be
0.0002% higher on average, ceteris paribus
c) If disposable income increases by a thousand dollars, the demanded quantity will be
2% higher on average, ceteris paribus
d) None of the answers above is correct
6. Which of the following are alternative names for the dependent variable (usually denoted
by y) in linear regression analysis?
a) The regressand
b) The regressor
c) The explanatory variable
d) None of the above
7. . Which of the following statements is TRUEconcerning OLSestimation?
a) OLSminimises the sum of the vertical distances from the points to the line
b) OLSminimises the sum of the squares of the vertical distances from the points to the
line
c) OLSminimises the sum of the horizontal distances from the points to the line
d) OLS minimises the sum of the squares of the horizontal distances from the points to
the line.
8. The residual from a standard regression model is defined as
a) The difference between the actual value, y, and the mean, y-bar
b) The difference between the fitted value, y-hat, and the mean, y-bar
c) The difference between the actual value, y, and the fitted value, y-hat
d) The square of the difference between the fitted value, y-hat, and the mean, y-bar
3
|
|
4 Page 4 |
▲back to top |
9. Which one of the following statements best describes the algebraic representation of the
fitted regression line?
al Yt= a+fkr+ut
b) Yr=a+1kt
c) Yr=a+'Ar+u1
10. Which one of the following statements best describes a Type II error?
a. It is the probability of incorrectly rejecting the null hypothesis
b. It is equivalent to the power of the test
c. It is equivalent to the size of the test
d. It is the probability of failing to reject a null hypothesis that was wrong
SECTION B
[80 MARKS]
QUESTION ONE
[30 MARKS]
All questions pertain to the simple (two-variable) linear regression model for which the
population regression equation can be written in conventional notation as:
Yi = {31 + {J2Xi + u1 equation 1
where Yi and Xi are observable variables, {31 and {32 are unknown (constant) regression
coefficients, and Ui is an unobservable random error term. The Ordinary Least Squares (OLS)
sample regression equation corresponding to regression equation (1) is
1'i= /J1 + /J2Xi + ui equation 2
where /J1 is the OLS estimator of the intercept coefficient {31, /J2 is the OLS estimator of the
slope coefficient{J 2 , ui is the OLS residual for the i-th sample observation, and N is sample
size (the number of observations in the sample).
a) State the Ordinary Least Squares (OLS) estimation criterion. State the OLS normal
equations.
[5 marks]
b) Derive the OLS normal equations from the OLS estimation criterion.
[5 marks]
c) Show that the OLS slope coefficient estimator/J 1, is a linear function of the Yi, sample
values.
[10 marks]
4
|
|
5 Page 5 |
▲back to top |
d) Stating explicitly all required assumptions, prove that the OLS slope coefficient estimator
/J2 is an unbiased estimator of the slope coefficient ,62'•
[l Omarks]
QUESTION TWO
[20 MARKS]
a) What do we mean by a linear regression model?
(4 marks]
b) The following are linear intrinsically linear regression models. You are required to
transform them into linear regression models
i.
(4 marks]
ii.
xz
iii. Y-=----
' exp (P 1+P 2X;+u;)
iv.
[4 marks]
(4 marks]
(4 marks]
QUESTION TWO
[20 MARKS]
The following is the econometric model which is presented in four different forms. You are
require to interpret each of them.
a) C= - 8.078 +0.706411ncome
(5 marks]
b) C= - 18.072+22.73841Loglncome
(5 marks]
c) logC= 7.203+0.0002181ncome
(5 marks]
d) logC= - 0.2957+1.0464Logincome
(5 marks]
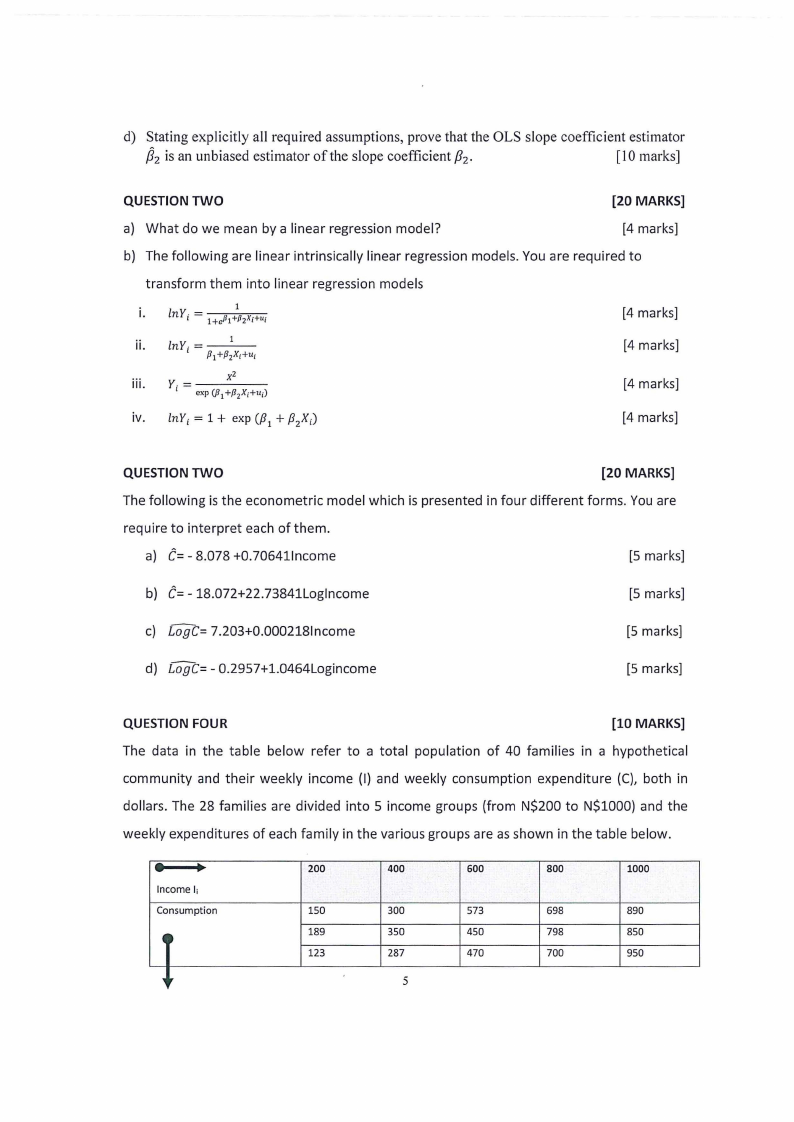
QUESTION FOUR
[10 MARKS]
The data in the table below refer to a total population of 40 families in a hypothetical
community and their weekly income (I) and weekly consumption expenditure (C), both in
dollars. The 28 families are divided into 5 income groups (from N$200 to N$1000) and the
weekly expenditures of each family in the various groups are as shown in the table below .
• ..
Income I;
200
400
600
800
1000
Consumption
0
150
300
573
698
890
189
350
450
798
850
123
287
470
700
950
H'
5
|
|
6 Page 6 |
▲back to top |
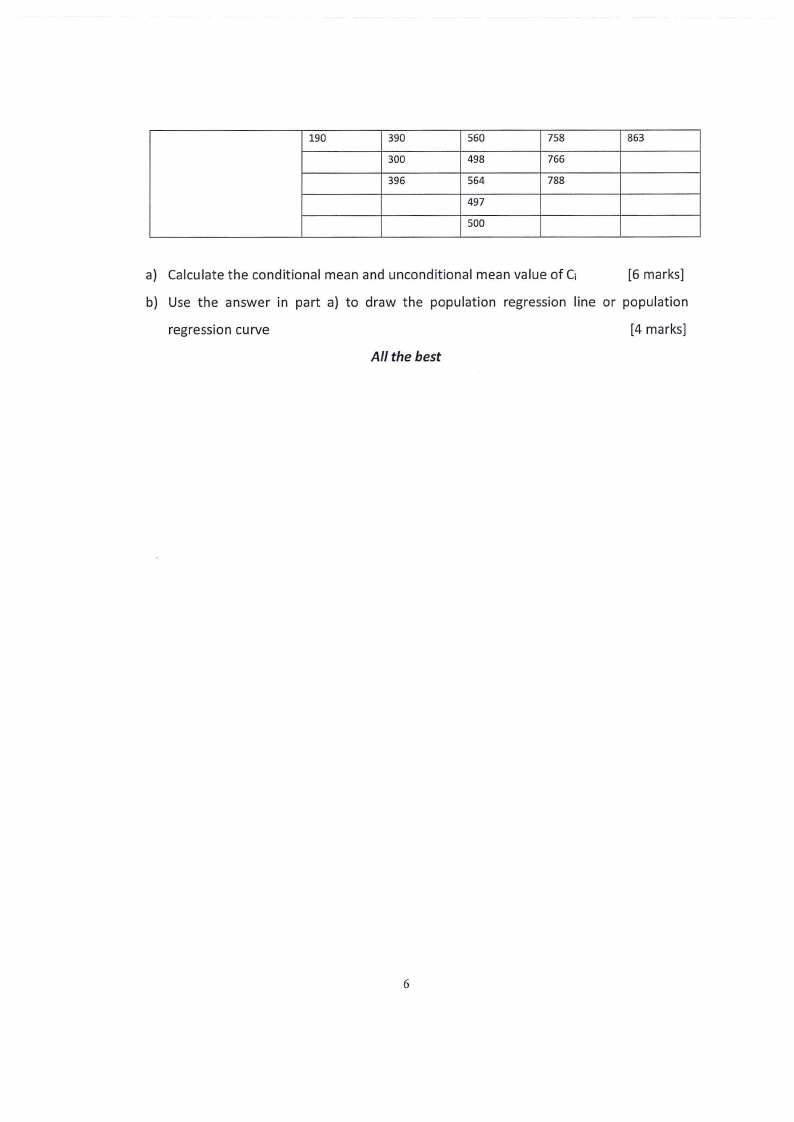
190
390
560
758
863
300
498
766
396
564
788
497
500
a) Calculate the conditional mean and unconditional mean value of C;
[6 marks]
b) Use the answer in part a) to draw the population regression line or population
regression curve
[4 marks]
All the best
6