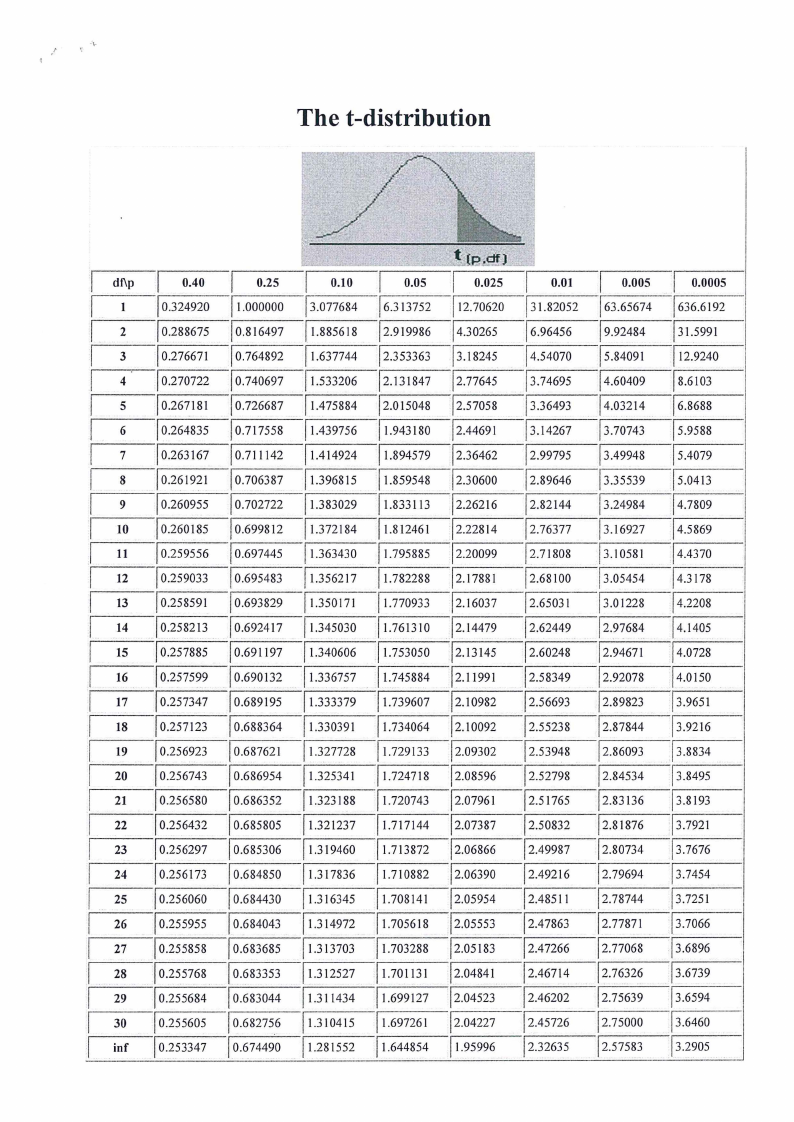
SMS701S - SURVEY METHODS AND SAMPLING TECHNIQUES - 1ST OPP - JUNE 2022


SMS701S - SURVEY METHODS AND SAMPLING TECHNIQUES - 1ST OPP - JUNE 2022


1 Page 1

▲back to top


NAMIBIA UNIVERSITY
OF SCIENCE AND TECHNOLOGY
FACULTY OF HEALTH AND APPLIED SCIENCES
DEPARTMENT OF MATHEMATICS AND STATISTICS
QUALIFICATION: BACHELOR OF SCIENCES APPLIED MATHEMATICS AND STATISTICS
QUALIFICATION CODE: 07BAMS
LEVEL: 7
COURSE CODE: SMS701S
COURSE NAME: SURVEY METHODS AND
SAMPLING TECHNIQUES
SESSION: JUNE 2022
DURATION: 3 HOURS
PAPER: THEORY
MARKS: 100
EXAMINER
FIRST OPPORTUNITY EXAMINATION QUESTION PAPER
Mr. J. J. SWARTZ
MODERATOR:
Dr. I. NEEMA
INSTRUCTIONS
1. Answer ALL the questions in the booklet provided.
2. Show clearly all the steps used in the calculations.
3. All written work must be done in blue or black ink and sketches must
be done in pencil.
PERMISSIBLE MATERIALS
1. Non-programmable calculator without a cover.
ATTACHMENTS
1. Normal distribution table
2. T-table
THIS QUESTION PAPER CONSISTS OF 6 PAGES (Including this front page)
1

2 Page 2

▲back to top


QUESTION 1 [25 MARKS]
1.1 Provide a diagrammatically representation of a survey from a process perspective. [6]
1.2 Define the following terms:
1.2.1 A random variable
[1]
1.2.2 Sampling unit
[1]
1.2.3 Population parameter
[1]
1.2.4 Random Sample
[1]
1.2.5 Statistical modeling
[1]
1.3 In the 2015 Namibia Income and Expenditure survey, the following data was collected
from households. Write the appropriate variable type for each one of the variables and
indicate what type of estimates that can be produced from the data.
1.3.1 Total monthly household expenditure
[2]
1.3.2 Age in completed years of household heads
[2]
1.3.3 Marital status of household heads
[2]
1.4 A questionnaire is a data collection tool used to collect data in all survey-based studies.
Please state the three important sections in the structure of the questionnaire and
elaborate on the type of information collected in the information section.
[4]
1.5 Personal interviews is one of the approaches of gathering survey data, provide two
advantages and two disadvantages of personal interviews.
[4]
QUESTION 2 [25 MARKS]
2.1 State the four major sampling designs in probability sampling?
[4]
2.2 The Ministry of Health and Social Services wants to estimate the rate of incidence of
respiratory disorders among the middle-aged male and female smokers in Namibia. How
large a sample should be taken to be 95% confident that the error of estimation of the
proportion of the population with such disorders does not exceed 0.05? The true value of p
is expected to be near 0.20.
[4]
2.3 Surveys, which cover most real life situations, are multi-purpose. Thus, units within a
stratum may be alike for certain major characteristics but may be very different for other
characteristics. In such situations, strata must be formed with primary interest on major
survey characteristics. Provide three other reasons for stratification.
[3]

3 Page 3

▲back to top


2.4 The following data was collected from a random sample of 20 households of a certain
community consisting of 250 households. Assume the population distributions are close to
a normal distribution.
Table 1: Sample data
Household
Sex of head:
ID
1=Female, 2=Male
1
1
2
2
3
2
4
1
5
2
6
2
7
2
8
1
9
2
10
1
11
2
12
1
13
1
14
2
15
2
16
2
17
2
18
1
19
2
20
1
Household
size
8
2
3
5
4
5
1
i
3
10
2
3
2
1
2
5
6
2
1
3
Monthly
household
(NS)
150
245
450
120
300
200
500
175
275
200
250
550
500
230
250
580
600
350
450
500
income
2.4.1 Compute the estimates for the proportions (in %) of male and female headed households in this
community.
[2]
2.4.2 Calculate estimates for the average household size of the female and male headed
households in this community.
[2]
2.4.3 Estimate the total monthly income of this community based on the sample data.
[3]
2.4.4 Calculate the standard error of the estimated total monthly income in (2.4.3)
[3]
2.4.5 Construct a 95% confidence interval for the total monthly income of this population
[3]
2.4.6 Comment about the monthly incomes of the female and male headed households.
[1]

4 Page 4

▲back to top


QUESTION 3 [25 MARKS]
3.1. Data can be classified by its scales of measurement. State the four scales of measurements
and explain the difference between them.
[4]
3.2. State the properties of estimators and illustrate the property unbiasedness of an estimator
using the following information: A population consists of N = 6 HH’s. Select a sample of n = 2
HH’s to estimate the average HH size and the total number of persons in the households in the
population.
[11]
Population
U1
U2
U3
U4
US
U6
unit— Ui
| Household
size — Yi
3.3 Select a random sample of 10 elements from the following list using the random
number table given below:
These serial numbers below indicate a list of 20 households:
123 4 5 67 8 9 10 11 12 13 14 15 16 17 18 19 20
|
Random number table:
55 09 79 15 11 56 65 88 08 16 96 95 33 17 60 45 81 31 50 46 79|
19 16 49 99 08 80 01 56 35 41 42 72 58 20 39 33 53 85 26
|
[4]
3.4 A population consists of N = 5,000 persons. A Simple Random Sample, without
replacement of n = 50 included 10 persons of Khoisan descent.
3.4.1 Calculate a 95% confidence interval for P, the proportion of persons of Khoisan descent
in the population.
[3]
3.4.2 Suppose we would like to estimate P the proportion of persons of Khoisan
descent to within +3% with 95% confidence. What sample size is necessary? (Assume
P to be 0.5).
[3]

5 Page 5

▲back to top


QUESTION 4 [25 MARKS]
4.1 The two common forms of scanning techniques are the optical character reader (OCR)
and optical mark reader (OMR). What are the advantages of OMR systems over other types
of data entry, particularly where time and accuracy are important?
[5]
4.2 You have been approached by a client, Ministry of Health and Social Services to process
the 2013 DHS PLUS data and are required to estimate the number of working days you will
take to enter 10, 000 questionnaires.
Assumptions:
(i) Ten percent of the equipment may not be operational at any point in time because
of mechanical breakdown or operator absence.
(ii) Five percent of the data will have to be rekeyed because of errors encountered in
verification.
(iii) Keying of manual corrections during editing will be the equivalent of five percent of the
original workload.
The following information is provided:
e 10 x data entry stations
e 2 x shifts of data entry operators
e 7 x productive hours per work
e 10 x operators
e Average of 8,000 strokes per hour
e 10,000 questionnaires
e 2,500 strokes per questionnaires
e 100 percent verification
[10]
4.3. You were asked by a client to analyze the 2009/10 Namibia Household Income and
Expenditure Survey data. The following table and figure were produced from the data.
Please write a short narrative or interpretation for the tables below on what they are
depicting.
4.3.1 Table 2: Dependency ratios for 2008 and 2012
Age group
0-14
2008
Nuriher
682 286
Dependency
ratio
71.1
2012
Herabar
767 557
Dependency
ratio
64.4
65+
102 614
10.7
106 904
9.0
Total
784 900
81.8
874 461
73.4
[5]

6 Page 6

▲back to top


4.3.2 Table 3: Population by sex and age group
Age group
Female
Male
Number %
Number %
00-04
139287 12.9 135161
13.8
05-09
125157 11.6 124931
12.7.
10-14
122151 11.3 121727
12.4
15-19
128 831 11.9 120609
12.3.
20-24
108 224 10.0
97 720
9.9
25-29
89582 8.3
77 201
7.9
30-34
74899 6.9
67 550
6.9
35-39
59482 5.5
55 844
5.7
40-44
51240 4.7
39 868
4.1
45-49
42182 3.9
34 276
3.5
50-54
32321
3.0
28 161
29
55-59
25720
2.4
21 223
2.2
60-64
21586 2.0
17 514
1.8
65-69
16662 1.5
13 154
1.3
70-74
13370 1.2
9 286
0.9
75-79
10923 1.0
7735
0.8
80-84
8576 0.8
4 239
0.4
85-89
6326 0.6
2 261
0.2
90-94
2902 0.3
1 209
0.1
95+
2122 0.2
709
0.1
Not Stated
1805 0.2
2 458
0.3
1 083
Total
347 100 982836
100
Both sexes
Number %
274520
13.3
250159
12.1
243878
11.8
249440
12.1
206016
10.0
166783
8.1
142449
6.9
115326
5.6
91 108
4.4
76 457
3.7
60 482
29
46 943
2.3
39 100
1.9
29 816
1.4
22 656
1.1
18 658
0.9
12 815
0.6
8 588
0.4
4110
0.2
2 831
0.1
4 263
0.2
2 066
398
100
Sex ratio
97.0
99.8
99.7
93.6
90.3
86.2
90.2
93.9
77.8
81.3
87.1
82.5
81.1
78.9
69.5
70.8
49.4
35.7
41.7
33.4
136.2
90.7
[5]
FERRER ERE BER
RK
KKK AK KAKA KEE NYS) OF PAPER * ## #4 FREE E ARE AEAKAAARKAKEE
TOTAL MARKS: 100

7 Page 7

▲back to top


STANDARD NORMAL DISTRIBUTION: Table Values Represent AREA to the LEFT of the Z score.
Z
.00
01
02
.03
.04
05
06
07
.08
09
0.0 | .50000
50399
50798
51197
51595
51994
52392
52790
53188
53586
0.1 | .53983
54380
54776
55172
55567
55962
56356
56749
57142
57535
0.2 | .57926
58317
.58706 59095,
59483
59871
.60257
.60642
.61026 .61409
0.3 | .61791
.62172
.62552
.62930
.63307
.63683
.64058
.64431
.64803
.65173
0.4 | .65542
.65910
.66276
66640
_.67003
.67364
.67724
.68082
68439
.68793
0.5 | .69146 .69497 .69847 70194 ~~ .70540 .70884 .71226 .71566 .71904 .72240
0.6 | .72575
.72907
73237
.73565
.73891
74215
74537
74857
.75175
.75490
0.7 | .75804
.76115
.76424
.76730
.77035
77337
.77637
77935
78230
78524
0.8 | .78814
.79103
79389
.79673
79955
.80234
80511
.80785
81057
81327
0.9 | .81594
81859
82121
82381
82639
82894
83147
83398
83646
83891
1.0 | .84134
84375
84614
84849
85083
85314
85543
85769
85993
86214
1.1 | .86433
86650
86864
.87076
.87286
87493
87698
.87900
.88100
88298
1.2 | .88493
88686
88877
89065
89251
89435
89617
89796 = .89973
90147
1.3} .90320
90490
90658
90824
.90988
91149
91309
91466
91621
91774
1.4 | .91924
92073
92220
92364
92507
92647
92785
92922
93056
93189
1.5 | .93319
93448
93574
93699
93822
93943
.94062
94179
94295
.94408
1.6 | .94520
.94630
94738
94845
94950
95053
95154
95254
99352
95449
1.7 | .95543
95637
95728
95818
95907
95994
.96080
.96164
.96246
96327
1.8 | .96407
96485
96562
.96638
.96712
.96784
96856
.96926
96995
.97062
1.9 | .97128
97193
97257
97320
97381
97441
97500
97558
97615
.97670
2.0 | .97725
97778
97831
97882
97932
97982
98030
98077
98124
98169
2.1 | .98214
98257
98300
98341
98382
98422
98461
98500
98537
98574
2.2 | .98610
.98645
.98679
.98713
98745
98778
98809
98840
.98870
98899
2.3 | .98928
98956
98983
99010
99036
.99061
.99086
99111
99134
99158
2.4 | .99180
99202
99224
99245
99266
99286
99305
99324
99343
99361
2.5 | .99379
99396
99413
99430
99446
99461
99477
99492
99506
99520
2.6 | .99534
99547
99560 = .99573
99585
99598
.99609
99621
99632
99643
2.7 | .99653
99664
99674
99683
99693
99702
99711
99720
99728
99736
2.8 | .99744 997/52
.99760 99767
99774
99781
99788
99795
99801
99807
2.9 | .99813
99819
99825
9983 | 99836
99841
99846
99851
99856
99861
3.0 | .99865
99869
99874
99878
99882
99886
99889
99893
99896
99900
3.1 | .99903
.99906
99910
99913
99916
99918
99921
99924
.99926 99929
3.2} .99931
99934
99936
99938
99940 99942
99944
99946
=—.99948 99950
3.3 | .99952
99953
99955
99957
99958
.99960
99961
99962
99964
99965
3.4 | .99966
99968
99969
99970
99971
99972
99973
99974
99975
99976
3.5 | .99977
.99978
99978
99979
99980
99981
99981
99982
99983
99983
3.6 | .99984
99985
99985
99986
99986
99987
99987
99988
99988
99989
3.7 | .99989
99990
99990
99990
99991
9999]
99992
99992
99992
99992
3.8 | .99993
99993
99993
99994
99994
99994
99994
99995
99995
99995
3.9 | .99995
99995
99996
99996
.99996
99996
99996
99996
99997
99997

8 Page 8

▲back to top


STANDARD NORMAL DISTRIBUTION: Table
Z
00
01
02
03
-3.9 | .00005
.00005
.00004
.00004
-3.8 | .00007
.00007
.00007
.00006
-3.7 | .00011
.00010
.00010
.00010
-3.6 | .00016
.00015
.00015
.00014
-3.5 | .00023
.00022
00022
00021
-3.4 | .00034
.00032
00031
.00030
-3.3 | .00048
.00047
00045
.00043
-3.2 | .00069
.00066
.00064
.00062
-3.1 | .00097
.00094
.00090
.00087
-3.0 | .00135
.00131
00126
00122
-2.9 | .00187
.00181
.00175
.00169
-2.8 | .00256
.00248
00240
.00233
-2.7 | .00347
-2.6 | .00466
00336
.00453
00326
00440
00317
00427
-2.5 | .00621
.00604
00587
.00570
-2.4 | .00820
.00798
.00776
00755
-2.3 | .01072
.01044
.01017
.00990
-2.2 | .01390
01355
01321
01287
-2.1 | .01786
.01743
.01700
01659
-2.0 | .02275
.02222
02169
02118
-1.9 | .02872
.02807
02743
.02680
-1.8 | .03593
.03515
.03438
.03362
-1.7 | .04457
.04363
04272
04182
-1.6 | .05480
.05370
05262
.05155
-1.5 | .06681
.06552
06426
.06301
-1.4 | .08076
.07927
.07780
.07636
-1.3 | .09680
09510
09342
.09176
-1.2 | .11507
11314
11123
.10935
-1.1 | .13567
.13350
13136
12924
-1.0 | .15866
15625
15386
15151
-0.9 | .18406
18141
17879
.17619
-0.8 | .21186
.20897
.20611
.20327
-0.7 | .24196
.23885
.23576
.23270
-0.6 | .27425
.27093
.26763
.26435
-0.5 | 30854
30503
30153
.29806
-0.4 | .34458
34090
33724
33360
-0.3 | .38209
37828
37448
37070
-0.2 | .42074
41683
41294
40905
-0.1 | .46017
45620
45224
44828
-0.0 | .50000
49601
49202
48803
Values Represent
.04
05
.00004
.00004
.00006
.00006
.00009
.00009
00014
.00013
.00020
.00019
.00029
.00028
00042
.00040
.00060
.00058
00084
.00082
00118
.00114
00164
00159
00226
00219
.00307
00415
00298
00402
00554
00539
.00734
00714
00964
.00939
01255
.01222
01618
01578
.02068
.02018
02619
02559
.03288
03216
.04093
.04006
.05050
04947
06178
06057
.07493
.07353
09012
08851
.10749
.10565
12714
12507
14917
14686
.17361
.17106
.20045
.19766
22965
.22663
.26109
25785
29460
29116
32997
32636
36693
36317
40517
40129
44433
44038
.48405
48006
AREA to the LEFT
06
07
.00004
.00004
.00006
.00005
.00008
.00008
.00013
.00012
00019
.00018
.00027
.00026
.00039
.00038
.00056
.00054
00079
.00076
00111
.00107
00154
.00149
00212
.00205
00289
.00391
00280
00379
.00523
00508
.00695
.00676
.00914
00889
01191
.01160
01539
01500
01970
.01923
02500
02442
03144
.03074
.03920
03836
04846
.04746
05938
05821
.07215
.07078
.08691
08534
10383
10204
12302
12100
14457
14231
.16853
.16602
19489
19215
22363
.22065
.25463
25143
.28774
28434
32276
31918
35942
35569
39743
39358
43644
43251
47608
47210
of the Z score.
.08
09
.00003
.00003
.00005
.00005
.00008
.00008
.00012
00011
.00017
00017
00025
.00024
.00036
.00035
.00052
.00050
.00074
.00071
00104
.00100
00144
00139
00199
00193
.00272
.00368
.00264
00357
00494
00480
.00657
.00639
.00866
00842
.01130
01101
01463
01426
.01876
01831
02385
02330
.03005
.02938
.03754
.03673
04648
04551
.05705
05592
06944
.06811
08379
.08226
10027
09853
.11900
11702
14007
13786
.16354
.16109
18943
18673
.21770
.21476
.24825
.24510
.28096
.27760
31561
31207
35197
34827
38974
38591
42858
42465
46812
46414

9 Page 9

▲back to top


The t-distribution
| dtp | o40
| 1 [0.324920
| 2 [0.288675
| 3 [0.276671
| 4 — [0.270722
| 5 [0.267181
| 6 — [0.264835
| 7 [0.263167
| 8 [0.261921
| 9 [0.260955
| 10 [0.260185
| 1 — [0.259556
| 12 [0.259033
| 13 [0.258591
| 14 [0.258213
| 18 [0.257885
| 16 — [0.257599
| 17 [0.257347
| 18 [0.257123
| 19 [0.256923
| 20 — [0.256743
| 21 [0.256580
| 22 0.256432
| 23 [0.256297
| 24 [0.256173
| 25 [0.256060
| 26 — [0.255955
| 27 [0.255858
| 28 [0.255768
| 29 = [0.255684
| 30 [0.255605
[int — [0.253347
| 025
[1.000000
| 0.816497
| 0.764892
| 0.740697
| 0.726687
[0.717558
[0.711142
[0.706387
| 0.702722
[0.699812
| 0.697445
| 0.695483
| 0.693829
[0.692417
[0.691197
[0.690132
[0.689195
[0.688364
0.687621
| 0.686954
[0.686352
|o.6sssos.
| 0.685306
[0.684850
0.684430
[0.684043
[0.683685
[0.683353
[0.683044
[0.682756
[0.674490
| o10
[3.077684
|1.885618
| 1.637744
| 1.533206
| 1.475884
[1.439756
| 1.414924
1.396815
| 1.383029
[1.372184
| 1.363430
1.356217
| 1.350171
| 1.345030
|1.340606
[1.336757
| 1.333379
| 1.330391
| 1.327728
[1.325341
| 1.323188
[1.321237
| 1.319460
| 1.317836
[1.316345
1.314972
[1.313703
[1.312527
[1.311434
[1.310415
[1.281552
| 005 | 0025 | 0.01 | 0.005
| 6.313752 | 12.70620 |31.82052 [63.65674
{2.919986 [4.30265 [6.96456 9.92484
|2.353363 [3.18245 [4.54070 [5.84091
[2.131847 |2.77645 [3.74695 [4.60409
{2.015048 [2.57058 3.36493 [4.03214
| 1.943180 |2.44691 [3.14267 [3.70743
| 1.894579 [2.36462 [2.99795 [3.49948
| 1.859548 [2.30600 [2.89646 [3.35539
| 1.833113 [2.26216 = [2.82144 [3.24984
[1.812461 [2.22814 [2.76377 |3.16927
| 1.795885 [2.20099 [2.71808 + -|3.10581
{1.782288 [2.17881 [2.68100 —|3.05454
| 1.770933 [2.16037 {2.65031 [3.01228
[1.761310 [2.14479 [2.62449 [2.97684
[1.753050 [2.13145 [2.60248 [2.94671
| 1.745884 2.11991 {2.58349 += -[2.92078
[1.739607 [2.10982 [2.56693 [2.89823
[1.734064 + |2.10092 [2.55238 [2.87844
[1.729133 [2.09302 [2.53948 ~—|2.86093
| 1.724718 [2.08596 [2.52798 += [2.84534
[1.720743 [2.07961 [2.51765 [2.83136
[1.717144 [2.07387 [2.50832 [2.81876
| 1.713872 2.06866 [2.49987 [2.80734
[1.710882 {2.06390 [2.49216 [2.79694
| 1.708141 [2.05954 2.48511 ‘| 2.78744
[1.705618 [2.05553 [2.47863 [2.77871
[1.703288 [2.05183 [2.47266 | 2.77068
{1.701131 [2.04841 [2.46714 [2.76326
[1.699127 [2.04523 |2.46202 2.75639
[1.697261 |2.04227 [2.45726 [2.75000
[1.644854 | 1.95996 [2.32635 |2.57583
| 0.0005
| 636.6192
| 31.5991
| 12.9240
[8.6103
| 6.8688
| 5.9588
[5.4079
[5.0413
| 4.7809
| 4.5869
[4.4370
| 4.3178
| 4.2208
[4.1405
| 4.0728
| 4.0150
[3.9651
[3.9216
[3.8834
[3.8495
| 3.8193
3.7921
[3.7676
| 3.7454
3.7251
| 3.7066
| 3.6896
‘| 3.6739
| 3.6594
| 3.6460
—|3.2908