


 |
IMA612S-INTERMEDIATE MACROECONOMICS-2ND OPP-JAN 2025 |
|
|
1 Page 1 |
▲back to top |
n Am I BI A u n IVE Rs ITY
OF SCIEnCE Ano TECHnOLOGY
FACULTY OF COMMERCE, HUMAN SCIENCE AND EDUCATION
DEPARTMENT OF ECONOMICS, ACCOUNTING AND FINANCE
QUALIFICATION : BACHELOR OF ECONOMICS
QUALIFICATION CODE:
07BECO
LEVEL: 7
COURSE CODE: IMA612S
COURSE NAME: INTERMEDIATE
MACROECONOMICS
SESSION: JANUARY 2025
DURATION: 3 HOURS
PAPER: THEORY
MARKS: 100
SECOND OPPORTUNITY QUESTION PAPER
EXAMINER(S) MR. P. NANGULA
Ms. N N Shitenga
MODERATOR
INSTRUCTIONS
1. Answer ALL questions.
2. Number your answers in accordance with the question paper.
3. Write clearly and legibly
PERMISSIBLE MATERIALS
1. Pen
2. Ruler
3. Calculator
THIS QUESTION PAPER CONSISTS OF _3_ PAGES (Including this front page)
|
|
2 Page 2 |
▲back to top |
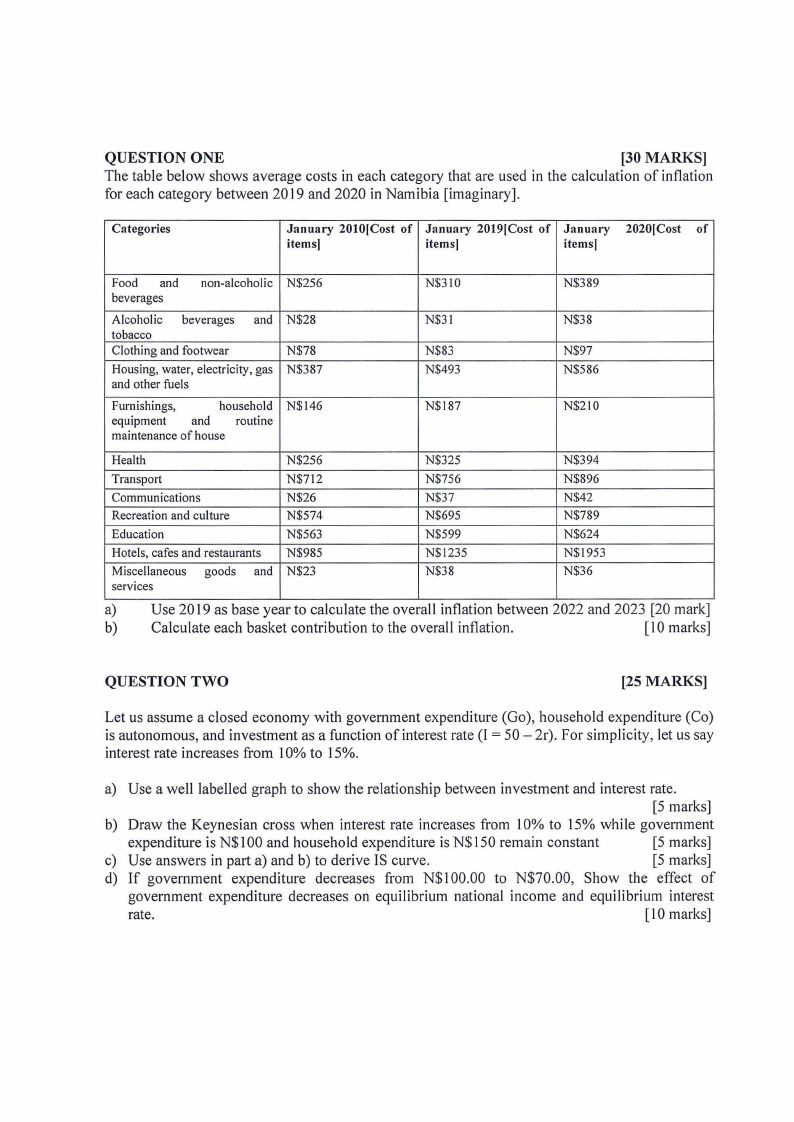
QUESTION ONE
[30 MARKS]
The table below shows average costs in each category that are used in the calculation of inflation
for each category between 2019 and 2020 in Namibia [imaginary].
Categories
January 2010[Cost of January 2019[Cost of January 2020[Cost of
items)
items)
items!
Food and
beverages
non-alcoholic
Alcoholic beverages and
tobacco
Clothing and footwear
Housing, water, electricity, gas
and other fuels
Furnishings,
household
equipment and routine
maintenance of house
N$256
N$28
N$78
N$387
N$146
N$310
N$31
N$83
N$493
N$187
N$389
N$38
N$97
N$586
N$210
Health
Transport
Communications
Recreation and culture
Education
Hotels, cafes and restaurants
Miscellaneous goods and
services
N$256
N$712
N$26
N$574
N$563
N$985
N$23
N$325
N$756
N$37
N$695
N$599
N$1235
N$38
N$394
N$896
N$42
N$789
N$624
N$1953
N$36
a) Use 2019 as base year to calculate the overall inflation between 2022 and 2023 [20 mark]
b) Calculate each basket contribution to the overall inflation.
[ 10 marks]
QUESTION TWO
[25 MARKS]
Let us assume a closed economy with government expenditure (Go), household expenditure (Co)
is autonomous, and investment as a function of interest rate (I= 50 - 2r). For simplicity, let us say
interest rate increases from 10% to 15%.
a) Use a well labelled graph to show the relationship between investment and interest rate.
[5 marks]
b) Draw the Keynesian cross when interest rate increases from 10% to 15% while government
expenditure is N$100 and household expenditure is N$150 remain constant
[5 marks]
c) Use answers in part a) and b) to derive IS curve.
[5 marks]
d) If government expenditure decreases from N$ 100.00 to N$70.00, Show the effect of
government expenditure decreases on equilibrium national income and equilibrium interest
rate.
[ 10 marks]
|
|
3 Page 3 |
▲back to top |
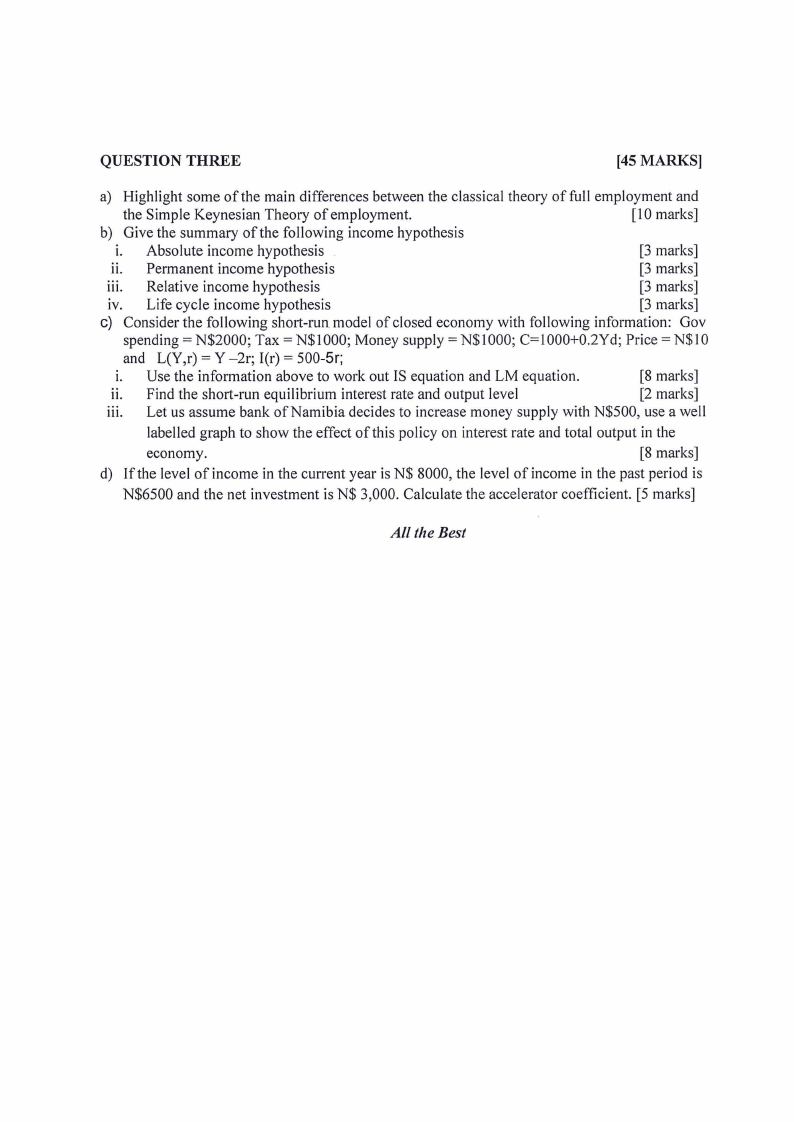
QUESTION THREE
[45 MARKS]
a) Highlight some of the main differences between the classical theory of full employment and
the Simple Keynesian Theory of employment.
[10 marks]
b) Give the summary of the following income hypothesis
1. Absolute income hypothesis
[3 marks]
11. Permanent income hypothesis
[3 marks]
iii. Relative income hypothesis
[3 marks]
iv. Life cycle income hypothesis
[3 marks]
c) Consider the following short-run model of closed economy with following information: Gov
spending = N$2000; Tax = N$ l 000; Money supply = N$ l 000; C= I 000+0.2Y d; Price = N$ l 0
and L(Y,r) = Y -2r; l(r) = 500-5r;
1. Use the information above to work out IS equation and LM equation.
[8 marks]
11. Find the short-run equilibrium interest rate and output level
[2 marks]
iii. Let us assume bank of Namibia decides to increase money supply with N$500, use a well
labelled graph to show the effect of this policy on interest rate and total output in the
economy.
[8 marks]
d) If the level of income in the current year is N$ 8000, the level of income in the past period is
N$6500 and the net investment is N$ 3,000. Calculate the accelerator coefficient. [5 marks]
All the Best