


 |
SAT802S - SAMPLING THEORY - 2ND OPP - JAN 2023 |
|
|
1 Page 1 |
▲back to top |
nAm I BIA un1VERSITY
OF SCIEnCE Ano TECHnOLOGY
FACULTYOF HEALTHAND APPLIEDSCIENCES
DEPARTMENTOF MATHEMATICSAND STATISTICS
QUALIFICATION:BACHELOROF SCIENCEHONOURS IN APPLIED STATISTICS
QUALIFICATION CODE:
08BSHS
LEVEL: 8
COURSECODE: SAT802S
COURSE:SAMPLING THEORY
SESSION: JANUARY 2023
PAPER: THEORY
DURATION: 3 Hours
MARKS: 100
SUPPLEMENTARY/SECONDOPPORTUNITYEXAMINATION QUESTION PAPER
EXAMINER
Mr. J. J. SWARTZ
MODERATOR:
Dr. I. NEEMA
INSTRUCTIONS
1. Answer ALL the questions in the booklet provided.
2. Show clearly all the steps used in the calculations.
3. All written work must be done in blue or black ink and sketches must be done in pencil.
PERMISSIBLEMATERIALS
1. Calculator
2. Pen and Clean Paper for calculations
THIS QUESTION PAPERCONSISTSOF 4 PAGES(Including this front page)
|
|
2 Page 2 |
▲back to top |
Question 1 [25 marks]
1.1. What is meant by the sampling distribution of a statistic?
[S]
1.2. Select all the 20 samples of size three from the population of six students in Table
2.1, below without replacement. From each sample, find the 95% confidence limits for
the population mean of the math scores with the known population variance and its
estimates; use the normal deviate Z = 1.96 in both cases.
1.2.1 For both the procedures, find the proportion of the confidence intervals
enclosing the actual population mean, that is, the coverage probability.
[10]
1.2.2 Compare the average of the confidence widths obtained with the estimates of
variance with the exact width for the case of known variance.
[10]
Table 2.1. SAT verbal and math scores.
Student
1
2
3
4
5
6
Total
Mean
Variance
u-2
g,
s
C.V. (%)
Verbal
X;
520
690
500
580
530
480
3300
550
4866.67
5840
76.42
13.89
Math
Y;
670
720
650
720
560
700
4020
670
3066.67
3680
60.66
9.05
C.V. = coefficient. of vn:rialion.
Question 2 [28 marks]
2.1. Provide and explain four basic criteria for the acceptability of a sampling method? [8]
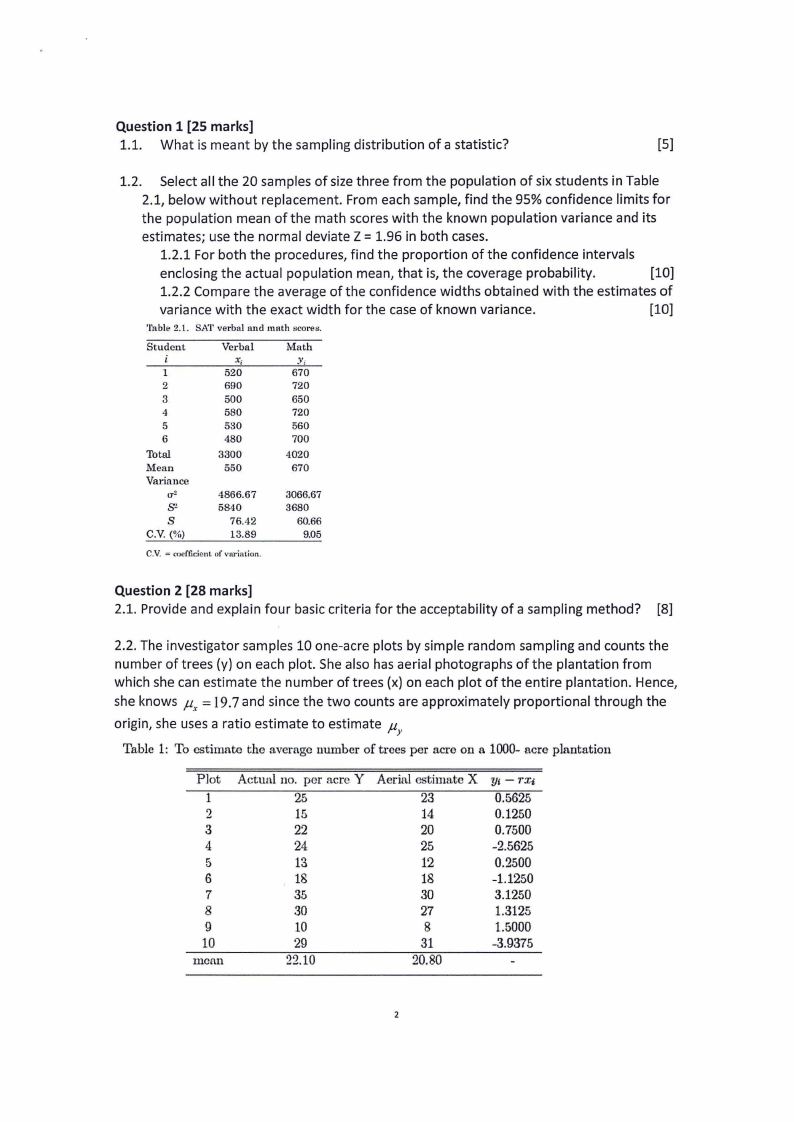
2.2. The investigator samples 10 one-acre plots by simple random sampling and counts the
number of trees {y) on each plot. She also has aerial photographs of the plantation from
which she can estimate the number of trees {x) on each plot of the entire plantation. Hence,
she knows A= 19.7 and since the two counts are approximately proportional through the
origin, she uses a ratio estimate to estimate µY
Table 1: To estimate the average number of trees per acre on a 1000- acre plantation
Plot
1
2
3
4
5
6
7
8
9
10
mean
Actual no. per acre Y Aerial estimate X
25
23
15
14
22
20
24
25
13
12
18
18
35
30
30
27
10
8
29
31
22.10
20.80
Yi -TXi
0.5625
0.1250
0.7500
-2.5625
0.2500
-1.1250
3.1250
1.3125
l.5000
-3.9375
|
|
3 Page 3 |
▲back to top |
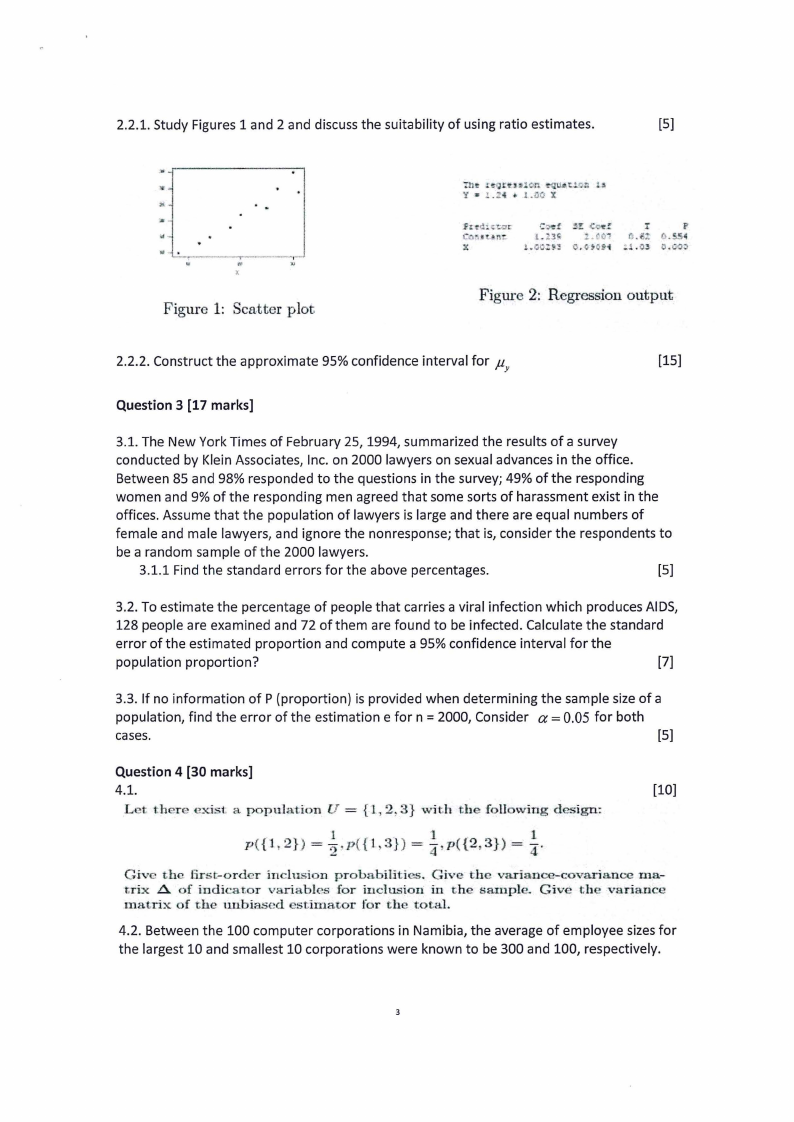
2.2.1. Study Figures 1 and 2 and discuss the suitability of using ratio estimates.
[5]
.. "-'-'•~--~---,-·
X
"
Figme 1: Scatter plot
• t: r1:QtU'! or:. • 'UAt:.!. 12 1
Y • !.Z• l.00 X
C ! .!?: C<i~!'
:r
p
l- .. 3'- :;..co; 11~6-: 0~ 4
l. :.s-~
!ti : .ll:} .G-OJ
Figure 2: Regression output
2.2.2. Construct the approximate 95% confidence interval for µY
[15]
Question 3 [17 marks]
3.1. The New York Times of February 25, 1994, summarized the results of a survey
conducted by Klein Associates, Inc. on 2000 lawyers on sexual advances in the office.
Between 85 and 98% responded to the questions in the survey; 49% of the responding
women and 9% of the responding men agreed that some sorts of harassment exist in the
offices. Assume that the population of lawyers is large and there are equal numbers of
female and male lawyers, and ignore the nonresponse; that is, consider the respondents to
be a random sample of the 2000 lawyers.
3.1.1 Find the standard errors for the above percentages.
[5]
3.2. To estimate the percentage of people that carries a viral infection which produces AIDS,
128 people are examined and 72 of them are found to be infected. Calculate the standard
error of the estimated proportion and compute a 95% confidence interval for the
population proportion?
[7]
3.3. If no information of P (proportion) is provided when determining the sample size of a
population, find the error of the estimation e for n = 2000, Consider a= 0.05 for both
cases.
[5]
Question 4 [30 marks]
4.1.
[10]
Let there e.xis1, a population U = p, 2, 3} wit,h the following design:
Give the first-order inclu i n probabiUti ·. Give the variance-covariance
ma-
trix A of indicator variables for inclusion in the sample. Give the variance
matrix of -che unbiased estirr1at.or for the total.
4.2. Between the 100 computer corporations in Namibia, the average of employee sizesfor
the largest 10 and smallest 10 corporations were known to be 300 and 100, respectively.
3
|
|
4 Page 4 |
▲back to top |
For a sample of 20 from the remaining 80 corporations, the mean and standard deviation
were 250 and 110, respectively. For the total employee size of the 80 corporations, find the
a) Estimate,
[3]
b) S.E.of the estimate, and
[3]
c) 95% confidence limits.
[5]
4.3. Write a short description on the importance of the normal distribution in sampling
theory
[5]
4.4. Write at least 4 properties of the normal probability distribution.
[4]
*** ************************************END OF EXAMINATION*********************************
4