


 |
AMS602S - APPLIED MATHEMATICAL AND STATISTICAL COMPUTING - 2ND OPP - JANUARY 2025 |
|
|
1 Page 1 |
▲back to top |
nAm I BIA UnlVERS ITV
OF SCIEnCEAno TECHno LOGY
FacultyofHealthN, atural
ResourceasndApplied
Sciences
Schoool f NaturalandApplied
Sciences
Departmentof Mathematics,
StatisticsandActuarialScience
13JacksonKaujeuaStreet
PrivateBag13388
Windhoek
NAMIBIA
T: +264612072913
E: msas@nust.na
W: www.nust.na
QUALIFICATION: BACHELOR of SCIENCE IN APPLIED MATHEMATICS AND STATISTICS
QUALIFICATIONCODE: 07BSAM
LEVEL:6
COURSE:APPLIED MATHEMATICAL AND STATISTICAL
COMPUTING
COURSECODE: AMS602S
DATE: JANUARY 2025
SESSION: 1
DURATION: 3 HOURS
MARKS: 100
SECOND OPPORTUNITY/ SUPPLEMENTARY: EXAMINATION QUESTION PAPER
EXAMINER:
MODERATOR:
Mr. Jan Johannes Swartz
Mr. Simon Kashihalwa
INSTRUCTIONS:
1. Answer all the questions using MATLAB R2007b and IBM SPSSStatistics 29 software
on your computer into the z-drive
2. Create a MS Word document in your z-drive on your computer. Copy your results
from MATLAB R2007b and IBM SPSSStatistics 29 in the MS Word document and
save the MS Word file containing your student number, e.g. 2001349.
3. No books, notes and other additional aids are allowed.
4. Mark all answers clearly with their respective question numbers.
PERMISSIBLE MATERIALS:
1. Computer with MATLAB R2007b, IBM SPSSStatistics 28 and MS Office software
ATTACHEMENTS
1. None
This paper consists of 6 pages including this front page
|
|
2 Page 2 |
▲back to top |
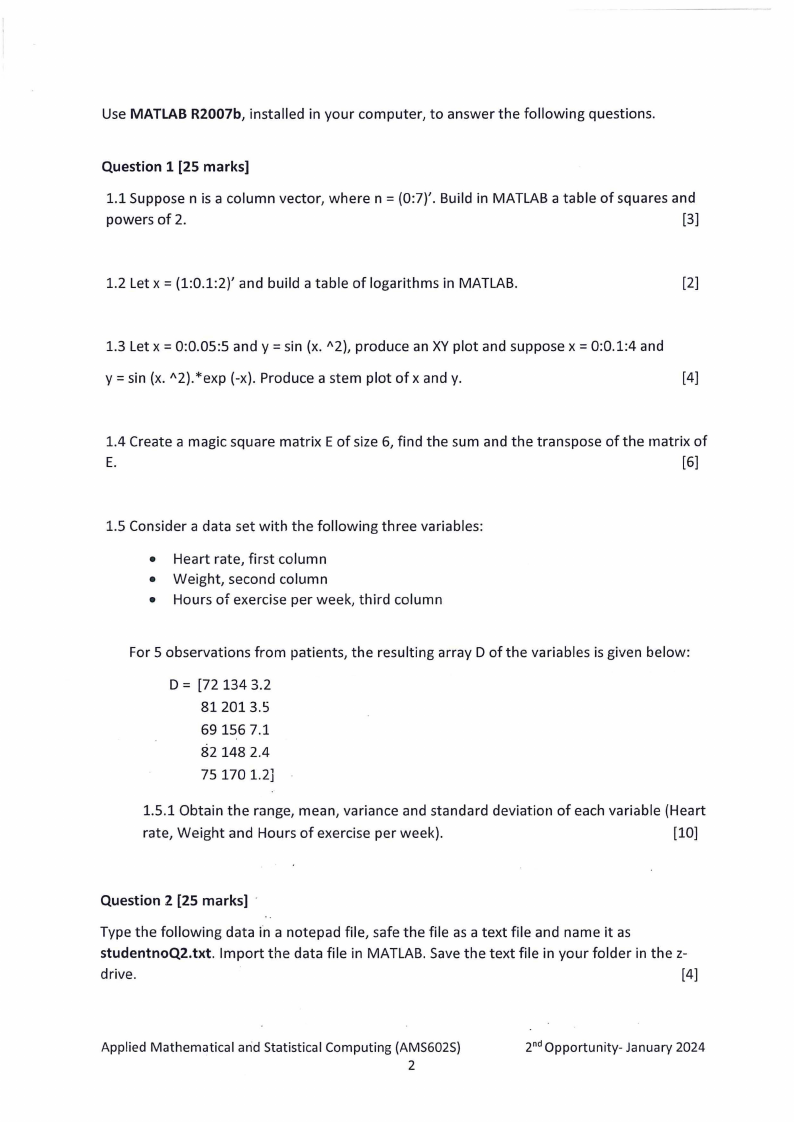
Use MATLAB R2007b, installed in your computer, to answer the following questions.
Question 1 [25 marks]
1.1 Suppose n is a column vector, where n = (0:7)'. Build in MATLAB a table of squares and
powers of 2.
[3]
1.2 Let x = (1:0.1:2)' and build a table of logarithms in MATLAB.
[2]
= = 1.3 Let x 0:0.05:5 and y = sin (x. A2), produce an XY plot and suppose x 0:0.1:4 and
y = sin (x. A2).*exp (-x). Produce a stem plot of x and y.
[4]
1.4 Create a magic square matrix E of size 6, find the sum and the transpose of the matrix of
E.
[6]
1.5 Consider a data set with the following three variables:
• Heart rate, first column
• Weight, second column
• Hours of exercise per week, third column
For 5 observations from patients, the resulting array D of the variables is given below:
D = [72 134 3.2
812013.5
69 156 7.1
82 148 2.4
75 170 1.2]
1.5.1 Obtain the range, mean, variance and standard deviation of each variable (Heart
rate, Weight and Hours of exercise per week).
[10]
Question 2 [25 marks] ·
Type the following data in a notepad file, safe the file as a text file and name it as
studentnoQ2.txt. Import the data file in MATLAB. Save the text file in your folder in the z-
drive.
[4]
Applied Mathematical arid Statistical Computing (AMS602S)
2
2nd Opportunity- January 2024
|
|
3 Page 3 |
▲back to top |
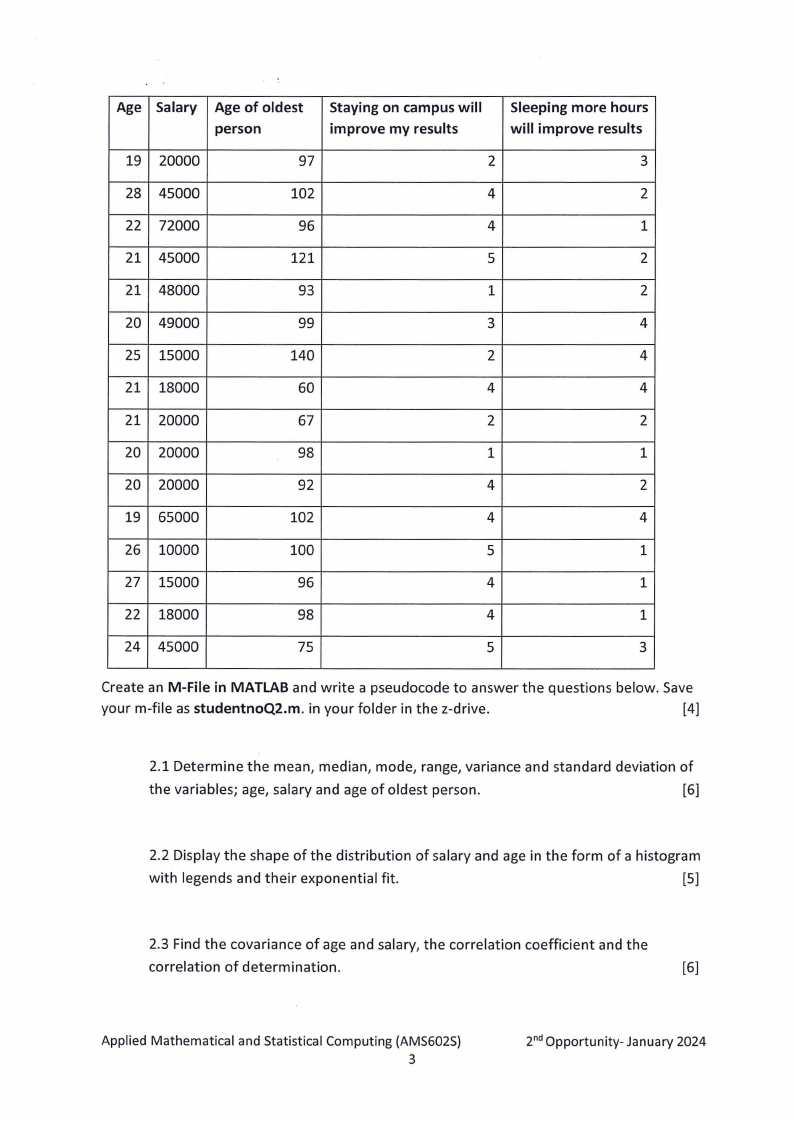
Age Salary Age of oldest
person
Staying on campus will
improve my results
Sleeping more hours
will improve results
19 20000
97
2
3
28 45000
102
4
2
22 72000
96
4
1
21 45000
121
5
2
21 48000
93
1
2
20 49000
99
3
4
25 15000
140
2
4
21 18000
60
4
4
21 20000
67
2
2
20 20000
98
1
1
20 20000
92
4
2
19 65000
102
4
4
26 10000
100
5
1
27 15000
96
4
1
22 18000
98
4
1
24 45000
75
5
3
Create an M-File in MATLAB and write a pseudocode to answer the questions below. Save
your m-file as studentnoQ2.m. in your folder in the z-drive.
[4]
2.1 Determine the mean, median, mode, range, variance and standard deviation of
the variables; age, salary and age of oldest person.
[6]
2.2 Display the shape of the distribution of salary and age in the form of a histogram
with legends and their exponential fit.
[5]
2.3 Find the covariance of age and salary, the correlation coefficient and the
correlation of determination.
[6]
Applied Mathematical and Statistical Computing (AMS602S)
3
2nd Opportunity- January 2024
|
|
4 Page 4 |
▲back to top |
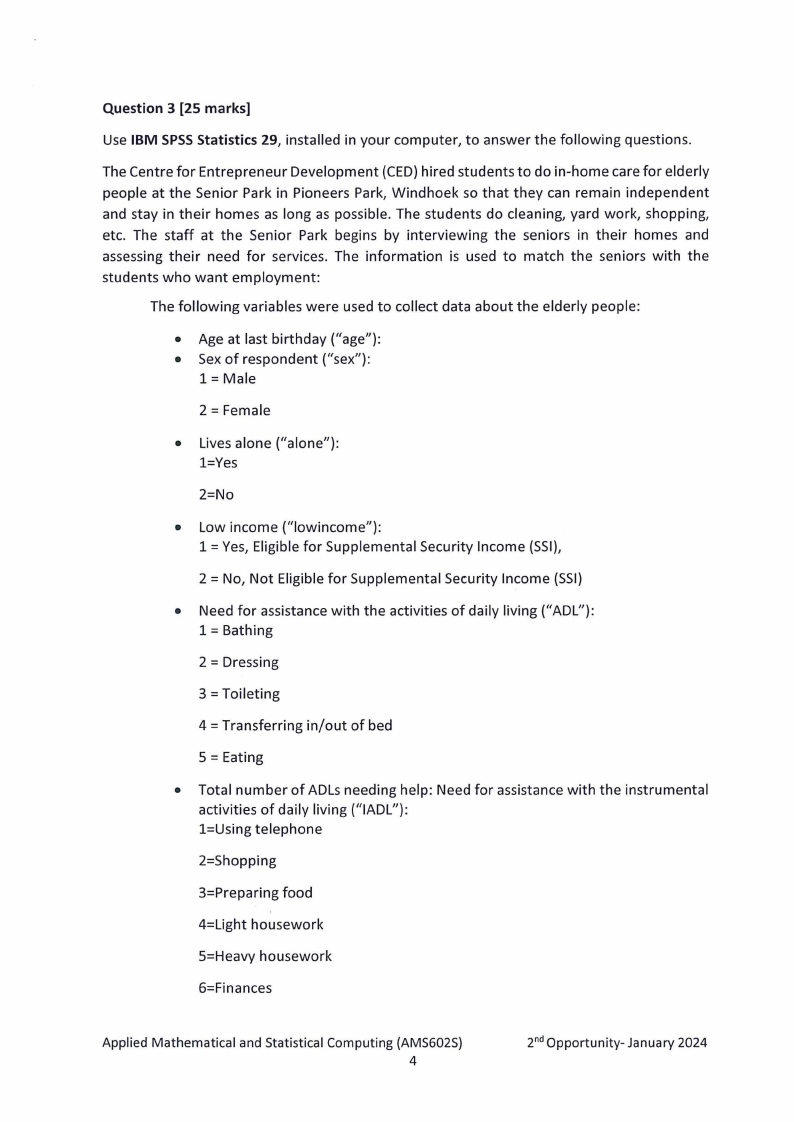
Question 3 [25 marks]
Use IBM SPSSStatistics 29, installed in your computer, to answer the following questions.
The Centre for Entrepreneur Development (CED)hired students to do in-home care for elderly
people at the Senior Park in Pioneers Park, Windhoek so that they can remain independent
and stay in their homes as long as possible. The students do cleaning, yard work, shopping,
etc. The staff at the Senior Park begins by interviewing the seniors in their homes and
assessing their need for services. The information is used to match the seniors with the
students who want employment:
The following variables were used to collect data about the elderly people:
• Age at last birthday ("age"):
• Sex of respondent ("sex"):
1 = Male
2 = Female
• Lives alone ("alone"):
l=Yes
2=No
• Low income ("lowincome"):
1 = Yes, Eligible for Supplemental Security Income (SSI),
2 = No, Not Eligible for Supplemental Security Income (SSI)
• Need for assistance with the activities of daily living ("AOL"):
1 = Bathing
2 = Dressing
3 = Toileting
4 = Transferring in/out of bed
5 = Eating
• Total number of ADLs needing help: Need for assistance with the instrumental
activities of daily living ("IADL"):
l=Using telephone
2=Shopping
3=Preparing food
4=Light housework
S=Heavy housework
6=Finances
Applied Mathematical and Statistical Computing (AMS602S)
4
2nd Opportunity- January 2024
|
|
5 Page 5 |
▲back to top |

• Systolic Blood Pressure (SBP)
To keep track of the needs of potential clients, the program created a data file from one
month's new applications. Use the data file, called Jan_exam_data, saved on the desktop
of your computer and answer the following questions.
3.1 Import the data from your Excel file, Jan_exam_data into SPSSand define all the
variables in SPSS.Save your SPSSdata file using your initials and student number, eg.
studentnoQ3.
[5]
3.2 Recode the variable "age" into "agegroup" using the following categories:
1 = 60-69 yrs
2 = 70-79 yrs
3 = 80+ yrs
Run a frequency of the variable "agegroup".
[2]
3.3 Obtain summary information about the distribution, variability, and central tendency
of the continuous variables, "age". Furthermore, visually examine the central tendency
and distributional characteristics of the continuous variable, "age" as well as producing a
histogram, stem and leaf and box plots and checking assumptions with Normality plots.
Write up a short narrative for each output explaining what you found about this variable
(age).
[14]
3.4 Produce a table of frequencies and percentages and a bar chart of the variable "sex".
Write up a short narrative explaining your results.
[4]
QUESTION 4 (25 MARKS)
4.1 Perform a simple linear regression of the variables "SBP" (dependent variable) and
"age" (independent variable) and show the results.
[6]
4.2 State the regression equation and interpret the equation in terms of age and systolic
blood pressure.
[5]
4.3 How much of the variation in systolic blood pressure is explained by the differences in
age?
[2]
4.4 ls the regression line significant? State your hypothesis and the p-value.
[5]
Applied Mathematical and Statistical Computing (AMS602S}
5
2nd Opportunity- January 2024
|
|
6 Page 6 |
▲back to top |
4.5 Is there a significant difference in men and woman in terms of average systolic blood
pressure in the population? State the null and alternative hypothesis. Run an
appropriate statistical test to test the hypothesis. Write a short narrative explaining your
results.
[7]
**************************END OFEXAMINATION*****************************
Applied Mathematical and Statistical Computing (AMS602S)
6
2nd Opportunity- January 2024