


 |
BAP721S - BUSINESS APPLICATIONS 3 - 1ST OPP - JUNE 2025 |
|
|
1 Page 1 |
▲back to top |
nAmlBIA UnlVERSITY
OF SCIEn CE Ano TECHn OLOGY
FACULTY OF COMMERCE, HUMAN SCIENCES& EDUCATION
DEPARTMENT OF GOVERNANCE AND SCIENCES,HOSPITALITY, TECHNICAL AND
VOCATIONAL EDUCATION AND TRAINING
QUALIFICATION: BACHELOR OF BUSINESS AND INFORMATION ADMINISTRATION
QUALIFICATION CODE: 07BBIA
LEVEL: 7
COURSE: BUSINESS APPLICATIONS 3
COURSE CODE: BAP721S
DATE: JUNE 2025
SESSION: PAPER 1
DURATION: 2 Hours
MARKS: 100
EXAMINER(S)
MODERATOR:
FIRST OPPORTUNITY QUESTION PAPER
Mrs. P. Louw
Dr. J.T.C Bock
INSTRUCTIONS
1. Answer ALL the questions.
2. Read the questions carefully before answering.
3. Make sure your name, surname and student number appear in the Header.
4. Make sure the sheet names appear in the Footer.
5. Give special attention to the manuscript instructions.
THIS QUESTION PAPER CONSISTS OF 7 PAGES (EXCLUDING THIS FRONT PAGE)
|
|
2 Page 2 |
▲back to top |
I QUESTION 1
MS WORD
MARKS: 20
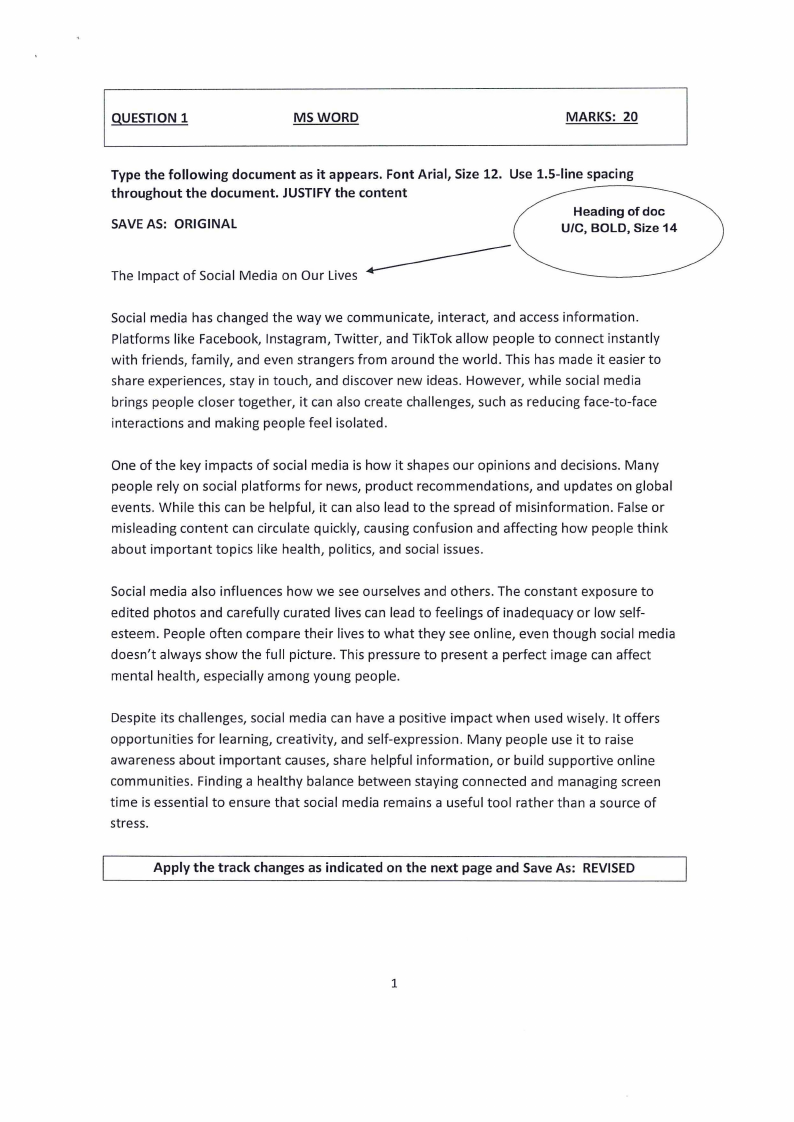
Type the following document as it appears. Font Arial, Size 12. Use 1.5-line spacing
throughout the document. JUSTIFY the content
SAVE AS: ORIGINAL
Heading of doc
U/C, BOLD, Size 14
The Impact of Social Media on Our Lives ..-------------
Social media has changed the way we communicate, interact, and access information.
Platforms like Facebook, lnstagram, Twitter, and TikTok allow people to connect instantly
with friends, family, and even strangers from around the world. This has made it easier to
share experiences, stay in touch, and discover new ideas. However, while social media
brings people closer together, it can also create challenges, such as reducing face-to-face
interactions and making people feel isolated.
One of the key impacts of social media is how it shapes our opinions and decisions. Many
people rely on social platforms for news, product recommendations, and updates on global
events. While this can be helpful, it can also lead to the spread of misinformation. False or
misleading content can circulate quickly, causing confusion and affecting how people think
about important topics like health, politics, and social issues.
Social media also influences how we see ourselves and others. The constant exposure to
edited photos and carefully curated lives can lead to feelings of inadequacy or low self-
esteem. People often compare their lives to what they see on line, even though social media
doesn't always show the full picture. This pressure to present a perfect image can affect
mental health, especially among young people.
Despite its challenges, social media can have a positive impact when used wisely. It offers
opportunities for learning, creativity, and self-expression. Many people use it to raise
awareness about important causes, share helpful information, or build supportive online
communities. Finding a healthy balance between staying connected and managing screen
time is essential to ensure that social media remains a useful tool rather than a source of
stress.
Apply the track changes as indicated on the next page and Save As: REVISED
1
|
|
3 Page 3 |
▲back to top |
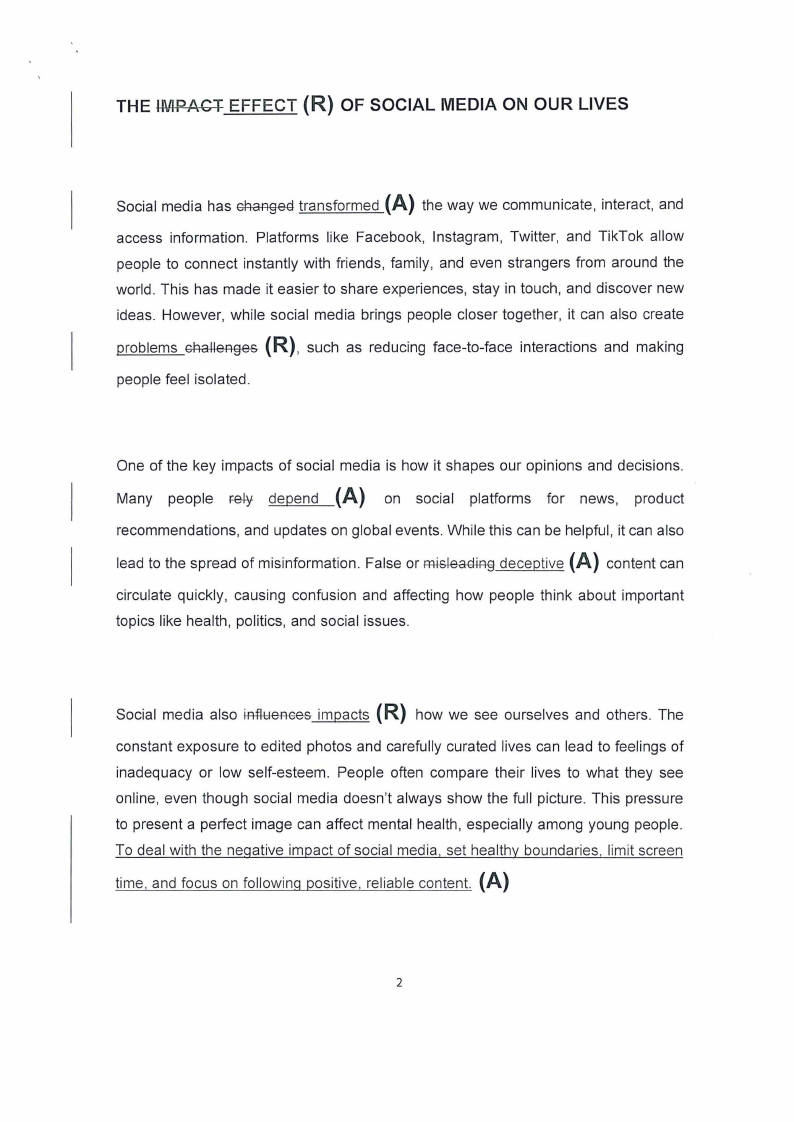
THE IMPACT EFFECT (R) OF SOCIAL MEDIA ON OUR LIVES
Social media has changed transformed (A) the way we communicate, interact, and
access information. Platforms like Facebook, lnstagram, Twitter, and TikTok allow
people to connect instantly with friends, family, and even strangers from around the
world. This has made it easier to share experiences, stay in touch, and discover new
ideas. However, while social media brings people closer together, it can also create
problems challenges (R), such as reducing face-to-face interactions and making
people feel isolated.
One of the key impacts of social media is how it shapes our opinions and decisions.
Many people Fe-l-y depend (A) on social platforms for news, product
recommendations, and updates on global events. While this can be helpful, it can also
lead to the spread of misinformation. False or mi-&leadingdeceptive (A) content can
circulate quickly, causing confusion and affecting how people think about important
topics like health, politics, and social issues.
Social media also influences impacts (R) how we see ourselves and others. The
constant exposure to edited photos and carefully curated lives can lead to feelings of
inadequacy or low self-esteem. People often compare their lives to what they see
online, even though social media doesn't always show the full picture. This pressure
to present a perfect image can affect mental health, especially among young people.
To deal with the negative impact of social media, set healthy boundaries. limit screen
time, and focus on following positive, reliable content. (A)
2
|
|
4 Page 4 |
▲back to top |
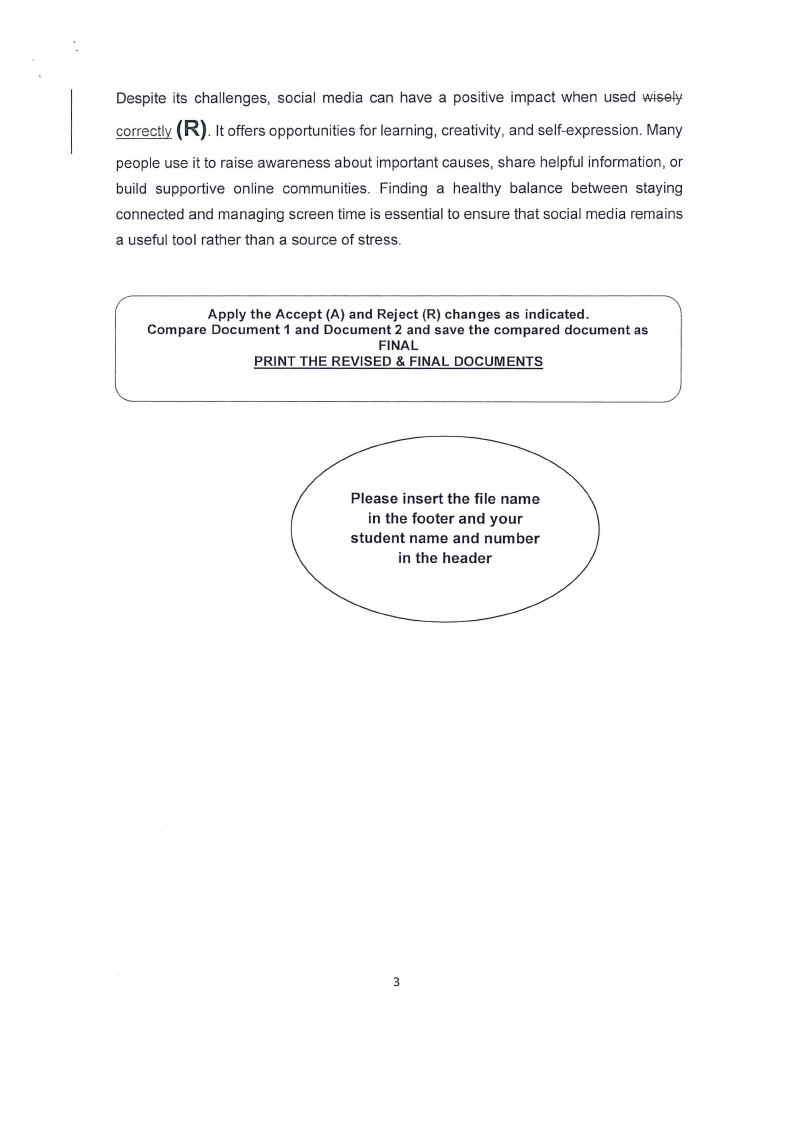
Despite its challenges, social media can have a positive impact when used w+se+y
correctly (R). It offers opportunities for learning, creativity, and self-expression. Many
people use it to raise awareness about important causes, share helpful information, or
build supportive online communities. Finding a healthy balance between staying
connected and managing screen time is essential to ensure that social media remains
a useful tool rather than a source of stress.
Apply the Accept (A) and Reject (R) changes as indicated.
Compare Document 1 and Document 2 and save the compared document as
FINAL
PRINT THE REVISED & FINAL DOCUMENTS
Please insert the file name
in the footer and your
student name and number
in the header
3
|
|
5 Page 5 |
▲back to top |
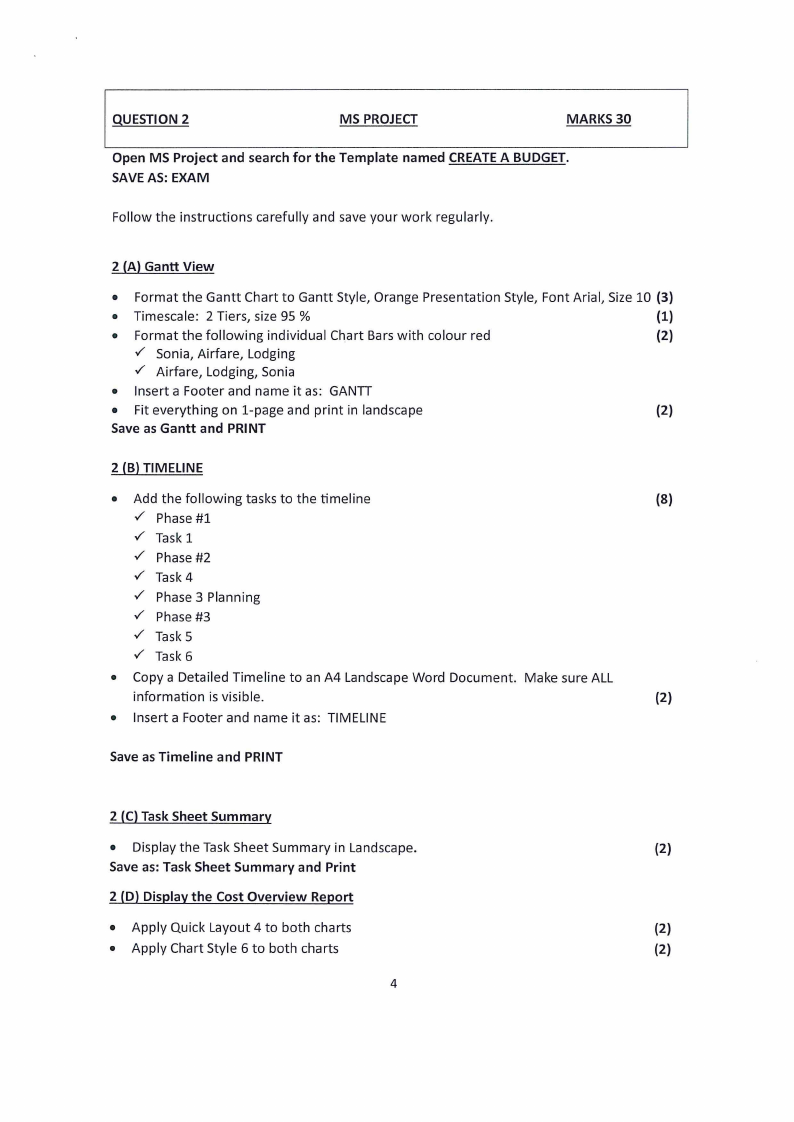
I QUESTION 2
MS PROJECT
MARKS30
Open MS Project and search for the Template named CREATEA BUDGET.
SAVE AS: EXAM
Follow the instructions carefully and save your work regularly.
2 (A) Gantt View
• Format the Gantt Chart to Gantt Style, Orange Presentation Style, Font Arial, Size 10 (3)
• Timescale: 2 Tiers, size 95 %
(1)
• Format the following individual Ch.art Bars with colour red
(2)
Sonia, Airfare, Lodging
Airfare, Lodging, Sonia
• Insert a Footer and name it as: GANTT
• Fit everything on 1-page and print in landscape
(2)
Save as Gantt and PRINT
2 (B) Tl MELINE
• Add the following tasks to the timeline
(8)
Phase #1
Task 1
Phase #2
Task 4
Phase 3 Planning
Phase #3
Task 5
Task 6
• Copy a Detailed Timeline to an A4 Landscape Word Document. Make sure ALL
information is visible.
(2)
• Insert a Footer and name it as: Tl MELINE
Save as Timeline and PRINT
2 (C)Task Sheet Summary
• Display the Task Sheet Summary in Landscape.
(2)
Save as: Task Sheet Summary and Print
2 (D) Display the Cost Overview Report
• Apply Quick Layout 4 to both charts
(2)
• Apply Chart Style 6 to both charts
(2)
4
|
|
6 Page 6 |
▲back to top |
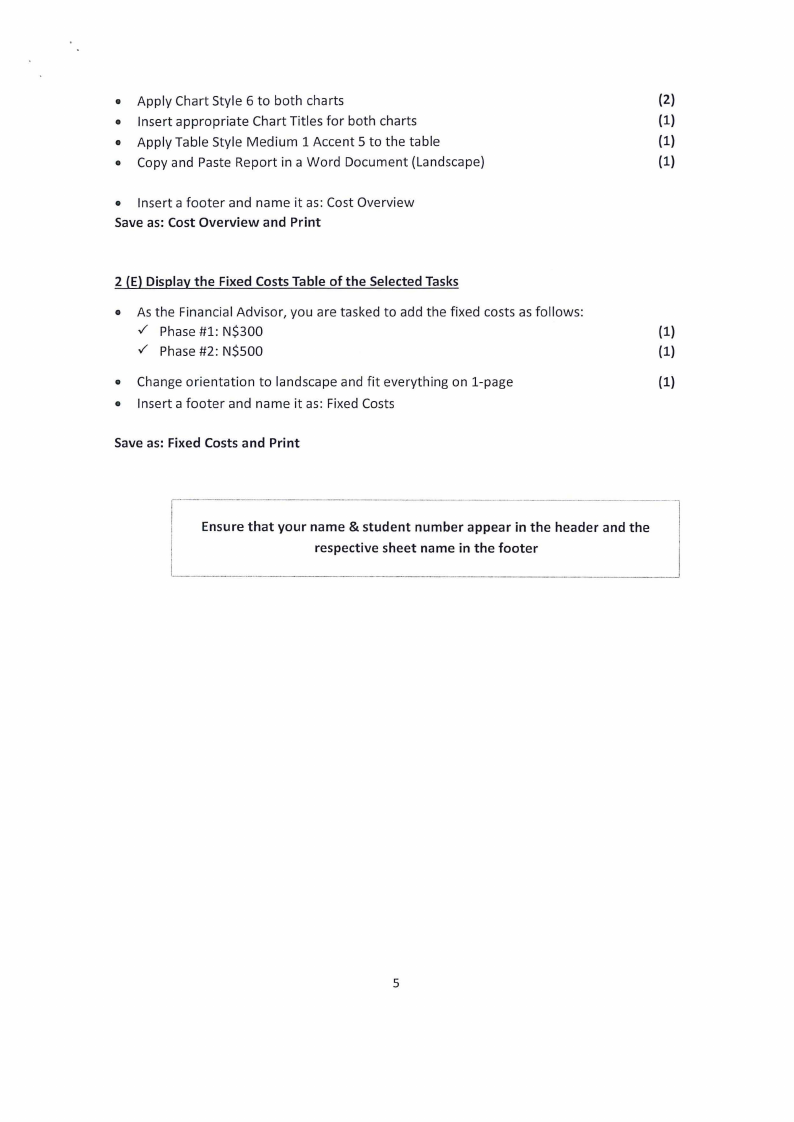
• Apply Chart Style 6 to both charts
(2)
• Insert appropriate Chart Titles for both charts
(1)
• Apply Table Style Medium 1 Accent 5 to the table
(1)
• Copy and Paste Report in a Word Document (Landscape)
(1)
• Insert a footer and name it as: Cost Overview
Save as: Cost Overview and Print
2 (E) Display the Fixed Costs Table of the Selected Tasks
• As the Financial Advisor, you are tasked to add the fixed costs as follows:
Phase #1: N$300
(1)
Phase #2: N$500
(1)
• Change orientation to landscape and fit everything on 1-page
(1)
• Insert a footer and name it as: Fixed Costs
Save as: Fixed Costs and Print
Ensure that your name & student number appear in the header and the
respective sheet name in the footer
5
|
|
7 Page 7 |
▲back to top |
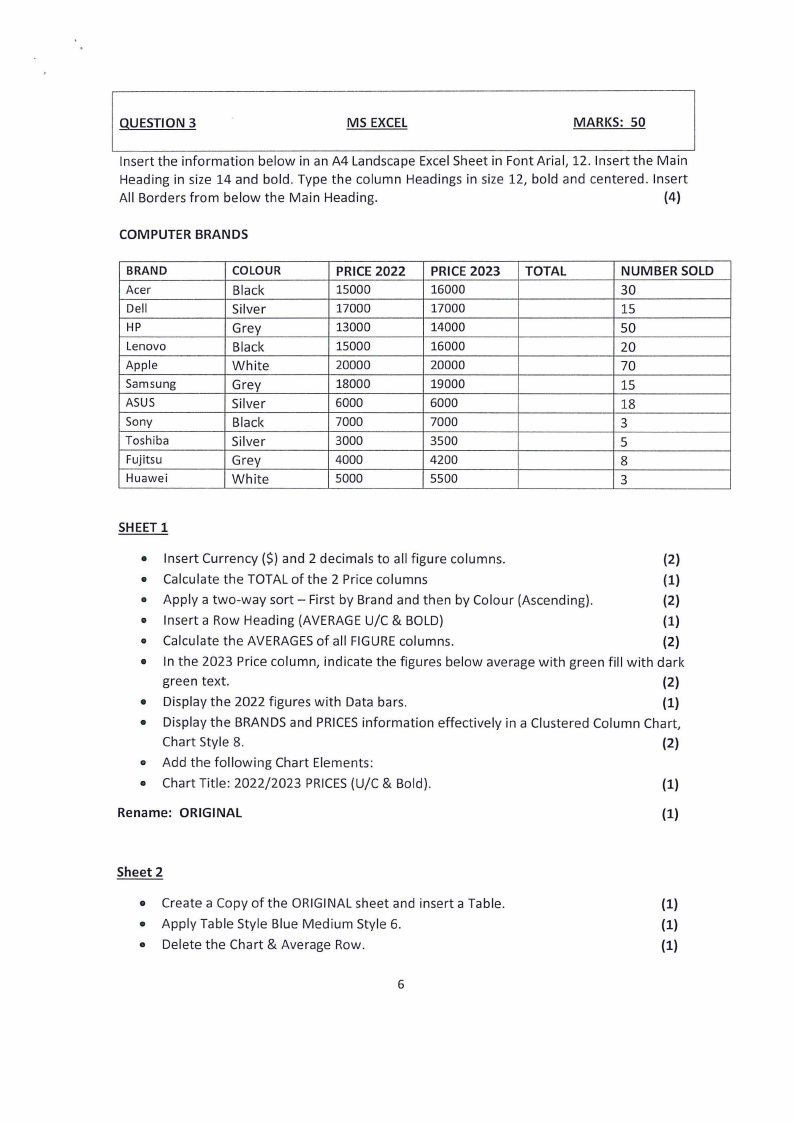
IgUESTION 3
MS EXCEL
MARKS: 50
Insert the information below in an A4 Landscape Excel Sheet in Font Arial, 12. Insert the Main
Heading in size 14 and bold. Type the column Headings in size 12, bold and centered. Insert
All Borders from below the Main Heading.
(4)
COMPUTER BRANDS
BRAND
Acer
Dell
HP
Lenovo
Apple
Samsung
ASUS
Sony
Toshiba
Fujitsu
Huawei
COLOUR
Black
Silver
Grey
Black
White
Grey
Silver
Black
Silver
Grey
White
PRICE 2022
15000
17000
13000
15000
20000
18000
6000
7000
3000
4000
5000
PRICE 2023
16000
17000
14000
16000
20000
19000
6000
7000
3500
4200
5500
TOTAL
NUMBER SOLD
30
15
50
20
70
15
18
3
5
8
3
SHEET 1
• Insert Currency($) and 2 decimals to all figure columns.
(2)
• Calculate the TOTAL of the 2 Price columns
(1)
• Apply a two-way sort - First by Brand and then by Colour (Ascending).
(2)
• Insert a Row Heading (AVERAGEU/C & BOLD)
(1)
• Calculate the AVERAGESof all FIGUREcolumns.
(2)
• In the 2023 Price column, indicate the figures below average with green fill with dark
green text.
(2)
• Display the 2022 figures with Data bars.
(1)
• Display the BRANDSand PRICESinformation effectively in a Clustered Column Chart,
Chart Style 8.
(2)
• Add the following Chart Elements:
• Chart Title: 2022/2023 PRICES(U/C & Bold).
(1)
Rename: ORIGINAL
(1)
Sheet 2
• Create a Copy of the ORIGINAL sheet and insert a Table.
(1)
• Apply Table Style Blue Medium Style 6.
(1)
• Delete the Chart & Average Row.
(1)
6
|
|
8 Page 8 |
▲back to top |
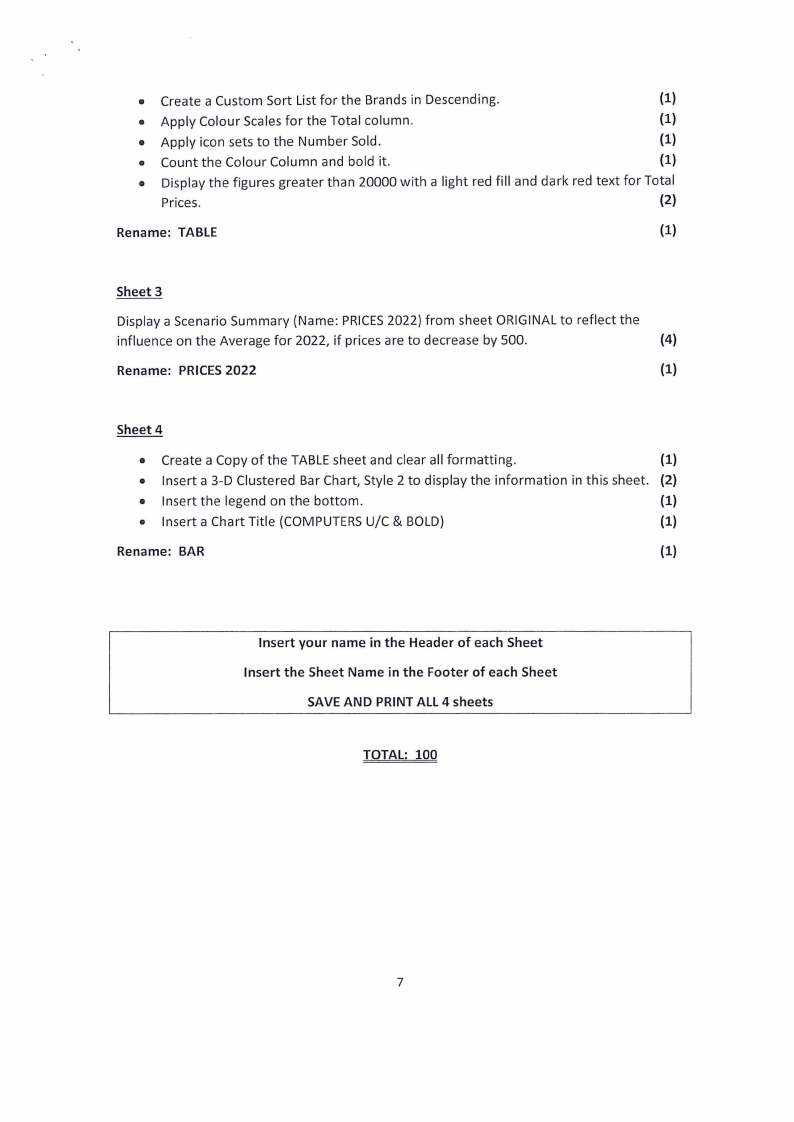
• Create a Custom Sort List for the Brands in Descending.
(1)
• Apply Colour Scales for the Total column.
(1)
• Apply icon sets to the Number Sold.
(1)
• Count the Colour Column and bold it.
(1)
• Display the figures greater than 20000 with a light red fill and dark red text for Total
Prices.
(2)
Rename: TABLE
(1)
Sheet 3
Display a Scenario Summary (Name: PRICES2022) from sheet ORIGINAL to reflect the
influence on the Average for 2022, if prices are to decrease by 500.
(4)
Rename: PRICES2022
(1)
Sheet 4
• Create a Copy of the TABLE sheet and clear all formatting.
(1)
• Insert a 3-D Clustered Bar Chart, Style 2 to display the information in this sheet. (2)
• Insert the legend on the bottom.
(1)
• Insert a Chart Title (COMPUTERSU/C & BOLD)
(1)
Rename: BAR
(1)
Insert your name in the Header of each Sheet
Insert the Sheet Name in the Footer of each Sheet
SAVE AND PRINT ALL 4 sheets
TOTAL: 100
7