


 |
AEM520S - AGRICULTURAL ECONOMICS - 2ND OPP - JAN 2023 |
|
|
1 Page 1 |
▲back to top |
nAmI BIA un IVERSITY
OF SCIEnc E Ano TECHn OLOGY
FACULTYOF HEALTH,NATURAL RESOURCESAND APPLIEDSCIENCES
DEPARTMENTOF AGRICULTUREAND NATURALRESOURCESSCIENCES
QUALIFICATION:BACHELOROF SCIENCEIN AGRICULTURE
QUALIFICATIONCODE: 07BAGA
COURSECODE: AEM520S
LEVEL: 7
COURSENAME: AGRICULTURALECONOMICS
DATE:JANUARY 2023
DURATION: 3 HOURS
MARKS: 100
SECONDOPPORTUNITY EXAMINATION QUESTION PAPER
EXAMINER(S) Mr. Teofilus Shiimi
MODERATOR: Mr. Mwala Lubinda
INSTRUCTIONS
1. Answer ALL the questions.
2. Write clearly and neatly.
3. Number the answers clearly.
PERMISSIBLEMATERIALS
1. Examination question paper
2. Answering book
THIS EXAMINATION QUESTION PAPERCONSISTSOF 4 PAGES(Excluding this front page)
|
|
2 Page 2 |
▲back to top |
Question 1
{a) The equity principles when markets fail and do not achieve efficiency, government
intervention can improve society's welfare. Governments usually intervene in the market to
make them fair {equitable). Discussany two policies that are being implemented by the Namibian
government to ensure fair distribution of economic resources to all citizens irrespective of their
background or status.
[4]
{b) "Production possibilities frontier is an economic theory used to demonstrate the production
of two goods economy". Explain the meaning of the following terms on the PPF.
[6]
{i) Production Efficiency
{ii) Allocative efficiency
{iii) Not feasible
{c) Explain what happened to the PPFwhen the economy experience economic growth. [2]
{d) Explain why consumers are faced with opportunity cost when buying their goods? [2]
{e) Agriculture is regarded as a backbone of the national economy of many nations, especially in
Africa. With specific examples discuss the importance of the agricultural sector to the economy
of Namibia in general.
[6]
Sub-Total Marks
[20]
1
|
|
3 Page 3 |
▲back to top |
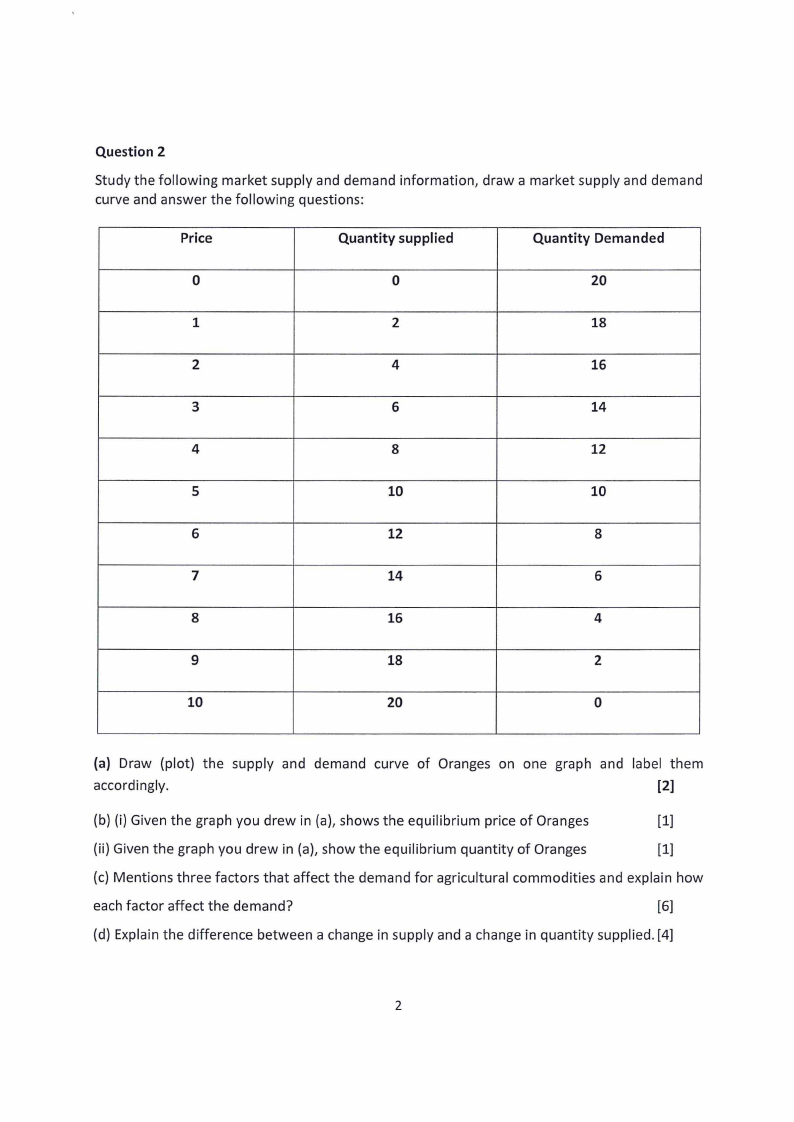
Question 2
Study the following market supply and demand information, draw a market supply and demand
curve and answer the following questions:
Price
Quantity supplied
Quantity Demanded
0
0
20
1
2
18
2
4
16
3
6
14
4
8
12
5
10
10
6
12
8
7
14
6
8
16
4
9
18
2
10
20
0
(a) Draw (plot) the supply and demand curve of Oranges on one graph and label them
accordingly.
[2]
(b) (i) Given the graph you drew in (a), shows the equilibrium price of Oranges
[1]
(ii) Given the graph you drew in {a), show the equilibrium quantity of Oranges
[1]
{c) Mentions three factors that affect the demand for agricultural commodities and explain how
each factor affect the demand?
[6]
{d) Explain the difference between a change in supply and a change in quantity supplied. [4]
2
|
|
4 Page 4 |
▲back to top |
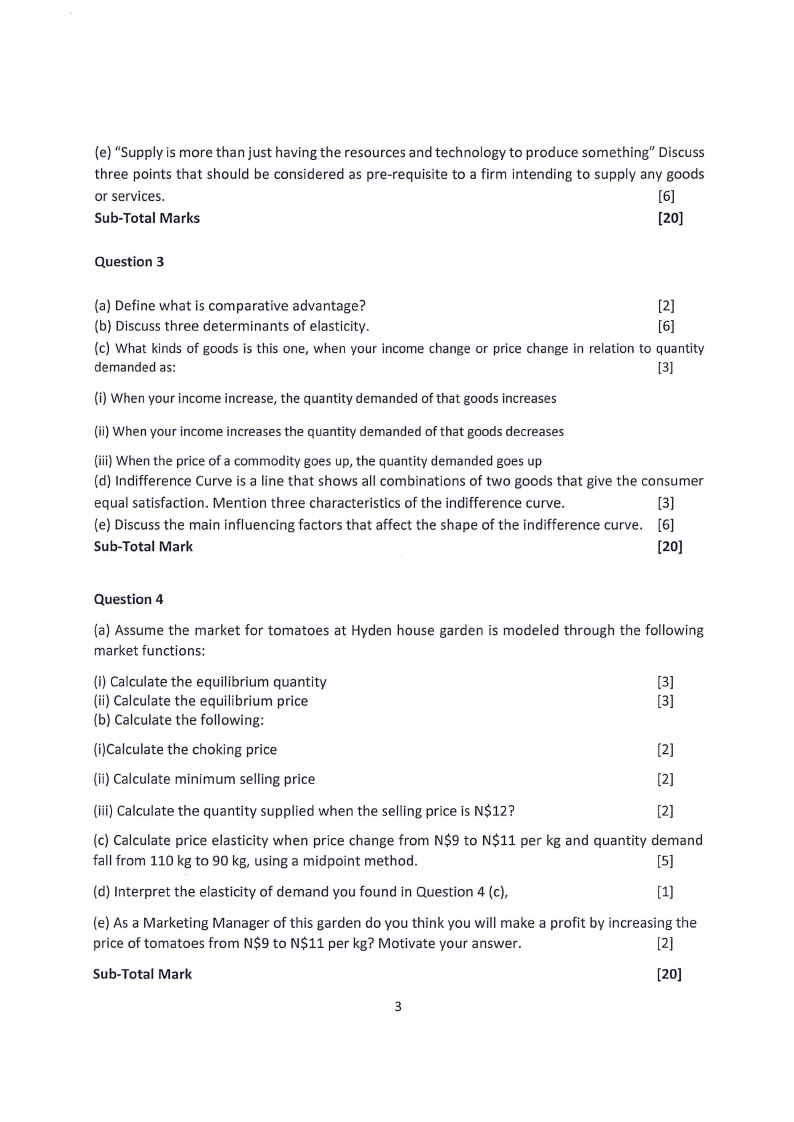
(e) "Supply is more than just having the resources and technology to produce something" Discuss
three points that should be considered as pre-requisite to a firm intending to supply any goods
or services.
[6]
Sub-Total Marks
[20]
Question 3
(a) Define what is comparative advantage?
[2]
(b) Discussthree determinants of elasticity.
[6]
(c) What kinds of goods is this one, when your income change or price change in relation to quantity
demanded as:
[3]
(i) When your income increase,the quantity demandedof that goods increases
(ii) When your income increasesthe quantity demandedof that goods decreases
(iii) When the price of a commodity goes up, the quantity demanded goes up
(d) Indifference Curve is a line that shows all combinations of two goods that give the consumer
equal satisfaction. Mention three characteristics of the indifference curve.
[3]
(e) Discussthe main influencing factors that affect the shape of the indifference curve. [6]
Sub-Total Mark
[20]
Question 4
(a) Assume the market for tomatoes at Hyden house garden is modeled through the following
market functions:
(i) Calculate the equilibrium quantity
[3]
(ii) Calculate the equilibrium price
[3]
(b) Calculate the following:
(i)Calculate the choking price
[2]
(ii) Calculate minimum selling price
[2]
(iii) Calculate the quantity supplied when the selling price is N$12?
[2]
(c) Calculate price elasticity when price change from N$9 to N$11 per kg and quantity demand
fall from 110 kg to 90 kg, using a midpoint method.
[5]
(d) Interpret the elasticity of demand you found in Question 4 (c),
[1]
(e) As a Marketing Manager of this garden do you think you will make a profit by increasing the
price of tomatoes from N$9 to N$11 per kg? Motivate your answer.
[2]
Sub-Total Mark
[20]
3
|
|
5 Page 5 |
▲back to top |
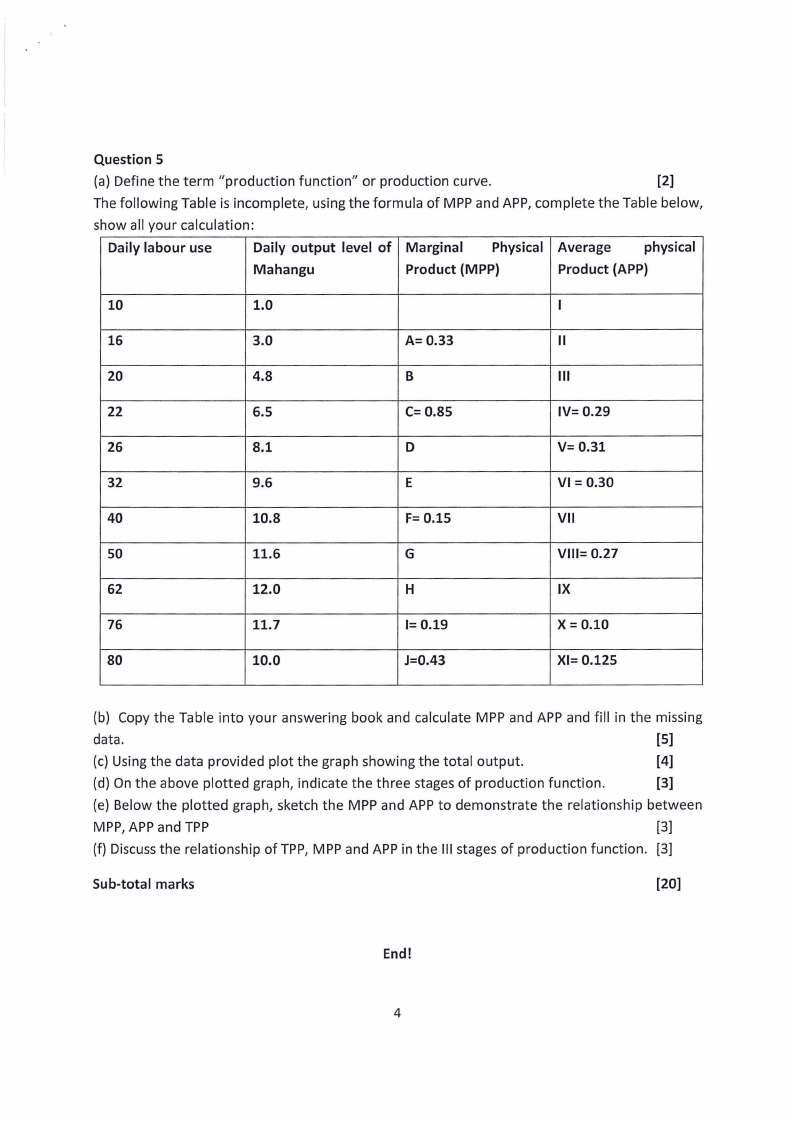
Question 5
{a) Define the term "production function" or production curve.
[2]
The following Table is incomplete, using the formula of MPP and APP, complete the Table below,
show all your calculation:
Daily labour use
Daily output level of Marginal
Physical Average
physical
Mahangu
Product {MPP)
Product (APP)
10
1.0
I
16
3.0
A= 0.33
II
20
4.8
B
Ill
22
6.5
C= 0.85
IV= 0.29
26
8.1
D
V= 0.31
32
9.6
E
VI= 0.30
40
10.8
F= 0.15
VII
so
11.6
G
VIII= 0.27
62
12.0
H
IX
76
11.7
I= 0.19
X = 0.10
80
10.0
J=0.43
XI= 0.125
{b) Copy the Table into your answering book and calculate MPP and APP and fill in the missing
data.
[S]
{c) Using the data provided plot the graph showing the total output.
[4]
{d) On the above plotted graph, indicate the three stages of production function.
[3]
(e) Below the plotted graph, sketch the MPP and APP to demonstrate the relationship between
MPP, APP and TPP
[3]
{f) Discussthe relationship of TPP, MPP and APP in the Ill stages of production function. [3]
Sub-total marks
[20]
End!
4