


 |
IAS502S - INTRODUCTION TO APPLIED STATISTICS - 2ND OPP - JAN 2023 |
|
|
1 Page 1 |
▲back to top |
nAm I BI A un IVERSITY
OF SCIEnCE Ano TECHnOLOGY
FACULTYOF HEALTH,NATURALRESOURCESAND APPLIEDSCIENCES
DEPARTMENT OF MATHEMATICS AND STATISTICS
QUALIFICATION: Bachelor of science; Bachelor of science in Applied Mathematics and Statistics
QUALIFICATION CODE: 07BSOC; 07BSAM
LEVEL: 5
COURSE CODE: IAS501S
COURSE NAME: INTRODUCTION TO APPLIED
STATISTICS
SESSION: JANUARY 2023
DURATION: 3 HOURS
PAPER: THEORY
MARKS: 100
SUPPLEMENTARY/ SECONDOPPORTUNITY EXAMINATION QUESTION PAPER
EXAMINER
Mr. A.J. ROUX
MODERATOR:
Dr. D. Ntirampeba
INSTRUCTIONS
1. Answer ALL the questions in the booklet provided.
2. Show clearly all the steps used in the calculations.
3. All written work must be done in blue or black ink and sketches must
be done in pencil.
PERMISSIBLEMATERIALS
1. Non-programmable calculator without a cover.
ATTACHMENTS
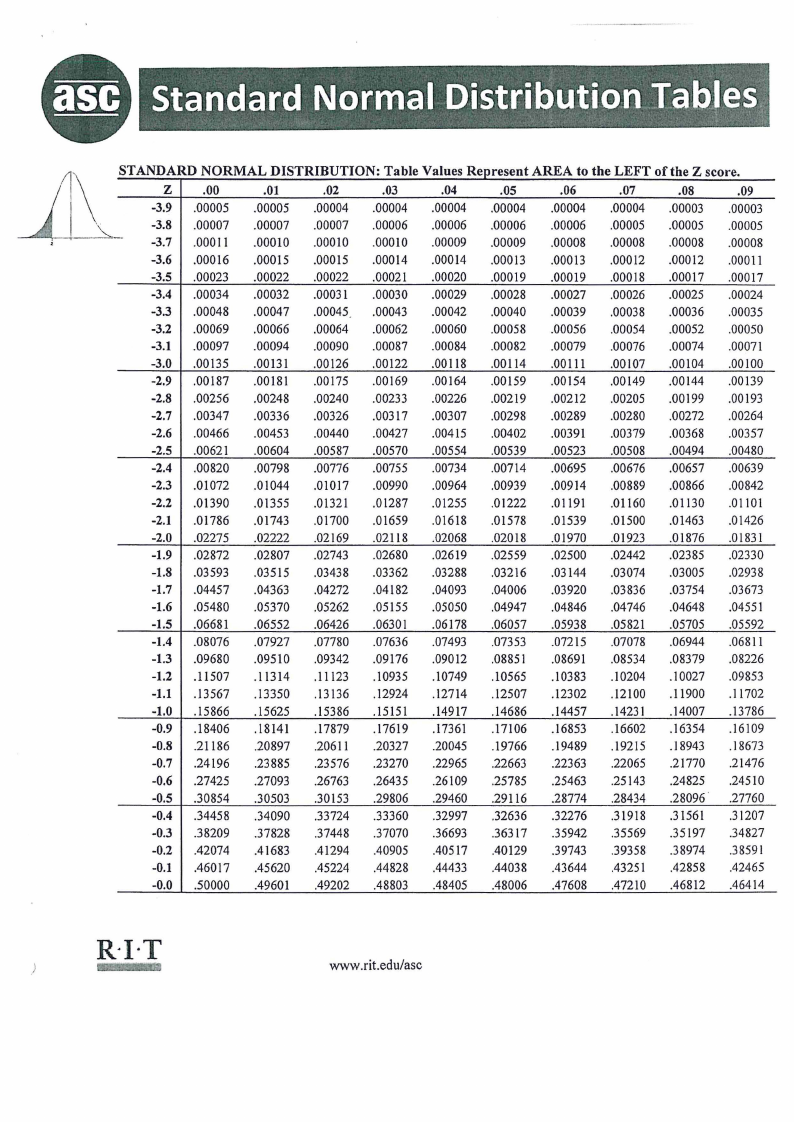
1 The Standard Normal ( z ) Probability Distribution Table
THIS QUESTION PAPER CONSISTS OF 5 PAGES (Including this front page)
|
|
2 Page 2 |
▲back to top |
QUESTION 1 [20]
In questions 1.1 -1.10 below, write down the correct word which completes each
sentence.
1.1 The type of graph most appropriate to represent categorical data which indicates
proportions that make up a given total:_ -
a. Line graph
b. · Pie chart
- c. Bar chart
d. Histogram
[2]
1.2 Another term for the median is:
a. Range
b: Average
c. 2nd Quartile d. Quartile deviation
[2]
1.3 A data set consists of 125 observations that range between 38 and 138. The
- appropriate width of th'e class is equal to:
a. 20.00
b. 21.50
C. 8.80
d. 8.85
[2]
1.4 Eye colors of students enrolled in·a statistics class are called:
· ~- qualitative data
-b. quantitative data
· c. interval data
d. class data
[2]
1.5 Fifteen percent of the students in a School of. Business Administration
are majoring in Economics, 20% in Finance, 35% in Management, and 30% in
Accounting. The graphical device(s) that can be used to present these data is
(are)
a. a line graph
b. only a bar graph
c. only a pie chart
d. both a bar graph and a pie chart
[2]
1.6 The 50th percentile is the
a. mode
b. median c. mean - d. third quartile
[2]
1.7 The interquartile range is
a. the 50th percentile
b. another name for the variance
2
|
|
3 Page 3 |
▲back to top |
c. the range for the middle 50% of the data values
d. the difference between the largest an~ s_~allest values
[2]
1.8 The weight of an object is an example of
a. a continuous random variable
b. a discrete random variable
c. either a continuous or a discrete random variable, depending on the weight
of the object
d. either a continuous or a discrete random variable depending on the units of
measurement
[2]
1.9 In a frequency distribution, the sum of frequencies for all classes will always
equal to:
a. 1
b. the number of elements in a data set
c. the number of classes d. a value between O and 1
[2]
1.10 The semester test scores of 15 students enrolled in a Business Statistics class
were recorded in ascending order as follows:
4, 7, 7, 9, 10, 11, 13, 15, 15, 15, 17, 17, 19, 19, 20
After calculating the mean, median, and mode, an error is discovered:
one of the 15's should be a 17. The measures of central tendency which
will change are:
a. the mean only
b. the mode only
c. the median only . d. the mean and mode
[2]
QUESTION 2 [16]
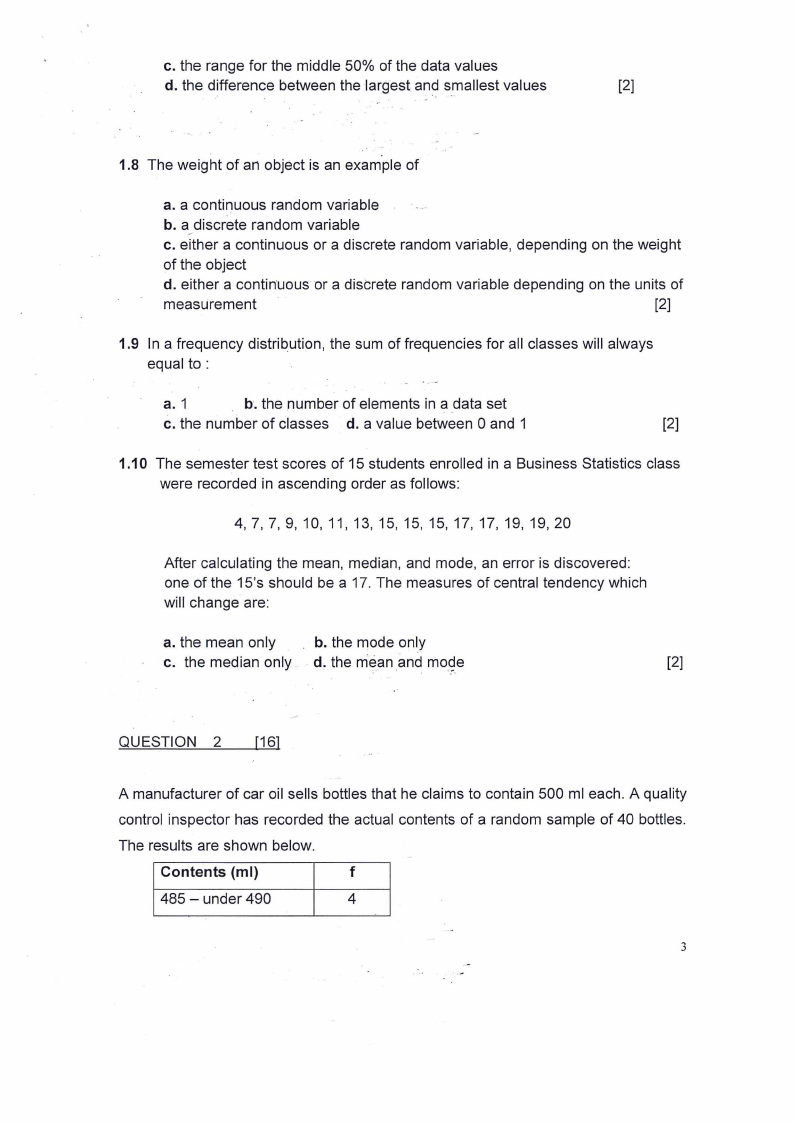
A manufacturer of car oil sells bottles that he claims to contain 500 ml each. A quality
control inspector has recorded the actual contents of a random sample of 40 bottles.
The results are shown below.
Contents (ml)
f
485 - under 490
4
3
|
|
4 Page 4 |
▲back to top |
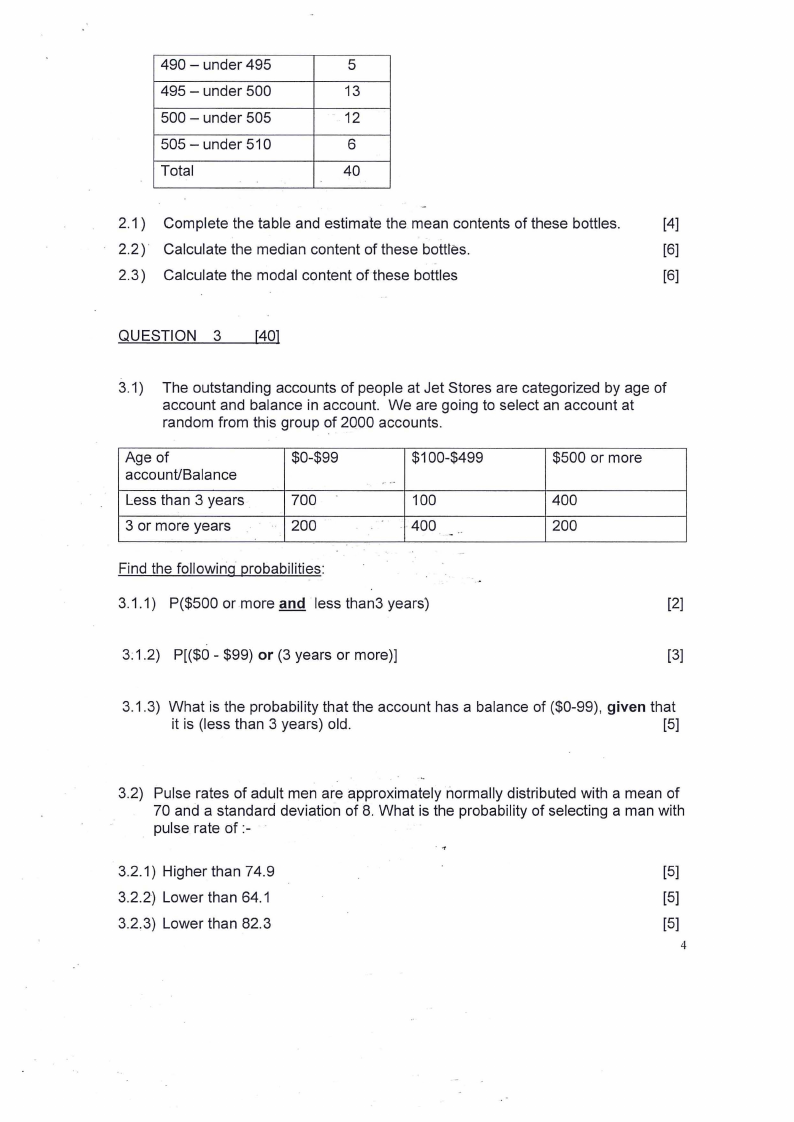
490 - under 495
5
495 - under 500
13
500 - under 505
12
505 - under 510
6
Total
40
2.1) Complete the table and estimate the mean contents of these bottles.
[4]
2.2) · Calculate the median content of these bottles.
[6]
2.3) Calculate the modal content of these bottles
[6]
QUESTION 3 [40]
3.1) The outstanding accounts of people at Jet Stores are categorized by age of
account and balance in account. We are going to select an account at
random from this group of 2000 accounts.
Age of
account/Balance
Less than 3 years
3 or more years
$0-$99
700
200
$100-$499
....
100
400
.
·• ..
$500 or more
400
200
Find the following· probabilities:
3.1.1) P($500 or more and ·Iess than3 years)
[2]
3:1.2) P[($0 - $99) or (3 years or more)]
[3]
3.1.3) What is the probability that the account has a balance of ($0-99), given that
it is (less than 3 years) old.
[5]
3.2) Pulse rates of adult men are approximately normally distributed with a mean of
70 and a standard deviation of 8. What is the probability of selecting a man with
pulse rate of:-
3.2.1) Higher than 74.9
[5]
3.2.2) Lower than 64.1
[5]
3.2,3) Lower than 82.3
[5]
4
|
|
5 Page 5 |
▲back to top |
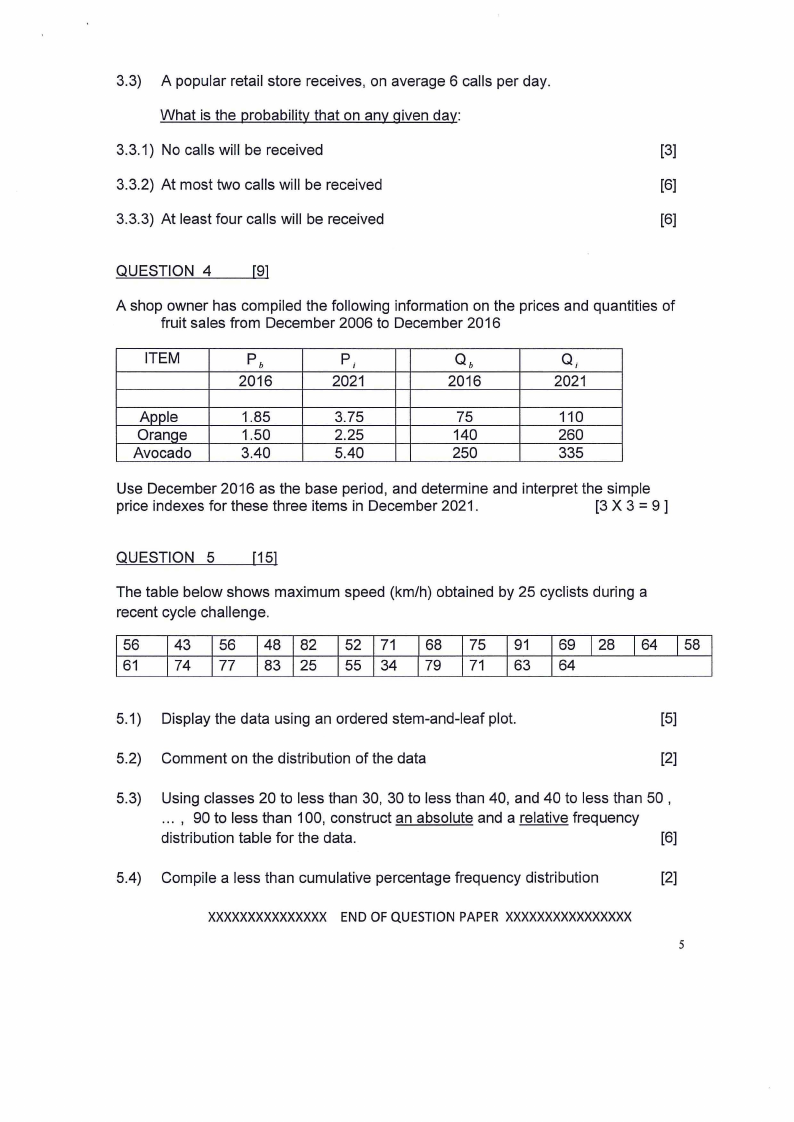
3.3) A popular retail store receives, on average 6 calls per day.
What is the probability that on any given day:
3.3.1) No calls will be received
[3]
3.3.2) At most two calls will be received
[6]
3.3.3) At least four calls will be received
[6]
QUESTION 4
[9]
A shop owner has compiled the following information on the prices and quantities of
fruit sales from December 2006 to December 2016
ITEM
Pb
2016
P;
2021
Qb
2016
Qi
2021
Apple
Orange
Avocado
1.85
1.50
3.40
3.75
2.25
5.40
75
110
140
260
250
335
Use December 2016 as the base period, and determine and interpret the simple
price indexes for these three items in December 2021.
[3 X 3 = 9]
QUESTION 5
[15]
The table below shows maximum speed (km/h) obtained by 25 cyclists during a
recent cycle challenge.
56 43 56 48 82 52 71 68 75 91 69 I 28 I 64 I 58
61 74 77 83 25 55 34 79 71 63 64
5.1) Display the data using an ordered stem-and-leaf plot.
[5]
5.2) Comment on the distribution of the data
[2]
5.3) Using classes 20 to less than 30, 30 to less than 40, and 40 to less than 50 ,
... , 90 to less than 100, construct an absolute and a relative frequency
distribution table for the data.
[6]
5.4) Compile a less than cumulative percentage frequency distribution
[2]
XXXXXXXXXXXXXXENXD OF QUESTIONPAPER XXXXXXXXXXXXXXXX
5
|
|
6 Page 6 |
▲back to top |
\\
L1
'
.
Standard Normal Distributio.n.Iabl:es~;
,
, ..
'
'
' .tl '.' ,, .--,~-1:.
STANDARD NORMAL DISTRIBUTION : T abl e Vla ues Represen tAREA t0 the LEFT of the Z score.
z .00
.01
.02
.03
.04
.05
.06
.07
.08
.09
-3.9 .00005 .00005 .00004 .00004 .00004 .00004 .00004 .00004 .00003 .00003
-3.8 .00007 .00007 .00007 .00006 .00006 .00006 .00006 .00005 .00005 .00005
-3.7 .00011 .00010 .00010 .00010 .00009 .00009 .00008 .00008 .00008 .00008
-3.6 .00016 .00015 .00015 .00014 .00014 .00013 .00013 .00012 .00012 .00011
-3.5 .00023 .00022 .00022 .00021 .00020 .00019 .00019 .00018 .00017 .00017
-3.4 .00034 .00032 .00031 .00030 .00029 .00028 .00027 .00026 .00025 .00024
-3.3 .00048 .00047 .00045 .00043 .00042 .00040 .00039 .00038 .00036 .00035
-3.2 .00069 .00066 .00064 .00062 .00060 .00058 .00056 .00054 .00052 .00050
-3.1 .00097 .00094 .00090 .00087 .00084 .00082 .00079 .00076 .00074 .00071
-3.0 .00135 .00131 .00126 .00122 .00118 .00114 .00111 .00107 .00104 ,00100
-2.9 .00187 .00181 .00175 .00169 .00164 .00159 .00154 .00149 .00144 .00139
-2.8 .00256 ,00248 .00240 .00233 .00226 .00219 .00212 .00205 .00199 .00193
-2.7 .00347 .00336 .00326 .00317 .00307 .00298 .00289 .00280 .00272 .00264
-2.6 .00466 .00453 .00440 .00427 .00415 .00402 .00391 .00379 .00368 .00357
-2.5 .00621 .00604 .00587 .00570 .00554 .00539 .00523 .00508 .00494 .00480
-2.4 .00820 .00798 .00776 .00755 .00734 .00714 .00695 .00676 .00657 .00639
-2.3 .01072 .01044 .01017 .00990 .00964 .00939 .00914 .00889 .00866 .00842
-2.2 .01390 .01355 .01321 ,01287 .01255 .01222 .01191 .01160 .01130 .01101
-2.l .01786 .01743 .01700 .01659 .01618 .01578 .01539 .01500 .01463 .01426
-2.0 .02275 .02222 .02169 .02118 .02068 .02018 .01970 .01923 .01876 .01831
-1.9 .02872 .02807 .02743 .02680 .02619 .02559 .02500 .02442 .02385 .02330
-1.8 .03593 .03515 .03438 .03362 .03288 .03216 .03144 .03074 .03005 .02938
-1.7 .04457 .04363 .04272 .04182 .04093 .04006 .03920 .03836 .03754 .03673
-1.6 .05480 .05370 .05262 .05155 .05050 .04947 .04846 .04746 .04648 .04551
-1.5 .06681 .06552 .06426 .06301 .06178 .06057 .05938 .05821 .05705 .05592
-1.4 .08076 .07927 .07780 .07636 .07493 .07353 .07215 .07078 .06944 .06811
-1.3 .09680 .09510 .09342 .09176 .09012 .08851 .08691 .08534 .08379 .08226
-l.2 .11507 .11314 .11123 .10935 .10749 .10565 .10383 .10204 .10027 .09853
-I.I .13567 .13350 .13136 .12924 .12714 .12507 .12302 .12100 .11900 .11702
-l.0 .15866 .15625 .15386 .15151 .14917 .14686 .14457 .14231 .14007 .13786
-0.9 .18406 . 18141 .17879 .17619 .17361 .17106 .16853 .16602 .16354 .16109
-0.8 .21186 .20897 .20611 .20327 .20045 .19766 .19489 .19215 .18943 .18673
-0.7 .24196 .23885 .23576 .23270 .22965 .22663 .22363 .22065 .21770 .21476
-0.6 .27425 .27093 .26763 .26435 .26109 .25785 .25463 .25143 .24825 .24510
-0.5 .30854 .30503 .30153 .29806 .29460 .29116 .28774 .28434 .28096. .27760
-0.4 .34458 .34090 .33724 .33360 .32997 .32636 .32276 .31918 .31561 .31207
-0.3 .38209 .37828 .37448 .37070 .36693 .36317 .35942 .35569 .35197 .34827
-0.2 .42074 .41683 .41294 .40905 .40517 .40129 .39743 .39358 .38974 .38591
-0.1 .46017 .45620 .45224 .44828 .44433 .44038 .43644 .43251 .42858 .42465
-0.0 .50000 .49601 .49202 .48803 .48405 .48006 .47608 .47210 .46812 .46414
R·I·T
www.rit.edu/asc
|
|
7 Page 7 |
▲back to top |
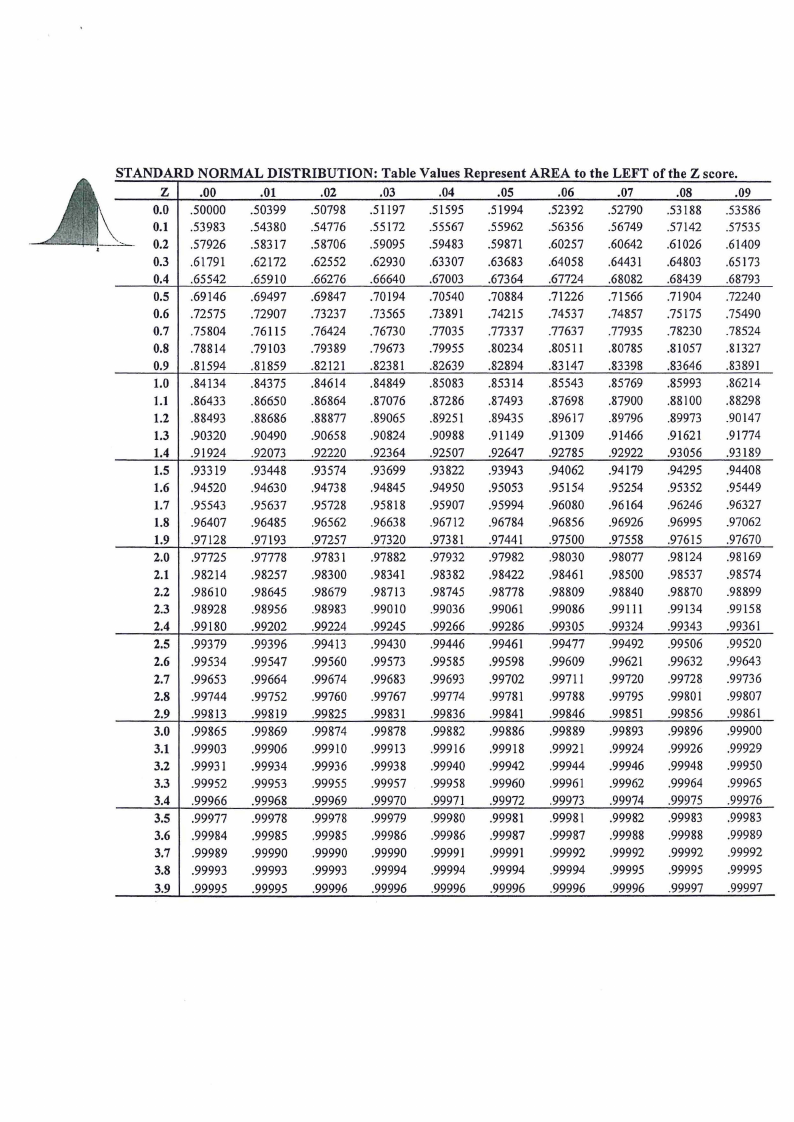
STANDARD NORMAL DISTRIBUTION : Table VaIues Represent AREA tot he LEFT of the Z score.
z .00
.01
.02
.03
.04
.05
.06
.07
.08
.09
0.0 .50000 .50399 .50798 .51197 .51595 .51994 .52392 .52790 .53188 .53586
0.1 .53983 .54380 .54776 .55172 .55567 .55962 .56356 .56749 .57142 .57535
- 0.2 .57926 .58317 .58706 .59095 .59483 .59871 .60257 .60642 .61026 .61409
0.3 .61791 .62172 .62552 .62930 .63307 .63683 .64058 .64431 .64803 .65173
0.4 .65542 .65910 .66276 .66640 .67003 .67364 .67724 .68082 .68439 .68793
0.5 .69146 .69497 .69847 .70194 .70540 .70884 .71226 .71566 .71904 .72240
0.6 .72575 .72907 .73237 .73565 .73891 .74215 .74537 .74857 .75175 .75490
0.7 .75804 .76 I 15 .76424 .76730 .77035 .77337 .77637 .77935 .78230 .78524
0.8 .78814 .79103 .79389 .79673 .79955 .80234 .80511 .80785 .81057 .81327
0.9 .81594 .81859 .82121 .82381 .82639 .82894 .83147 .83398 .83646 .83891
1.0 .84134 .84375 .84614 .84849 .85083 .85314 .85543 .85769 .85993 .86214
1.1 .86433 .86650 .86864 .87076 .87286 .87493 .87698 .87900 .88100 .88298
1.2 .88493 .88686 .88877 .89065 .89251 .89435 .89617 .89796 .89973 .90147
1.3 .90320 .90490 .90658 .90824 .90988 .91149 .91309 .91466 .91621 .91774
1.4 .91924 .92073 .92220 .92364 .92507 .92647 .92785 .92922 .93056 .93189
1.5 .93319 .93448 .93574 .93699 .93822 .93943 .94062 .94179 .94295 .94408
1.6 .94520 .94630 .94738 .94845 .94950 .95053 .95154 .95254 .95352 .95449
1.7 .95543 .95637 .95728 .95818 .95907 .95994 .96080 .96164 .96246 .96327
1.8 .96407 .96485 .96562 .96638 .96712 .96784 .96856 .96926 .96995 .97062
1.9 .97128 .97193 .97257 .97320 .97381 .97441 .97500 .97558 .97615 .97670
2.0 .97725 .97778 .97831 .97882 .97932 .97982 .98030 .98077 .98124 .98169
2.1 .98214 .98257 .98300 .98341 .98382 .98422 .98461 .98500 .98537 .98574
2.2 .98610 .98645 .98679 .98713 .98745 .98778 .98809 .98840 .98870 .98899
2.3 .98928 .98956 .98983 .99010 .99036 .99061 .99086 .99111 .99134 .99158
2.4 .99180 .99202 .99224 .99245 .99266 .99286 .99305 .99324 .99343 .99361
2.5 .99379 .99396 .99413 .99430 .99446 .99461 .99477 .99492 .99506 .99520
2.6 .99534 .99547 .99560 .99573 .99585 .99598 .99609 .99621 .99632 .99643
2.7 .99653 .99664 .99674 .99683 .99693 .99702 .99711 .99720 .99728 .99736
2.8 .99744 .99752 .99760 .99767 .99774 .99781 .99788 .99795 .99801 .99807
2.9 .99813 .99819 .99825 .99831 .99836 .99841 .99846 .99851 .99856 .99861
3.0 .99865 .99869 .99874 .99878 .99882 .99886 .99889 .99893 .99896 .99900
3.1 .99903 .99906 .99910 .99913 .99916 .99918 .99921 .99924 .99926 .99929
3.2 .99931 .99934 .99936 .99938 .99940 .99942 .99944 .99946 .99948 .99950
3.3 .99952 .99953 .99955 .99957 .99958 .99960 .99961 .99962 .99964 .99965
3.4 .99966 .99968 .99969 .99970 .99971 .99972 .99973 .99974 .99975 .99976
3.5 .99977 .99978 .99978 .99979 .99980 .99981 .99981 .99982 .99983 .99983
3.6 .99984 .99985 .99985 .99986 .99986 .99987 .99987 .99988 .99988 .99989
3.7 .99989 .99990 .99990 .99990 .99991 .99991 .99992 .99992 .99992 .99992
3.8 .99993 .99993 .99993 .99994 .99994 .99994 .99994 .99995 .99995 .99995
3.9 .99995 .99995 .99996 .99996 .99996 .99996 .99996 .99996 .99997 .99997