


 |
RME620S - BASIC RESEARCH MEHODOLOGY - 1ST OPP - NOV 2024 |
|
|
1 Page 1 |
▲back to top |
nAmI BIA unIVERSITY
OF SCIEnCE Ano TECHnOLOGY
FACULTYOF HEALTH, NATURAL RESOURCESAND APPLIED SCIENCES
SCHOOLOF AGRICULTUREAND NATURAL RESOURCESSCIENCES
DEPARTMENT OF AGRICULTURALSCIENCESAND AGRIBUSINESS
QUALIFICATION: BACHELOR OF SCIENCE IN AGRICULTURE & BACHELOR OF SCIENCE IN
HORTICULTURE
QUALIFICATION CODE:
07BAGA/07BHOR
LEVEL: 7
COURSE CODE: RME620S
COURSE NAME: BASICRESEARCHMETHODOLOGY
DATE: NOVEMBER 2024
DURATION: 3 HOURS
MARKS: 100
EXAMINER{S)
FIRST OPPORTUNITY EXAMINATION QUESTION PAPER
Prof. Thinah Moyo
MODERATOR: Dr Tendai Nzuma
INSTRUCTIONS
1. Answer ALL five (5) questions.
2. Please write neatly and legibly.
3. Number the answers clearly.
4. Show all your working.
PERMISSIBLEMATERIALS
1. Examination question paper
2. Answer book
3. Calculators
THIS QUESTION PAPER CONSISTS OF 4 PAGES (Including this front page)
1
|
|
2 Page 2 |
▲back to top |
QUESTION 1
(a) State four reasons why research proposals are written.
[20 Marks]
(4 Marks)
(b) Explain the purpose of a good literature review in three key points.
(6 Marks}
(c) Why is research report writing necessary?
(5 Marks)
(d} Define the acronym 'SMART' and briefly explain its meaning as it applies to research objectives.
(5 Marks)
QUESTION 2
(a) Define a population, a sample and a sampling frame.
(b) What is the difference between quantitative and qualitative research methods?
[20 Marks]
(6 Marks)
(2 Marks)
(c) Sampling comes in two forms, probability sampling and non-probability sampling. What is the
difference between probability and non-probability sampling?
(2 Marks)
(d) List and explain any two (2) probability sampling techniques.
(4 Marks)
(e) List and explain any two (2) non-probability sampling techniques.
(4 Marks)
(f) What statistic reports the relative standing of a value in a set of data?
QUESTION 3
(a) What does the standard deviation measure?
(2 Marks)
[20 Marks]
(1 Mark)
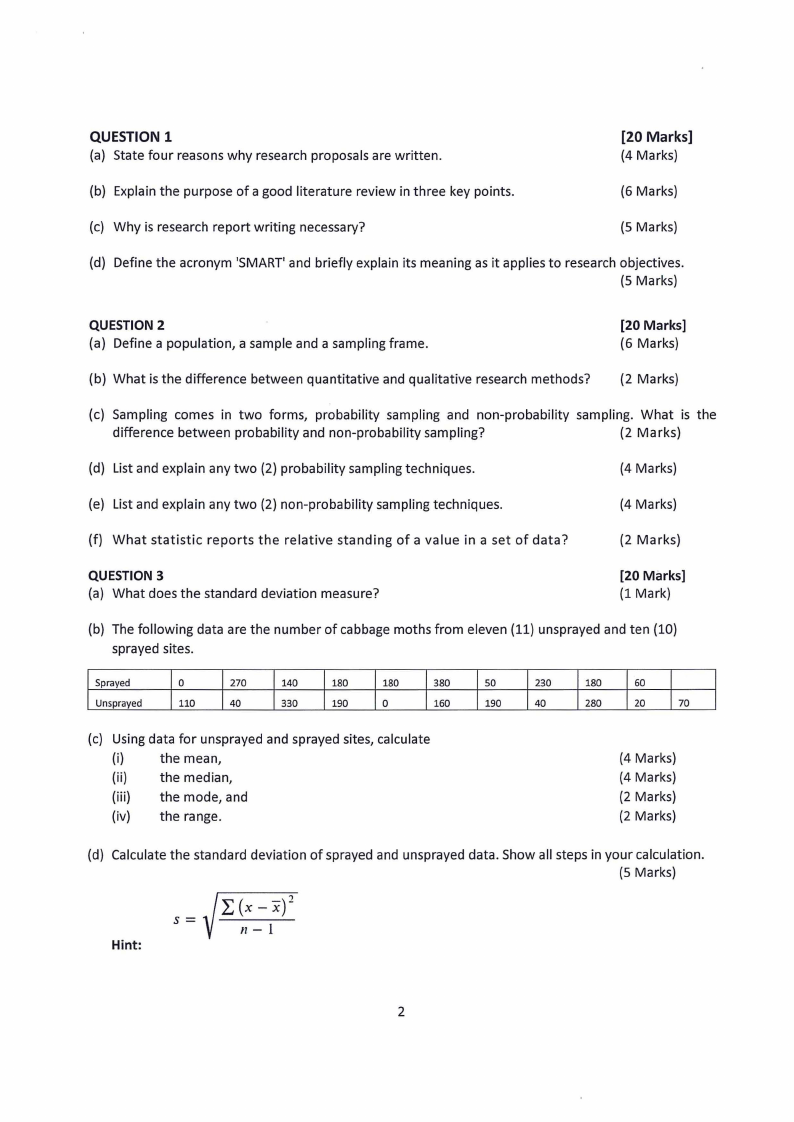
(b) The following data are the number of cabbage moths from eleven (11) unsprayed and ten (10)
sprayed sites.
Sprayed
Unsprayed
0
270
140
180
180
380
so
230
180
60
110
40
330
190
0
160
190
40
280
20
70
(c) Using data for unsprayed and sprayed sites, calculate
(i)
the mean,
(ii) the median,
(iii) the mode, and
(iv) the range.
(4 Marks)
(4 Marks}
(2 Marks)
(2 Marks}
(d) Calculate the standard deviation of sprayed and unsprayed data. Show all steps in your calculation.
(5 Marks)
s=
Hint:
2
|
|
3 Page 3 |
▲back to top |
(e)To the nearest tenth, what is the median and the mode of the following data set? 18, 21, 17, 18, 16,
15.5, 12, 17, 10, 21, 17.
(2 Marks)
QUESTION 4
(20 Marks]
(a) A Real Estate Agent tells you that the average cost of houses in a town is NAD2,176,000. You want to
know how much the prices of the houses may vary from this average. What measurement do you
need?
(2 Marks)
A. standard deviation
B. interquartile range
C. variance
D. percentile
(b) Identify which of the following options is a quantitative variable and explain why. (2 Marks)
A. the colour of an automobile
B. a person's region of residence
C. a person's postal code
D. a person's height, recorded in centimetres (because it is measured in numerical values)
E. choices (C}and (D)
(c) You took a survey of 100 people and found that 60% of them like chocolate and 40% do not. Which of
the following results presentations gives the distribution ofthe "chocolate versus no chocolate" variable?
(4 Marks)
A. a table of the results
B. a pie chart of the results
C. a bar graph of the results
D. a sentence describing the results
E. all of the above
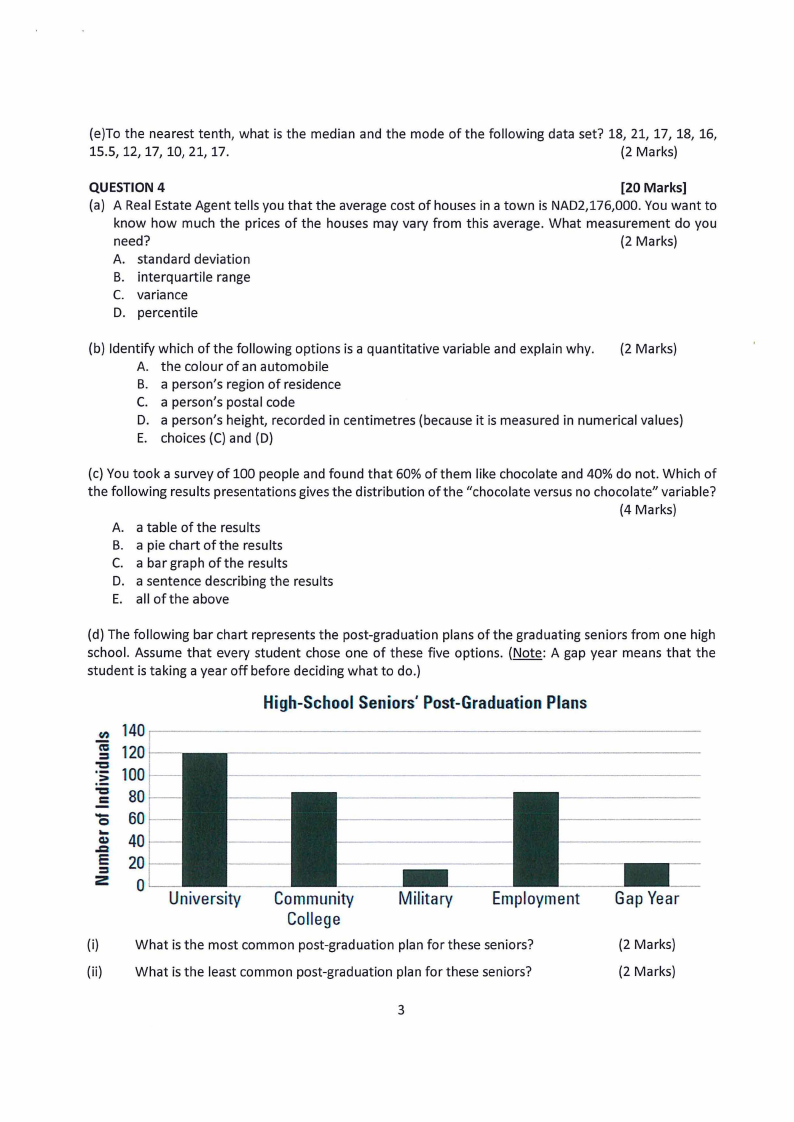
(d) The following bar chart represents the post-graduation plans of the graduating seniors from one high
school. Assume that every student chose one of these five options. (Note: A gap year means that the
student is taking a year off before deciding what to do.)
High-SchoolSeniors'Post-GraduationPlans
Cl) 140
-c==a
>
120
100
--== 80
0... 60
-2QE==)
40
20
0
University
Community
College
Military
Employment
(i)
What is the most common post-graduation plan for these seniors?
(ii) What is the least common post-graduation plan for these seniors?
Gap Year
(2 Marks)
(2 Marks)
3
|
|
4 Page 4 |
▲back to top |
(iii) Assuming that each student has chosen only one of the five possibilities, about how many
students plan to either take a gap year or attend a university?
(2 Marks)
(iv) How many total students are represented in this chart?
(2 Marks)
(v) What percentage of the graduating class is planning on attending a community college?
(2 Marks)
(vi) What percentage of the graduating class is not planning to attend a university? (2 Marks)
QUESTION 5
(a) List and explain 5 common data distribution patterns observed in statistics.
[20 Marks]
(10 Marks)
(b) If the formula for a regression line is v=9x + 17. Describe the components of this line and the
interpretation thereof.
(S Marks)
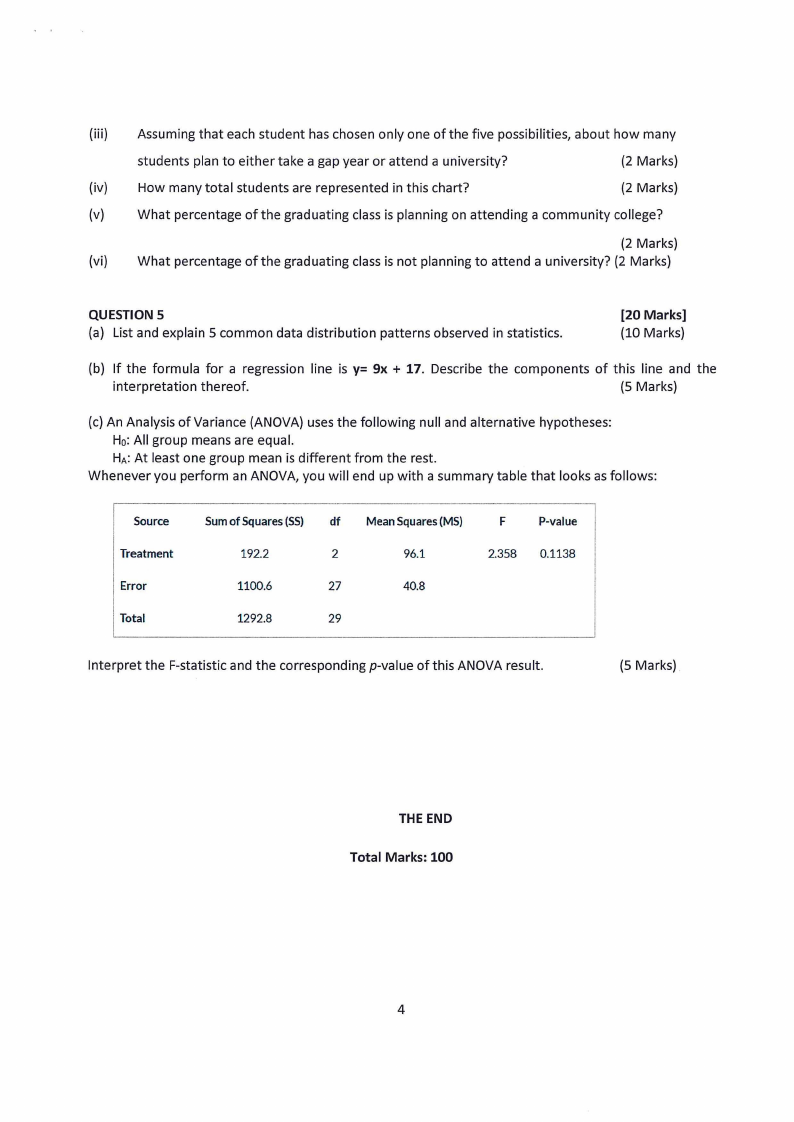
(c) An Analysis of Variance (ANOVA) uses the following null and alternative hypotheses:
Ha:All group means are equal.
HA:At least one group mean is different from the rest.
Whenever you perform an ANOVA,you will end up with a summary table that looks as follows:
Source
Treatment
Error
Total
Sumof Squares(SS) df
192.2
2
1100.6
27
1292.8
29
Mean Squares(MS)
96.1
40.8
F
P-value
2.358 0.1138
Interpret the F-statistic and the corresponding p-value of this ANOVA result.
(5 Marks)
THEEND
Total Marks: 100
4