


 |
RME620S - BASIC RESEARCH MEHODOLOGY - 2ND OPP - NOV 2024 |
|
|
1 Page 1 |
▲back to top |
nAmlBIA unlVERSITY
OF SCIEn CE Ano TECHn OLOGY
FACULTYOF HEALTH,NATURALRESOURCESAND APPLIEDSCIENCES
SCHOOLOF AGRICULTUREAND NATURALRESOURCESSCIENCES
DEPARTMENTOF AGRICULTURALSCIENCESAND AGRIBUSINESS
QUALIFICATION: BACHELOROF SCIENCEIN AGRICULTURE& BACHELOROF SCIENCEIN
HORTICULTURE
QUALIFICATION CODE:
07BAGA / 7BHOR
LEVEL: 7
COURSECODE: RME620S
COURSENAME: BASICRESEARCHMETHODOLOGY
DATE: JANUARY2025
DURATION: 3 HOURS
MARKS: 100
SECOND OPPORTUNITY/ SUPPLEMENTARY EXAMINATION QUESTION PAPER
EXAMINER(S) Prof. Thinah Moyo
MODERATOR: Dr Tendai Nzuma
INSTRUCTIONS
1. Answer ALL five (5) questions.
2. Please write neatly and legibly.
3. Number the answers clearly.
4. Show all your working.
PERMISSIBLE MATERIALS
1. Examination question paper
2. Answer book
3. Calculators
THIS QUESTION PAPERCONSISTSOF 5 PAGES(Including this front page)
|
|
2 Page 2 |
▲back to top |
QUESTION 1
(a} How would you describe a research proposal?
[20 Marks]
(S Marks}
(b} List four reasons why research proposals are written.
(4 Marks}
(c} Define the acronym 'SMART' and briefly explain its meaning as it applies to research
objectives.
(S Marks}
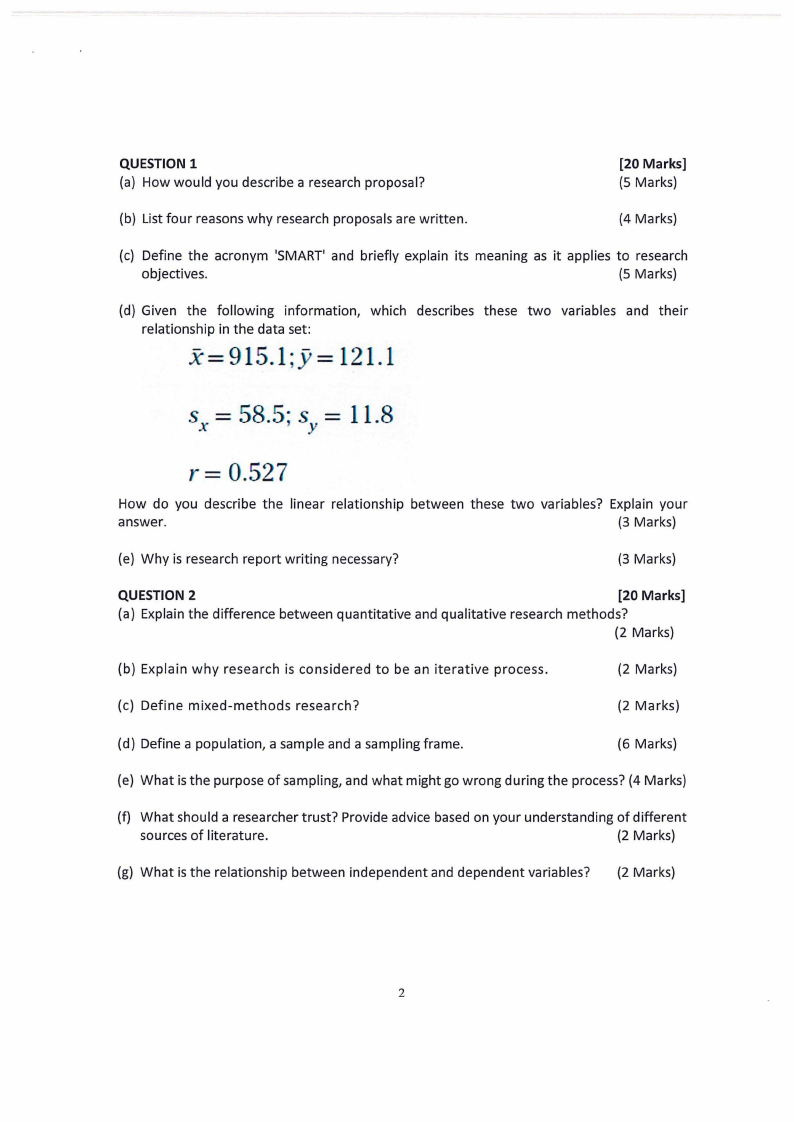
(d} Given the following information, which describes these two variables and their
relationship in the data set:
x-=915.l;y= 121.1
r = 0.527
How do you describe the linear relationship between these two variables? Explain your
answer.
(3 Marks}
(e} Why is research report writing necessary?
(3 Marks}
QUESTION 2
[20 Marks]
(a} Explain the difference between quantitative and qualitative research methods?
(2 Marks}
(b} Explain why research is considered to be an iterative process.
(2 Marks}
(c} Define mixed-methods research?
(2 Marks}
(d} Define a population, a sample and a sampling frame.
(6 Marks}
(e} What is the purpose of sampling, and what might go wrong during the process? (4 Marks}
(f} What should a researcher trust? Provide advice based on your understanding of different
sources of literature.
(2 Marks}
(g} What is the relationship between independent and dependent variables? (2 Marks}
2
|
|
3 Page 3 |
▲back to top |
QUESTION 3
[20 Marks]
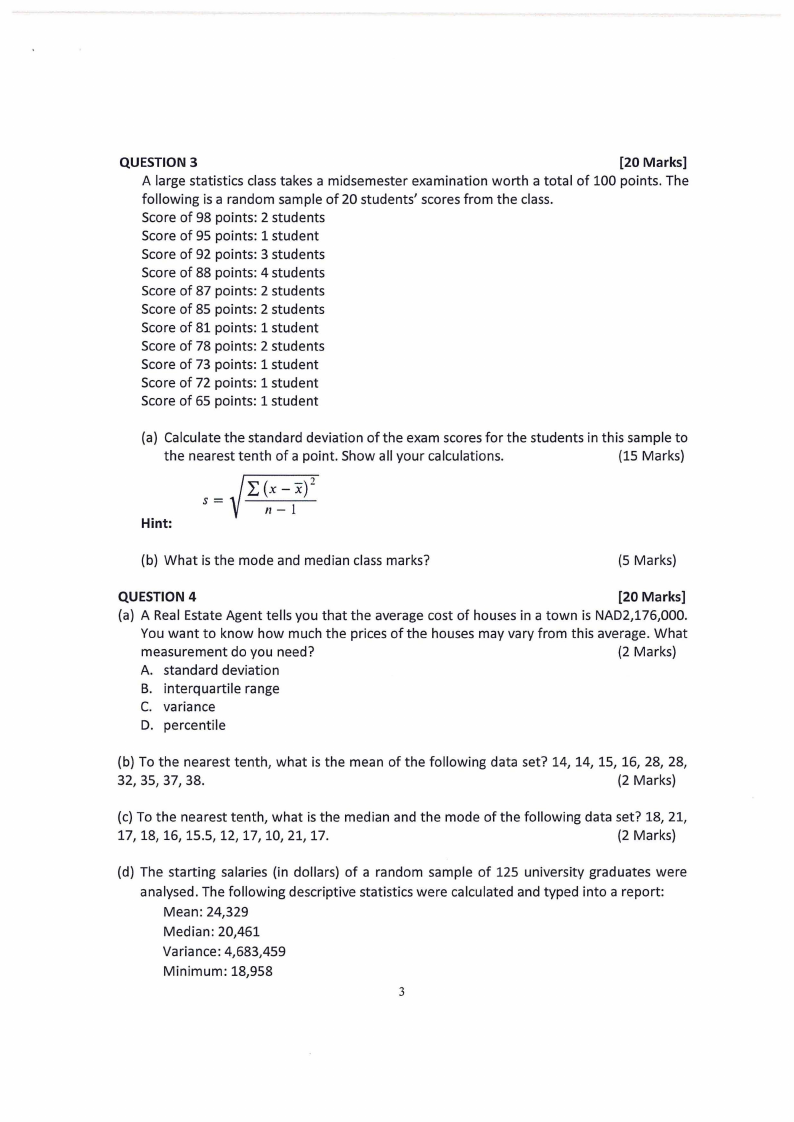
A large statistics class takes a midsemester examination worth a total of 100 points. The
following is a random sample of 20 students' scores from the class.
Score of 98 points: 2 students
Score of 95 points: 1 student
Score of 92 points: 3 students
Score of 88 points: 4 students
Score of 87 points: 2 students
Score of 85 points: 2 students
Score of 81 points: 1 student
Score of 78 points: 2 students
Score of 73 points: 1 student
Score of 72 points: 1 student
Score of 65 points: 1 student
(a) Calculate the standard deviation of the exam scores for the students in this sample to
the nearest tenth of a point. Show all your calculations.
{15 Marks)
Hint:
(b) What is the mode and median class marks?
(5 Marks)
QUESTION 4
[20 Marks]
(a) A Real Estate Agent tells you that the average cost of houses in a town is NAD2,176,000.
You want to know how much the prices of the houses may vary from this average. What
measurement do you need?
{2 Marks)
A. standard deviation
B. interquartile range
C. variance
D. percentile
(b) To the nearest tenth, what is the mean of the following data set? 14, 14, 15, 16, 28, 28,
32, 35, 37, 38.
(2 Marks)
(c) To the nearest tenth, what is the median and the mode of the following data set? 18, 21,
17, 18, 16, 15.5, 12, 17, 10, 21, 17.
{2 Marks)
(d) The starting salaries (in dollars) of a random sample of 125 university graduates were
analysed. The following descriptive statistics were calculated and typed into a report:
Mean: 24,329
Median: 20,461
Variance: 4,683,459
Minimum: 18,958
3
|
|
4 Page 4 |
▲back to top |
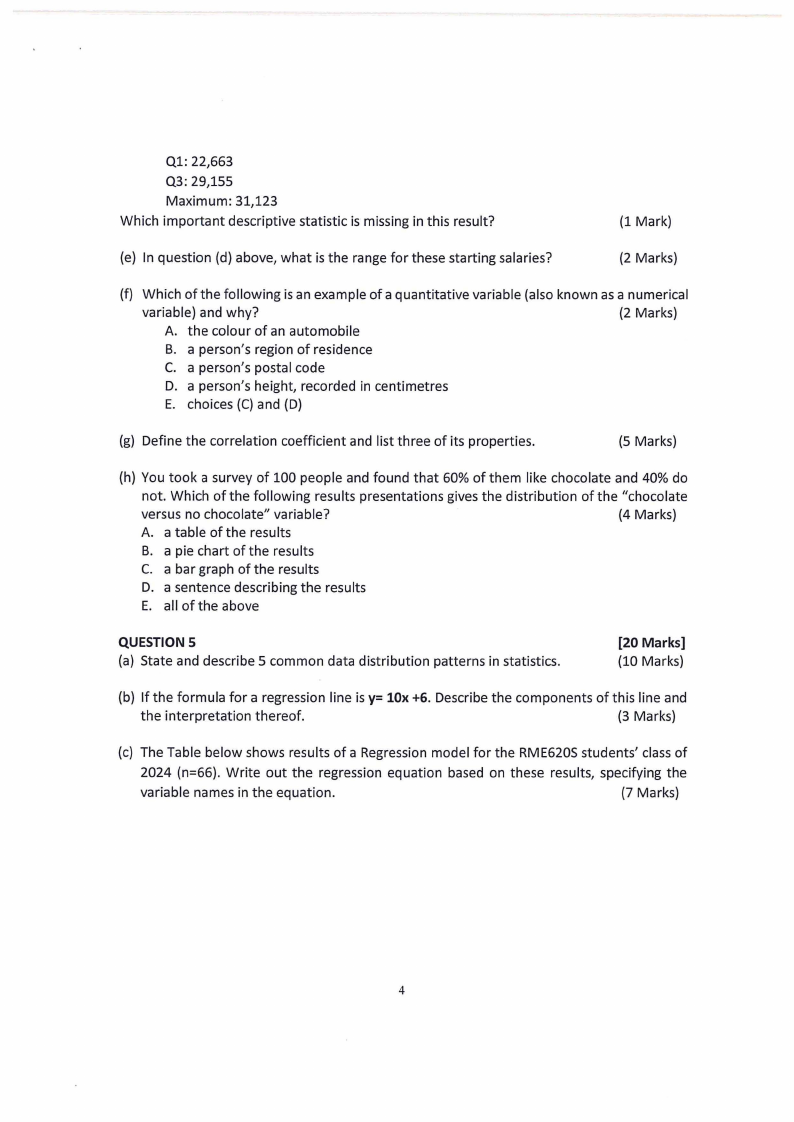
Ql: 22,663
Q3: 29,155
Maximum: 31,123
Which important descriptive statistic is missing in this result?
(1 Mark)
(e) In question (d) above, what is the range for these starting salaries?
(2 Marks)
(f) Which of the following is an example of a quantitative variable (also known as a numerical
variable) and why?
(2 Marks)
A. the colour of an automobile
B. a person's region of residence
C. a person's postal code
D. a person's height, recorded in centimetres
E. choices (C}and (D}
(g) Define the correlation coefficient and list three of its properties.
(5 Marks)
(h) You took a survey of 100 people and found that 60% of them like chocolate and 40% do
not. Which of the following results presentations gives the distribution of the "chocolate
versus no chocolate" variable?
(4 Marks)
A. a table of the results
B. a pie chart of the results
C. a bar graph of the results
D. a sentence describing the results
E. all of the above
QUESTION 5
(a) State and describe 5 common data distribution patterns in statistics.
[20 Marks]
(10 Marks)
(b) If the formula for a regression line is y= lOx +6. Describe the components of this line and
the interpretation thereof.
(3 Marks)
(c) The Table below shows results of a Regression model for the RME620Sstudents' class of
2024 (n=66). Write out the regression equation based on these results, specifying the
variable names in the equation.
(7 Marks)
4
|
|
5 Page 5 |
▲back to top |
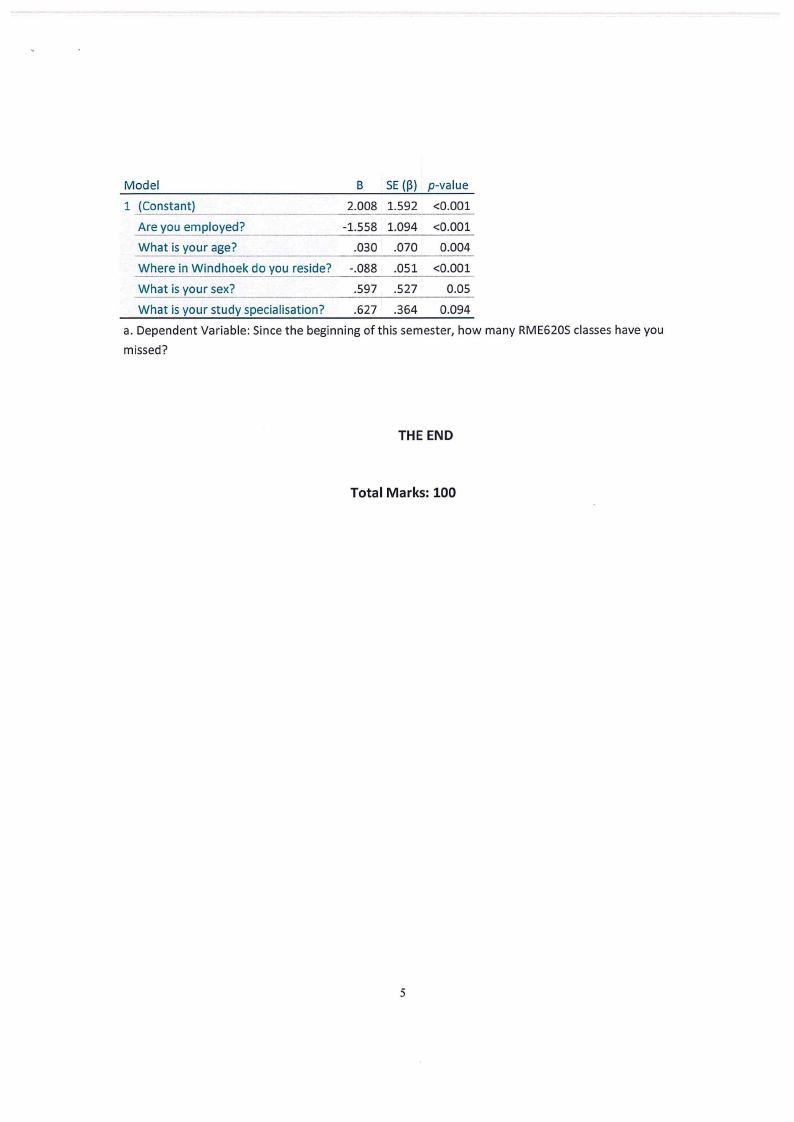
Model
B SE(~) p-value
1 (Constant)
2.008 1.592 <0.001
Are you employed?
-1.558 1.094 <0.001
What is your age?
.030 .070 0.004
Where in Windhoek do you reside? -.088 .051 <0.001
What is your sex?
.597 .527 0.05
What is your study specialisation?
.627 .364 0.094
a. Dependent Variable: Since the beginning of this semester, how many RME620S classes have you
missed?
THE END
Total Marks: 100
5