


 |
IAS502S - INTRODUCTION TO APPLIED STATISTICS - 1ST OPP - NOV 2022 |
|
|
1 Page 1 |
▲back to top |
nAmlBIA UnlVERSITY
OF SCIEnCE Ano TECHnou:iGY
FACULTYOF HEALTH,NATURAL RESOURCESAND APPLIEDSCIENCES
DEPARTMENT OF MATHEMATICS AND STATISTICS
QUALIFICATION: Bachelor of science; Bachelor of science in Applied Mathematics and Statistics
QUALIFICATION CODE: 07BSOC; 07BSAM
LEVEL: 5
COURSE CODE: IASS0lS
COURSE NA.ME: INTRODUCTION TO APPLIED
STATISTICS
SESSION: NOVEMBER 2022
DURATION: 3 HOURS
PAPER: THi:ORY
..
MARKS: .100
EXAMINER
MODERATOR:
FIRSTOPPORTUNITY EXAMINATION
QUESTION PAPER
Mr. A.J. ROUX
Dr. D. Ntirampeba
INSTRUCTIONS
1. Answer ALL the questions in the booklet provided.
2. Show clearly all the steps used in .~he calculations.
3. All written work must be done in-blue or black ink and sketches must
be done in pencil.
PERMISSIBLEMATERIALS
1. Non-programmable calculator without a cover.
ATTACHMENTS
1. The Standard Normal ( z ) Probability Distribution Table
2. Graph Paper x 1
THIS QUESTION PAPER CONSISTS OF 4 PAGES (Including this front page)
..
··.•
|
|
2 Page 2 |
▲back to top |
QUESTION 1
[151
1.1) For each of the following random variables, indicate if the random variable is
discrete or continuous
1.1.1) The weight of a new born baby
(1)
1.1.2) The number of stones in a basket
( 1)
1.1.3) The distance I walk to campus.
(1)
1.1.4) The number of assignments submitted by mail-
(1)
1.1.5) The height on a building
( 1)
1.2) In the section ( 1.2.1 to 1.2.5) below, you must give only the letter indicating
the correct answer to the question:
1.2.1) Which of the following measures of central tendency can reliably be used
when the dataset has outliers?
a) Mean
b) Median
c) Mode
d) All of the above
[21
1.2,2) Event A and B are said to be collectively exhaustive in statistics if,
•a) A and B are mutually exclusive
b) The union of A and B equals the sample space
c) The union of A and B is an empty set
d) The intersection of A and B is the same as the union
[21
1.2.3) Which of the following is NOT a possible probability
a)- 65
100
b)1.16
c) 0
d) All of the above
[21
1.2.4) Which one of the following variables is not categorical?
a) Age of a person.
b) Gender of a person
•;..
c) Choice on a test item
· d) · Marital status of a person
[21
1.2.5) If a doctor suspects that his patient has a 50% chance of surviving, the
probability of surviving in this case is an example of:
a) Simple probability
b) Conditional probability
c) Subjective probability
d) None of the above
[21
2
|
|
3 Page 3 |
▲back to top |
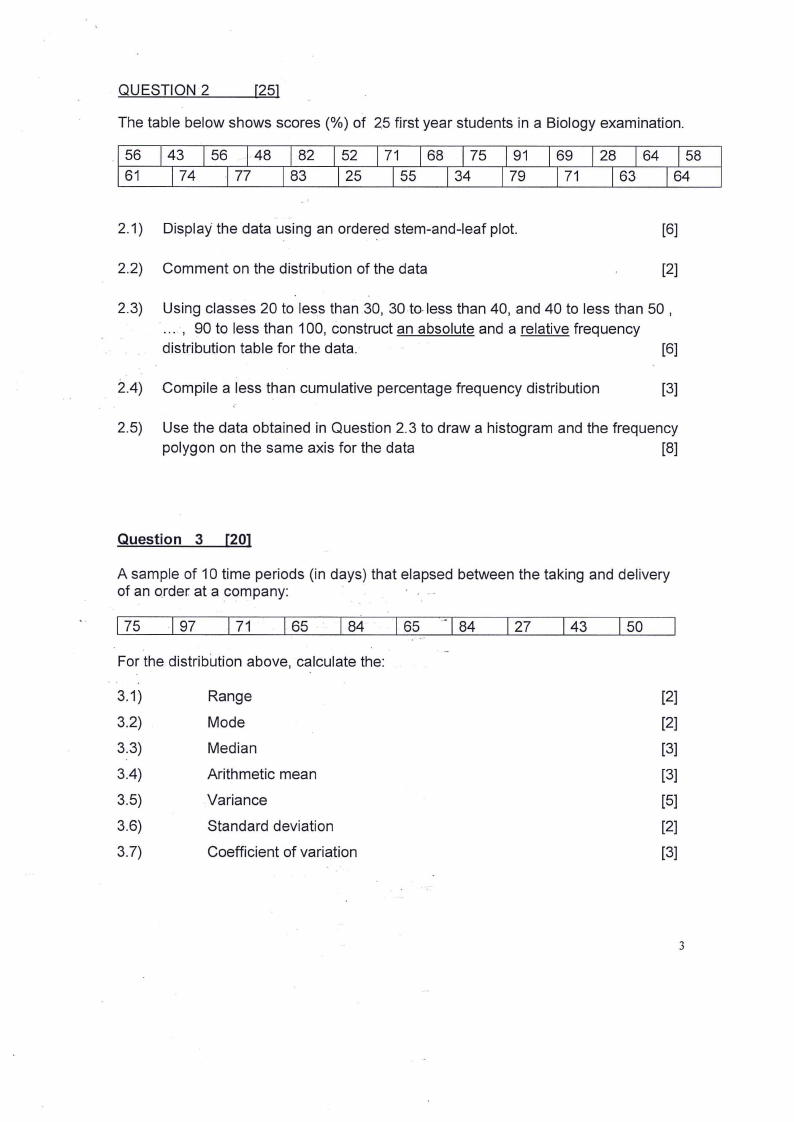
QUESTION 2
[25]
The table below shows scores(%) of 25 first year students in a Biology examination.
56 43 56 48 82 52 71 68 75 91 69 28 64 58
71
63
64
2.1) Display the data using an ordered stem-and-leaf plot.
[6]
2.2) Comment on the distribution of the data
[2]
2.3) Using classes 20 to less than 30, 30 to-less than 40, and 40 to less than 50 ,
·... , 90 to less than 100, construct an absolute and a relative frequency
distribution table for the data.
[61
2.4) Compile a less than cumulative percentage frequency distribution
[3]
2.5) Use the data obtained in Question 2.3 to draw a histogram and the frequency
polygon on the same axis for the data
[8]
Question 3 [20]
A sample of 10 time periods (in days) that elapsed between the taking and delivery
of an o.rder at a company:
I75 I 97 I 71 I 65 I 84 I 65 -184 I 27 I 43 I 50
For the distribution above, calculate the:
3.1)
Range
[2]
3.2)
Mode
[2]
3.3)
Median
[3]
3.4)
Arithmetic mean
[3]
3.5)
Variance
[5]
3.6)
Standard deviation
[2]
3.7)
Coefficient of variation
[3]
3
|
|
4 Page 4 |
▲back to top |
QUESTION 4
[25]
4.1) The average cost of providing a particular service per person per day is a random
variable having a normal distribution with average of N$100 and a standard
deviation of N$22.
4.1.1) Calculate the probability that the cost of providing the service will be at least
N$120 per day per person.
[5]
4.1.2) Calculate the probability that the cost of providing the service will be at least
N$60 per day per person.
[5]
4.1.3) Calculate the probability that the cost of providing the service will be at most
N$80 per day per person.
[5]
4.2) A sample of students wrote examination in three subjects, Biology, Chemistry,
and Physics. About 50% of the students wrote Biology, 30% of them wrote
Chemistry, and the rest wrote Physics. There was a two percent chance of failing
Biology, and also 2% chance of failing Chemistry while there was a three percent
chance of failing Physics. For the purpose of quality control, all the student
results are put in one container and one student is drawn.
4.2.1) Determine the probability of drawing a student who failed an examination. [7]
4.2.2) Determine the probability that the student who was drawn failed Biology. [3]
QUESTION 5 [15]
The table below shows the monthly salary for yellow collar workers (x N$ 1000)
recorded during the last decade by the Namio.i~Yellow Collar Workers Union
2013 2014 2015 2016 2017 2018 2091 2020 2021
4.2
4.8
3.7
3.4
4.3
5.6
4.3
3.8
4.1
5.1 Determine the least squares trend line equation, using the sequential coding
method with 2012 = 1 .
[9]
5.2 Use the trend line equation obtained in 5.1 to estimate monthly salaries for
2010 and 2025
[3 x 2 =6]
XXXXXXXXXX END OF QUESTION PAPER XXXXXXXXXXXX
4
|
|
5 Page 5 |
▲back to top |
•-+:-+-+I1-+--1: -+--+-+-+-li-+:l-+-+1-11-r-+-+-+,--+--I+--++--:'.,_1_,_+'-+-11-1-+--+-!f--+-t-+---<-+:-+-•---+'-+-:1-+-tr---++'l-++-I:-1--+-!-+il-+-·1---i-+1-+-+-l-+--Il-t--+-1.1--+:-,...::
l-++-f-+-l-f-++-il-l-+-i-t--l-l-t--l-1-t-·l-t-+-+
II
II
III
I
1+-il-t-+-i-t--H-t-+-l-++-t-+-+-l-+-++
1-1:,-++1-t-t-t--t-f-+-l-f-++-i-t-+-IH-+
III
1
II
I
_,_t--+-+-+l-lt--+-I
II
I
I
I
III
II I
I
I
I
II
II
I
II
l-+-+-++-+-+-i-++-l-+-+-H-l--+-tl-++-ll-++-+-+1-l-++-+-+l
III
II
I
I
-l-t--'l--t--+-l-'--+1-++-l-+i
I
I
I
I
I
I
7
I I II
II
I
I
-+-I IH-1+-f-1
+-H-l1H-+-r-1-f-ri+
II
I
l--+-+--+-l-l-+-+1-+-+-+-+ 1-+-+-+-17711t--+-+--+-i-l-+-+f---+-1--+
II
1-+-+-+-I
l-+1--t---i-l-f++-:H-
1-1--+-t-++--1-!-++-+--l-++-r+-++-:+--++·l-+--++-+-l-t-
I
I
I
II
II
II
I
I
1+-+1-+-1-t-++-f- 1 -1-f1-+:++-ll-+-1 1H--t-1·+t++-•-+-++
I
I
II
I
II
I
I
II
II
I
II
I
1-++-rl-+-+-ll-r1 ++ 1-11-+-+- 1 +-r-1
l-+-+--+-!-+-li-e-iil-e-1-+f---+-+-<---+-+I-+-+-il-+--1-i-:+1--1.,-t,-++-l-f--t--l
+-r+-1-+
:=~~== =J+:;:+ il±t,-t+
l-1-1-~-~
I1-;-11I- -l-1-t-I-cll-tI-;-,_+-I,-+I+-1¥1--+-1-+l-+-+I -+--+-+-+-11-+i
II
+-+--1-+I
-'11-1·-+-+-11-1-+-+I -+I-+-:+-l-t-++-r: +-ri +I-+-+'-,
I
--rTT,=!=l=++ -+-1+-+-,ffliff
1--I
I
I
I I: .I
III
I
II
I
I
I
:=:=l:=l:==sl
1-r-r-r----
l-r-r-r----
III
:I
l-t-+-i-H--t--+--1-t--l-+-t-++-l-t-++-H-H
I
I l 111
I
i gmI~=== I
I
I
I!
II
II
I II
I
:
:I :
I
II
II
II
1 -+-+-l-+-++--l-l·-c 1!-+1-t c-+-!-+--!-++-l-t-rl 1 -++-H-+-+-ll-+-1 1 -t--t--t-t-++-l-l
I
11
I
HT
+tF/=. -+1-++Fl=l= t--+-+--+-t--+-1!:-1+_-+-:ll-+-+-+-11-r-+-+--+-t--ll11-t--+---t=lili,_:-+-+-t-l
I
I:,: III
:I
I
-+-rl -r-1-
ii
I ::l:±:!il-t-,1 -1-H-+I +-1-rl -1-+I-I+-+I-1:H--'-H-+i -1-rl +-Hl-+,1-+: +--11-1
III
I :I I :I I II I:II
1-41---++r+
++tt-H.--+-i-1--t-+
1-11-+1++-1+:-c-1-++-r-t--+-+-1+-r-o-++ 1-1--+:-+-1-++-+-: +-+--l-+, 1++:-+-+-H-:1-1·-l:H-l -l:-+-l--+--!-+I.-1--+-+-H.-+-H-I
II
I
I
I
I
I
I
I
I
I
II
II
I
II
I I I I II
II
11
:=1=t 1=tt=t!ijit!j:=tj=tj=tj=tjr=t
1
111
III
I
II
I
11
II
I
II
11
I
11
I
II I I
I
II
II
I
I
I
I
I
I
II
11
II
11 I
I
II
I
1::=t1=t1=~t=tt=t::j~!j=t
II
I
I
II
II
I
I
I
I
=:=tj=tj=::j
1
II
II
II
II
I:
I
II
II
I
I
II
Ill
I Ill
II
I
II
I
II
I
II
I
I
I
I
II
I
II
II
I II
I
I
I
I
II
I
II
II I .,-,_,_1
II
I
I
_,_,_ 1.--,-1+-t-r-1+
II
I
I
II
I II I
=~ljl=t ~•I I I l-i-'-+-H-+l+-r+-!-+-tc-+-ll-++-+-l+-H-++-H-++l-+-i-1-1
11
l-+:-+-i-+-ll-l·-+-+il-1;1-e~-+l-11-+:-+-·H-+l-l!-+-i:_,_+-+:-+-:+:-+-+l-+-+-111-1-111-e-+-+:-1-+-11-+-+-l---+i-i-::+-+-l-t.1-t-+-:!+-+-+-+-+-!-+:-1-+e---+-+-+--+-+-t-l-1-.-+-+-+-1.
,_:+I +-11-1·+-i-i'-+-l-+-!-+I +-l-ll-+: +:-+:: -'-1--+: l-++-+--+:+·Hl-f-111-f+-+-: +-H-1--+:-+l:-+l-+I-,W:::'==I
! :=:: : 11 :::,=:I:=:::====::::::::;=:::
li!I
I
I
II
I
III
I
I
II
I
I
I
II
I
1-+-+--+-t-+-+-+1I-i -t--+-+-i-+--+-·1-t-+-+-+-l-+--+1II -+-+1--1-+-r-+-+-·l-, I1r-+-+-+-1-+-+-+--1-1-,
I
I
I
I
II
II
II
I
I
II
I
-+++-J- 1-t--1+ -+1--t-t--+-+--t-17
I
I
I
I
III
I
I
I
I
I
I
I
I
II
jl
I +-+--1-+1+1I-+-+-H-'-+ 1-IH
l-+-+-+-1-1·++-+1 '-+-l-+1+-+-!-l-+-+-,-+:-+-I-H 1 -+1+-H++-l-l-+-+-t-+1-•-Y-++-l-tttt-1-+,-+1-+-l-l-+-+-H--+-H:-++-H1-+1+1-+1+-r1+-H-l-+-!r+-1:~1-+-+-i-+-I
II
II
II
I I II I I I
II I I
II
I
I
II
I
I
I
I
II
I
I
II I I
I
I
II
I
I
I
I
I
I
III
I
I
II
I
III
I
I
I
II
I
I
I
I
I
III
II
I
I
II
I
I II
I
I
I
I
II
I
II
I
I
I
II
I
II
l-+I++-1-1·++I-+'-+-l-+-!-++-·H-++-+--l-+1 I +-+-+I1-l-+- 11+1--++·H-I+--+-+-l-++-HI-l-+-H-++-r
I
I
I
I II I I I I I I I I
I
I
II I
I
II
I III
I
II
I
II I I
I
II
I
II
I
I
I
II
II
II
II I
II
I
I
II
II
II
IIII
I
I
I
I
I
II
II
II
I
I
I
III
1+-'-I+-l-+--+ 1++-,-r-1 1-+-l-ri-'-+I-l-+
II
I
II
I II
II
I II I
I
II I
I
I
I
Ii I
II
II
I
I
II
II
I
II
II
I
II
I
II
II
III
II
II
I1-+-H·-+-+--!-+-I
II
I
I
+I +I +I +-
II
II
I!
I
I
I
|
|
6 Page 6 |
▲back to top |
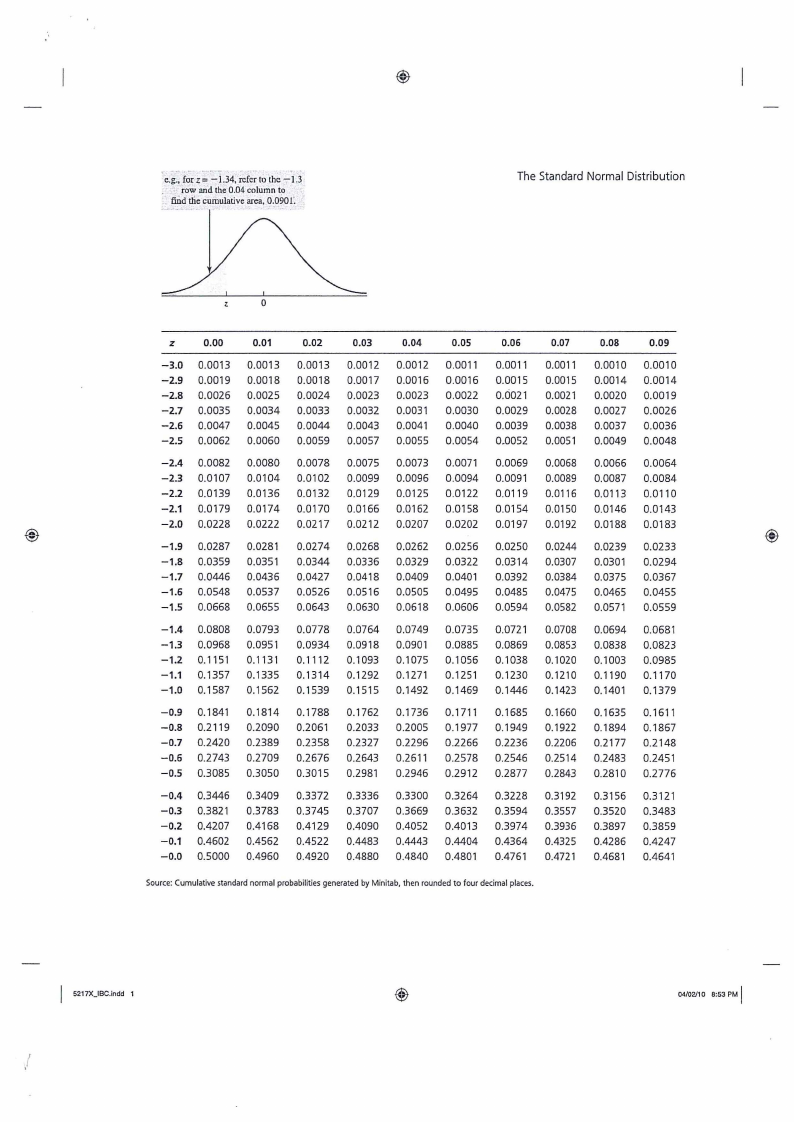
·-~.;.,for z = -1.34, refer to the -1.~
·. row and the 0.04 column to
the find cumulative area, 0:090 l'.
The Standard Normal Distribution
0
z
0.00
0.01
0.02
0.03
0.04
0.05
0.06
0.07
0.08
0.09
-3.0 0.0013 0.0013 0.0013 0.0012 0.0012 0.0011 0.0011 0.0011 0.0010 0.0010
-2.9 0.0019 0.0018 0.0018 0.0017 0.0016 0.0016 0.0015 0.0015 0.0014 0.0014
-2.8 0.0026 0.0025 0.0024 0.0023 0.0023 0.0022 0.0021 0.0021 0.0020 0.0019
-2.7 0.0035 0.0034 0.0033 0.0032 0.0031 0.0030 0.0029 0.0028 0.0027 0.0026
-2.6 0.0047 0.0045 0.0044 0.0043 0.0041 0.0040 0.0039 0.0038 0.0037 0.0036
-2.5 0.0062 0.0060 0.0059 0.0057 0.0055 0.0054 0.0052 0.0051 0.0049 0.0048
-2.4 0.0082 0.0080 0.0078 0.0075 0.0073 0.0071 0.0069 0.0068 0.0066 0.0064
-2.3 0.0107 0.0104 0.0102 0.0099 0.0096 0.0094 0.0091 0.0089 0.0087 0.0084
-2.2 0.0139 0.0136 0.0132 0.0129 0.0125 0.0122 0.0119 0.0116 0.0113 0.0110
-2.1 0.0179 0.0174 0.0170 0.0166 0.0162 0.0158 0.0154 0.0150 0.0146 0.0143
-2.0 0.0228 0.0222 0.0217 0.0212 0.0207 0.0202 0.0197 0.0192 0.0188 0.0183
©
@
-1.9 0.0287 0.0281 0.0274 0.0268 0.0262 0.0256 0.0250 0.0244 0.0239 0.0233
-1.8 0.0359 0.0351 0.0344 0.0336 0.0329 0.0322 0.0314 0.0307 0.0301 0.0294
-1.7 0.0446 0.0436 0.0427 0.0418 0.0409 0.0401 0.0392 0.0384 0.0375 0.0367
-1.6 0.0548 0.0537 0.0526 0.0516 0.0505 0.0495 0.0485 0.0475 0.0465 0.0455
-1.5 0.0668 0.0655 0.0643 0.0630 0.0618 0.0606 0.0594 0.0582 0.0571 0.0559
-1.4 0.0808 0.0793 0.0778 0.0764 0.0749 0.0735 0.0721 0.0708 0.0694 0.0681
-1.3 0.0968 0.0951 0.0934 0.0918 0.0901 0.0885 0.0869 0.0853 0.0838 0.0823
-1.2 0.1151 0.1131 0.1112 0.1093 0.1075 0.1056 0.1038 0.1020 0.1003 0.0985
-1.1 0.1357 0.1335 0.1314 0.1292 0.1271 0.1251 0.1230 0.1210 0.1190 0.1170
-1.0 0.1587 0.1562 0.1539 0.1515 0.1492 0.1469 0.1446 0.1423 0.1401 0.1379
-0.9 0.1841 0.1814 0.1788 0.1762 0.1736 0.1711 0.1685 0.1660 0.1635 0.1611
-0.8 0.2119 0.2090 0.2061 0.2033 0.2005 0.1977 0.1949 0.1922 0.1894 0.1867
-0.7 0.2420 0.2389 0.2358 0.2327 0.2296 0.2266 0.2236 0.2206 0.2177 0.2148
-0.6 0.2743 0.2709 0.2676 0.2643 0.2611 0.2578 0.2546 0.2514 0.2483 0.2451
-0.5 0.3085 0.3050 0.3015 0.2981 0.2946 0.2912 0.2877 0.2843 0.2810 0.2776
-0.4 0.3446 0.3409 0.3372 0.3336 0.3300 0.3264 0.3228 0.3192 0.3156 0.3121
-0.3 0.3821 0.3783 0.3745 0.3707 0.3669 0.3632 0.3594 0.3557 0.3520 0.3483
-0.2 0.4207 0.4168 0.4129 0.4090 0.4052 0.4013 0.3974 0.3936 0.3897 0.3859
-0.1 0.4602 0.4562 0.4522 0.4483 0.4443 0.4404 0.4364 0.4325 0.4286 0.4247
-0.0 0.5000 0.4960 0.4920 0.4880 0.4840 0.4801 0.4761 0.4721 0.4681 0.4641
Source:Cumulativestandard normal probabilitiesgenerated by Minitab,then rounded to four decimalplaces.
I 5217X_IBC.indd 1
/
I 04/02110 8:53 PM
|
|
7 Page 7 |
▲back to top |
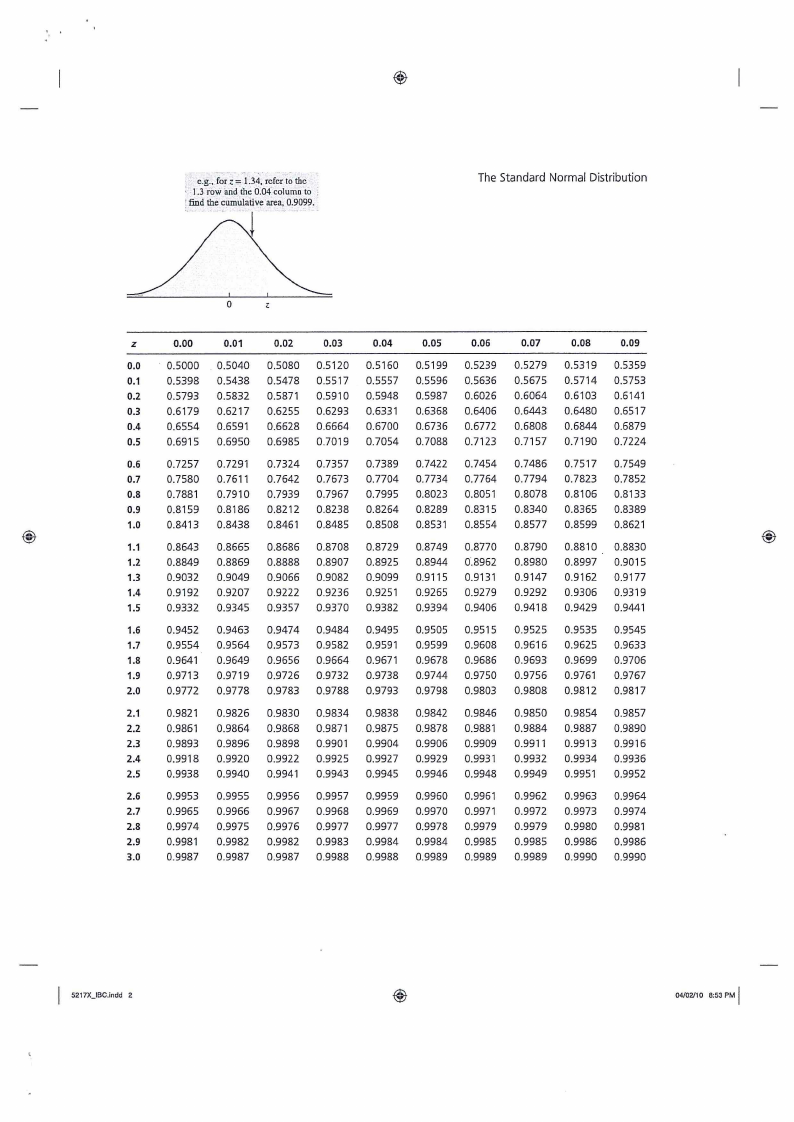
e.g:, for z = 1.34, refer to the
: -1.3 row and ·che0.04 column to :
, find the cumulative area, 0.9099.
The Standard Normal Distribution
0
z
0.00
0.01
0.02
0.03
0.04
0.05
0.06
0.07
0.08
0.09
0.0 · 0.5000 . 0.5040 0.5080 0.5120 0.5160 0.5199 0.5239 0.5279 0.5319 0.5359
0.1 0.5398 0.5438 0.5478 0.5517 0.5557 0.5596 0.5636 0.5675 0.5714 0.5753
0.2 0.5793 0.5832 0.5871 0.5910 0.5948 0.5987 0.6026 0.6064 0.6103 0.6141
0.3 0.6179 0.6217 0.6255 0.6293 0.6331 0.6368 0.6406 0.6443 0.6480 0.6517
0.4 0.6554 0.6591 0.6628 0.6664 0.6700 0.6736 0.6772 0.6808 0.6844 0.6879
0.5 0.6915 0.6950 0.6985 0.7019 0.7054 0.7088 0.7123 0.7157 0.7190 0.7224
0.6 0.7257 0.7291 0.7324 0.7357 0.7389 0.7422 0.7454 0.7486 0.7517 0.7549
0.7 0.7580 0.7611 0.7642 0.7673 0.7704 0.7734 0.7764 0.7794 0.7823 0.7852
0.8 0.7881 0.7910 0.7939 0.7967 0.7995 0.8023 0.8051 0.8078 0.8106 0.8133
0.9 0.8159 0.8186 0.8212 0.8238 0.8264 0.8289 0.8315 0.8340 0.8365 0.8389
1.0 0.8413 0.8438 0.8461 0.8485 0.8508 0.8531 0.8554 0.8577 0.8599 0.8621
©
1.1 0.8643 0.8665 0.8686 0.8708 0.8729 0.8749 0.8770 0.8790 0.8810 0.8830
©
1.2 0.8849 0.8869 0.8888 0.8907 0.8925 0.8944 0.8962 0.8980 0.8997 0.9015
1.3 0.9032 0.9049 0.9066 0.9082 0.9099 0.9115 0.9131 0.9147 0.9162 0.9177
1.4 0.9192 0.9207 0.9222 0.9236 0.9251 0.9265 0.9279 0.9292 0.9306 0.9319
1.5 0.9332 0.9345 0.9357 0.9370 0.9382 0.9394 0.9406 0.9418 0.9429 0.9441
1.6 0.9452 0.9463 0.9474 0.9484 0.9495 0.9505 0.9515 0.9525 0.9535 0.9545
1.7 0.9554 0.9564 0.9573 0.9582 0.9591 0.9599 0.9608 0.9616 0.9625 0.9633
1.8 0.9641 0.9649 0.9656 0.9664 0.9671 0.9678 0.9686 0.9693 0.9699 0.9706
1.9 0.9713 0.9719 0.9726 0.9732 0.9738 0.9744 0.9750 0.9756 0.9761 0.9767
2.0 0.9772 0.9778 0.9783 0.9788 0.9793 0.9798 0.9803 0.9808 0.9812 0.9817
2.1 0.9821 0.9826 0.9830 0.9834 0.9838 0.9842 0.9846 0.9850 0.9854 0.9857
2.2 0.9861 0.9864 0.9868 0.9871 0.9875 0.9878 0.9881 0.9884 0.9887 0.9890
2.3 0.9893 0.9896 0.9898 0.9901 0.9904 0.9906 0.9909 0.9911 0.9913 0.9916
2.4 0.9918 0.9920 0.9922 0.9925 0.9927 0.9929 0.9931 0.9932 0.9934 0.9936
2.5 0.9938 0.9940 0.9941 0.9943 0.9945 0.9946 0.9948 0.9949 0.9951 0.9952
2.6 0.9953 0.9955 0.9956 0.9957 0.9959 0.9960 0.9961 0.9962 0.9963 0.9964
2.7 0.9965 0.9966 0.9967 0.9968 0.9969 0.9970 0.9971 0.9972 0.9973 0.9974
2.8 0.9974 0.9975 0.9976 0.9977 0.9977 0.9978 0.9979 0.9979 0.9980 0.9981
2.9 0.9981 0.9982 0.9982 0.9983 0.9984 0.9984 0.9985 0.9985 0.9986 0.9986
3.0 0.9987 0.9987 0.9987 0.9988 0.9988 0.9989 0.9989 0.9989 0.9990 0.9990
5217X_IBC.indd 2
I 04/02/10 8:53 PM