|
CAN811S- COMPUTER APPLICATIONS IN NUTRITION - 1st Opp - JUNE 2022 |
|
|
1 Page 1 |
▲back to top |
|
|
2 Page 2 |
▲back to top |
|
|
3 Page 3 |
▲back to top |
|
|
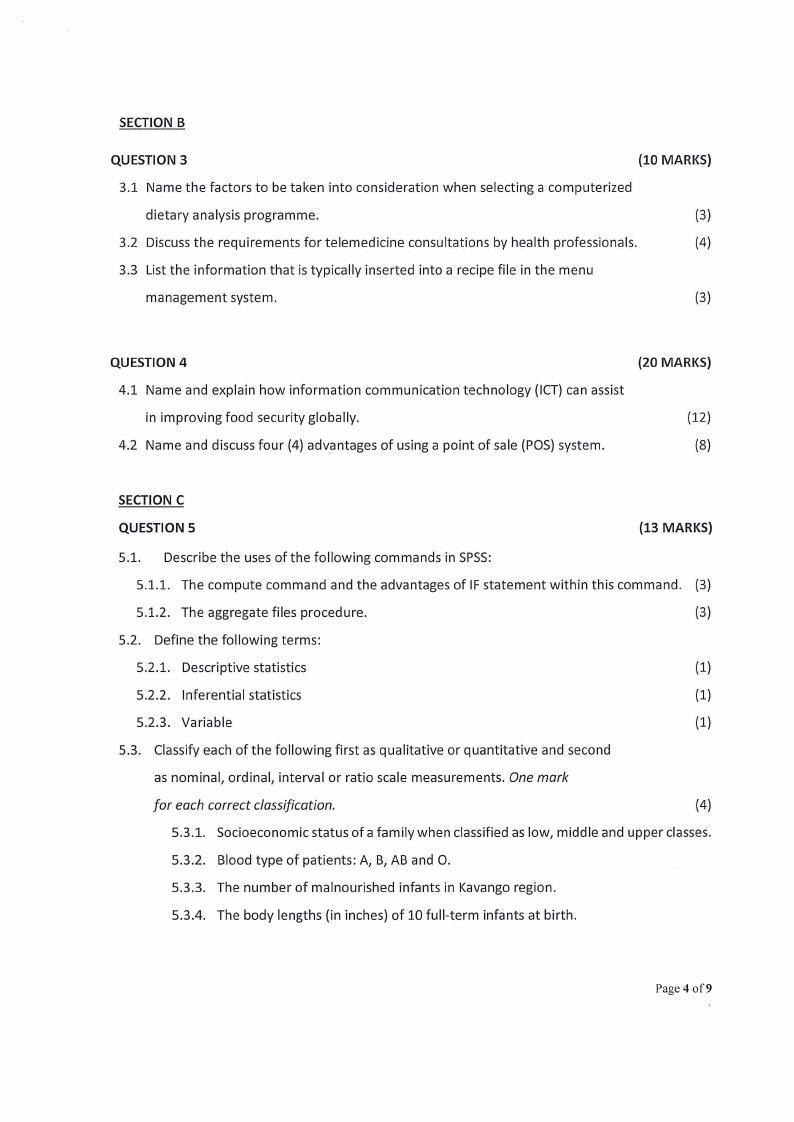
4 Page 4 |
▲back to top |
|
|
5 Page 5 |
▲back to top |
|
|
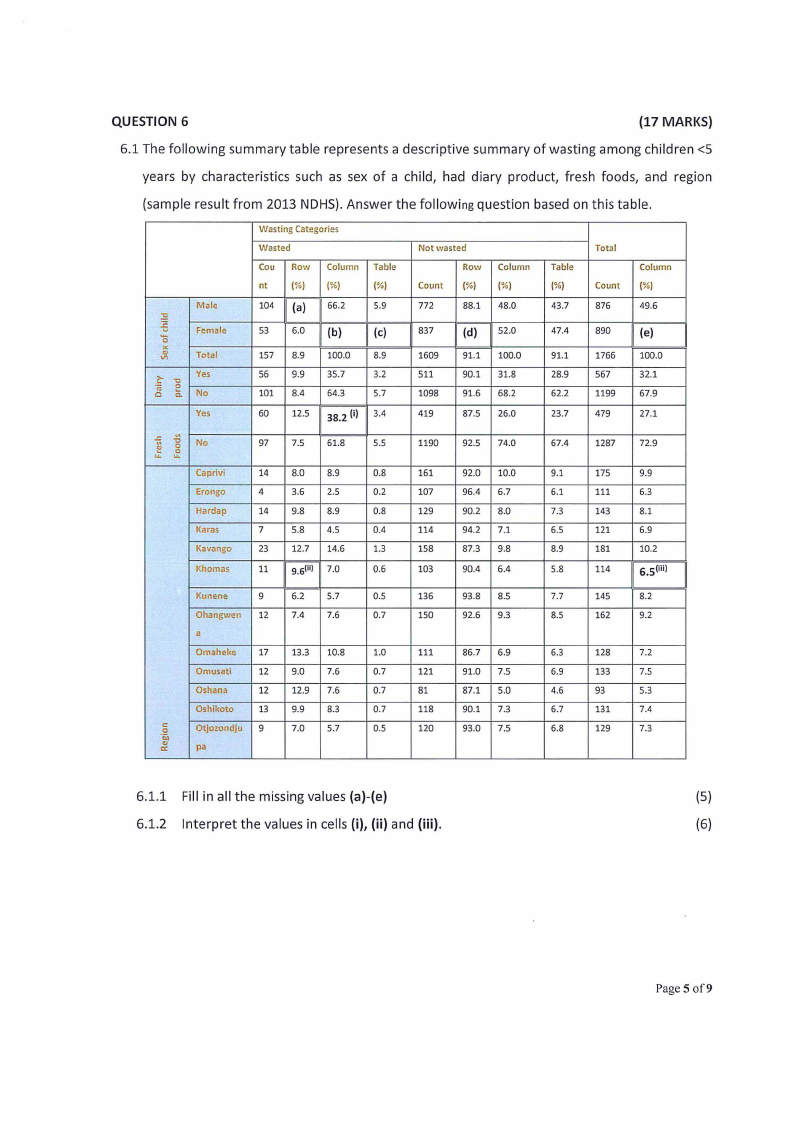
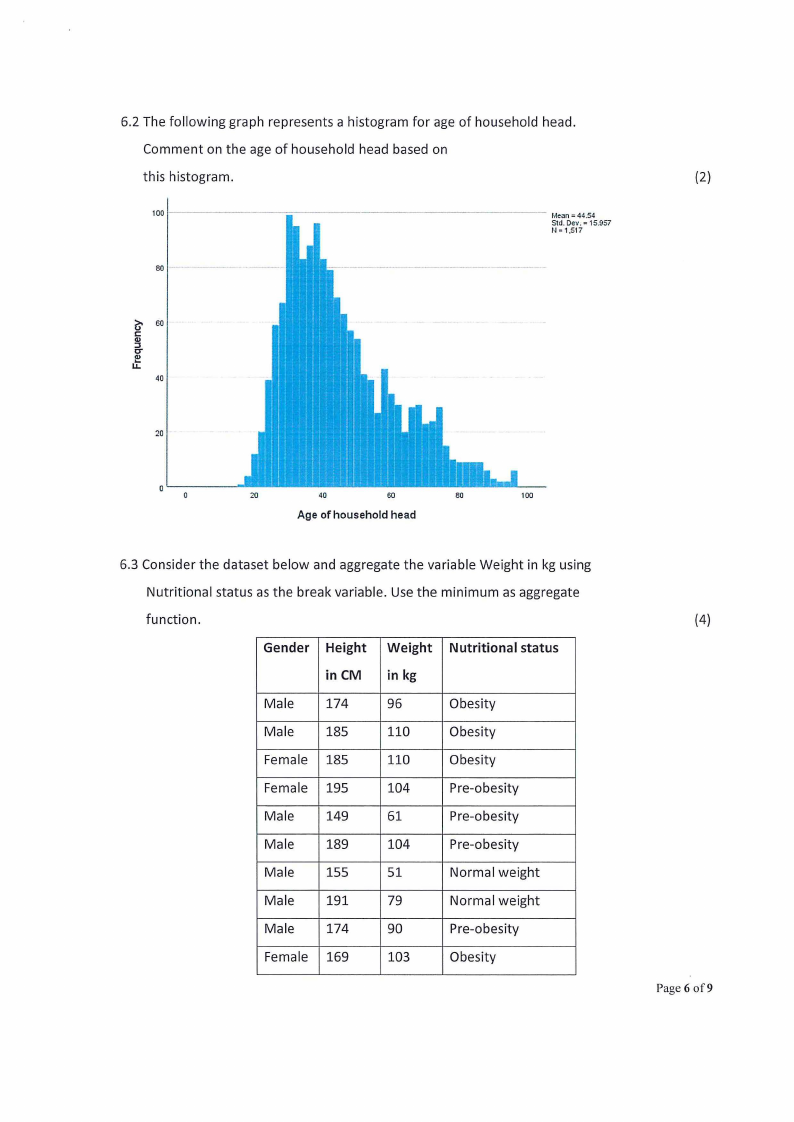
6 Page 6 |
▲back to top |
|
|
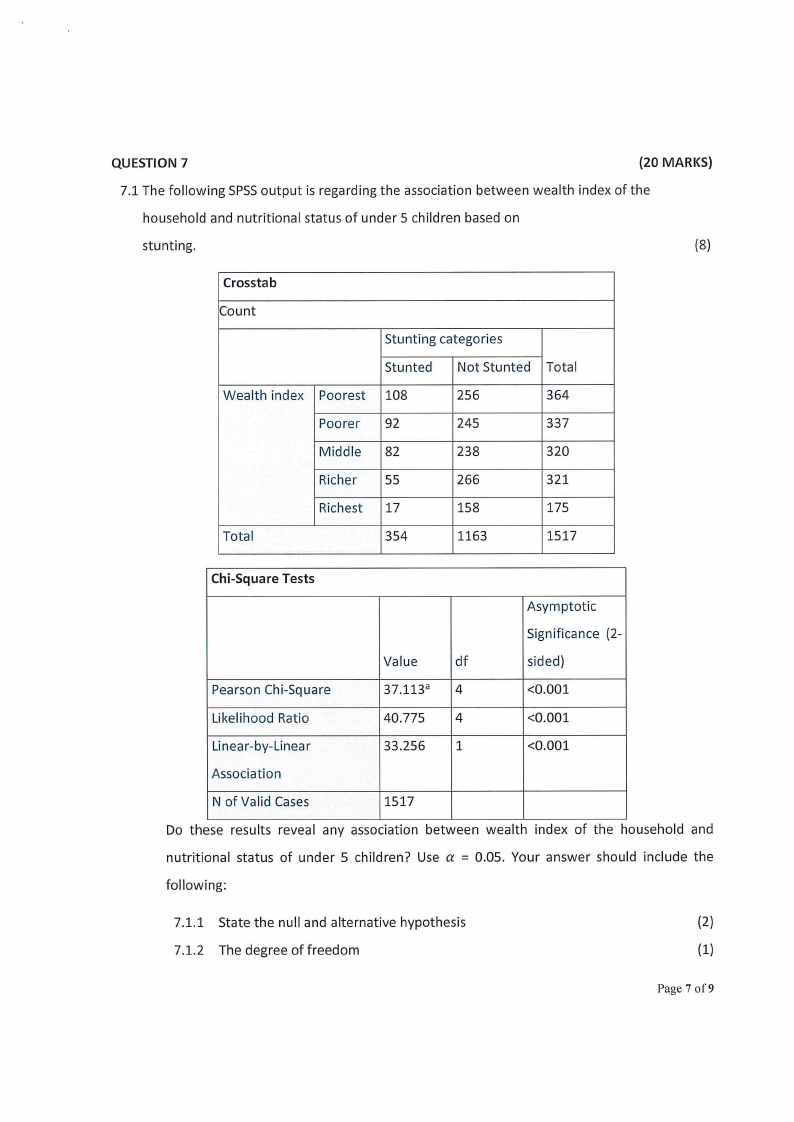
7 Page 7 |
▲back to top |
|
|
8 Page 8 |
▲back to top |
|
|
9 Page 9 |
▲back to top |