


 |
BBS111S - BASIC BUSINESS - 2ND OPP - JULY 2022 |
|
|
1 Page 1 |
▲back to top |
NAMIBIA UNIVERSITY
OF SCIENCE AND TECHNOLOGY
Faculty of Health, Applied Sciences and Natural Resources
Department of Mathematics and Statistics
QUALIFICATIONS: B. Business Admin, B. Marketing, B. Human
Management and B. Logistics and Supply Chain Management
QUALIFICATION CODES: 21BBAD / 07BMAR/
O7BHR / 24BPN / 07BLSM
LEVEL: 6 -
Resource
Management,
COURSE: BASIC BUSINESS STATISTICS 1A
COURSE CODE: BBS111S
B. Public
DATE: JULY 2022
SESSION: 2
DURATION: 3 HOURS
MARKS: 100
SUPPLEMENTARY/SECOND OPPORTUNITY EXAMINATION QUESTION PAPER
EXAMINER(S)
MR EM MWAHI, MR S KASHIHALWA, DR G DIBABA, MR J AMUNYELA,
MR G TAPEDZESA, DR J MWANYEKANGE, MR A ROUX
MODERATOR:
MRJ SWARTZ
THIS QUESTION PAPER CONSISTS OF 6 PAGES
(Including this front page)
INSTRUCTIONS
1. Answer all the questions and number your solutions correctly.
2. Question 1 of this question paper entails multiple choice questions with options A to
D. Write down the letter corresponding to the best option for each question.
3. For Question 2 & 3 you are required to show clearly all the steps used in the
calculations.
4. All written work MUST be done in blue or black ink.
5. Untidy/ illegible work will attract no marks.
PERMISSIBLE MATERIALS
1. Non-Programmable Calculator without the cover
ATTACHMENTS
1. Standard normal Z-table
|
|
2 Page 2 |
▲back to top |
QUESTION 1 [30 MARKS]
Write down the letter corresponding to the best answer for each question.
1.1
If you have a digital scale in your home that only reads in integers, is your weight a
discrete variable?
[2]
A. It depends on the accuracy of the scale.
B. It depends on your weight.
C. No because weight is still a continuous variable regardless of the ability to
measure it.
D. Yes because the scale reports integers.
1.2 A student goes to the library. The probability that she checks out (a) a work of fiction
is 0.40, (b) a work of non-fiction is 0.30, and (c) both fiction and non-fiction is 0.20.
What is the probability that the student checks out a work of fiction, non-fiction, or
both?
[2]
A. 0.50
B. 0.70
C. 0.40
D. 0.60
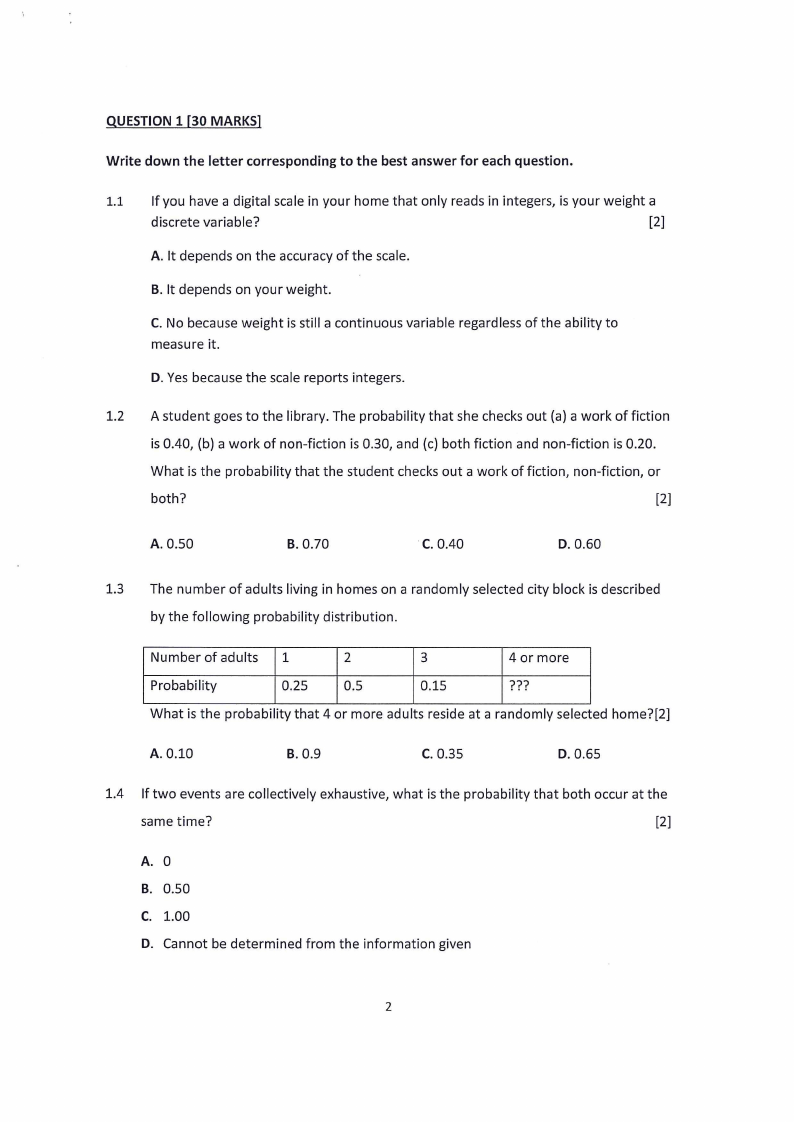
1.3 The number of adults living in homes on a randomly selected city block is described
by the following probability distribution.
Number of adults
1
2
3
4 or more
Probability
0.25
0.5
0.15
2???
What is the probability that 4 or more adults reside at a randomly selected home?[2]
A. 0.10
B. 0.9
C.0.35
D. 0.65
1.4 If two events are collectively exhaustive, what is the probability that both occur at the
same time?
[2]
A. 0
B. 0.50
C. 1.00
D . Cannot be determined from the information given
|
|
3 Page 3 |
▲back to top |
15 A company has 125 personal computers. The probability that any one of them will
require repair on a given day is 0.025. To find the probability that exactly 20 of the
computers will require repair, one will use what type of probability distribution? [2]
A. Binomial distribution.
B. Poisson distribution.
C. Normal distribution.
D. Uniform distribution.
1.6 When re-ordering, a shop owner is interested in ordering different jean sizes. Looking
at the sales data, which measure of central tendency is useful to him?
[2]
A. Mean
B. Median
Cc. Mode
D. Variance
1.7
Researchers do sampling because of all of the following reasons except
[2]
A. Reduce cost
B. Can be done in a shorter time frame
C. Sampling is interesting
D. Easy to manage due to manageable logistics requirements
1.8
In a grouped frequency distribution the class intervals should be mutually exclusive.
This means that they should be:
[2]
A. Of the same length
B. Open-ended
C. Not overlapping
D. Not open ended
1.9 On the average, 1.8 customers per minute arrive at any one of the checkout counters
at Shoprite. What type of probability distribution can be used to find out the
probability that there will be no customer arriving at a checkout counter?
[2]
A. Uniform distribution
B. Binomial distribution
C. Poisson distribution
D. Normal distribution
1.10 Asurvey:
[2]
A. Is the enumeration of a subset of the population
B. Is the enumeration of the whole population
C. Is a sample survey
D. Is a simple random sample
|
|
4 Page 4 |
▲back to top |
1.11 Which of the following variables gives you continuous data?
[2]
A. Gender
B. Height
C. Number of people D. None
1.12 Astudent is chosen at random from a class of 5 girls and 20 boys. What is the
probability that the student chosen is a boy?
[2]
A. 0.8
B. 0.20
Cc. 0.50
D.0
1.13 Fill in the blank to make the following sentence true. “The
of a particular
outcome is the number of times it occurs within a specific sample of a population.[”2]
A. Frequency
B. Variance
C. Mean deviation
D. Distribution
1.14 Primary data are collected by:
[2]
A. Primary school children
B. People doing it for the first time
C. The actual people who will be using it D. Mainly elderly people
1.15 Measures of variation include:
[2]
A. mean, range and skewness
B. mean, median, mode and range
C. range, variance and standard deviation
D. mean, median, mode and variance
|
|
5 Page 5 |
▲back to top |
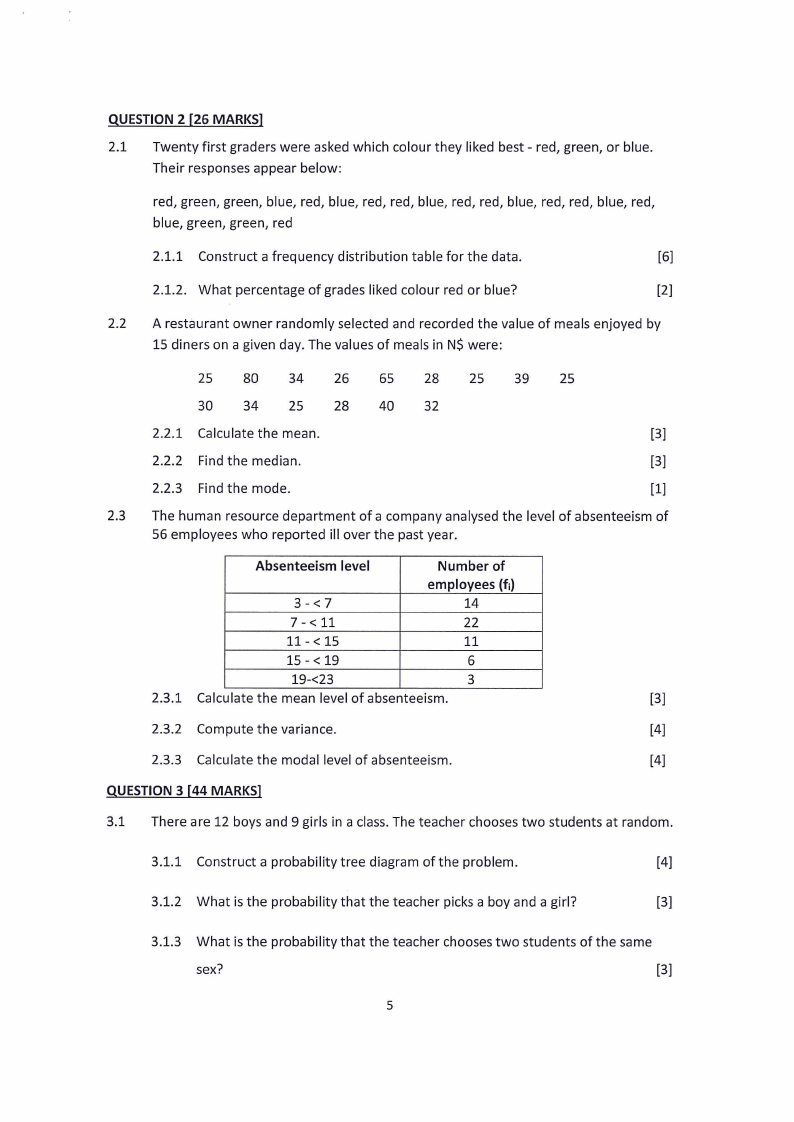
QUESTION 2 [26 MARKS]
2.1 Twenty first graders were asked which colour they liked best - red, green, or blue.
Their responses appear below:
red, green, green, blue, red, blue, red, red, blue, red, red, blue, red, red, blue, red,
blue, green, green, red
2.1.1 Construct a frequency distribution table for the data.
[6]
2.1.2. What percentage of grades liked colour red or blue?
[2]
2.2 A restaurant owner randomly selected and recorded the value of meals enjoyed by
15 diners on a given day. The values of meals in NS were:
25
80
34
26
65
28
25
39
25
30
34
25
28
40
32
2.2.1 Calculate the mean.
[3]
2.2.2 Find the median.
[3]
2.2.3. Find the mode.
[1]
2.3 The human resource department of a company analysed the level of absenteeism of
56 employees who reported ill over the past year.
Absenteeism level
3-<7
Number of
employees (fi)
14
7-<11
22
11-<15
11
15-<19
6
19-<23
3
2.3.1 Calculate the mean level of absenteeism.
[3]
2.3.2. Compute the variance.
[4]
2.3.3 Calculate the modal level of absenteeism.
[4]
QUESTION 3 [44 MARKS]
3.1 There are 12 boys and 9 girls in a class. The teacher chooses two students at random.
3.1.1 Construct a probability tree diagram of the problem.
[4]
3.1.2 What is the probability that the teacher picks a boy and a girl?
[3]
3.1.3. What is the probability that the teacher chooses two students of the same
sex?
[3]
|
|
6 Page 6 |
▲back to top |
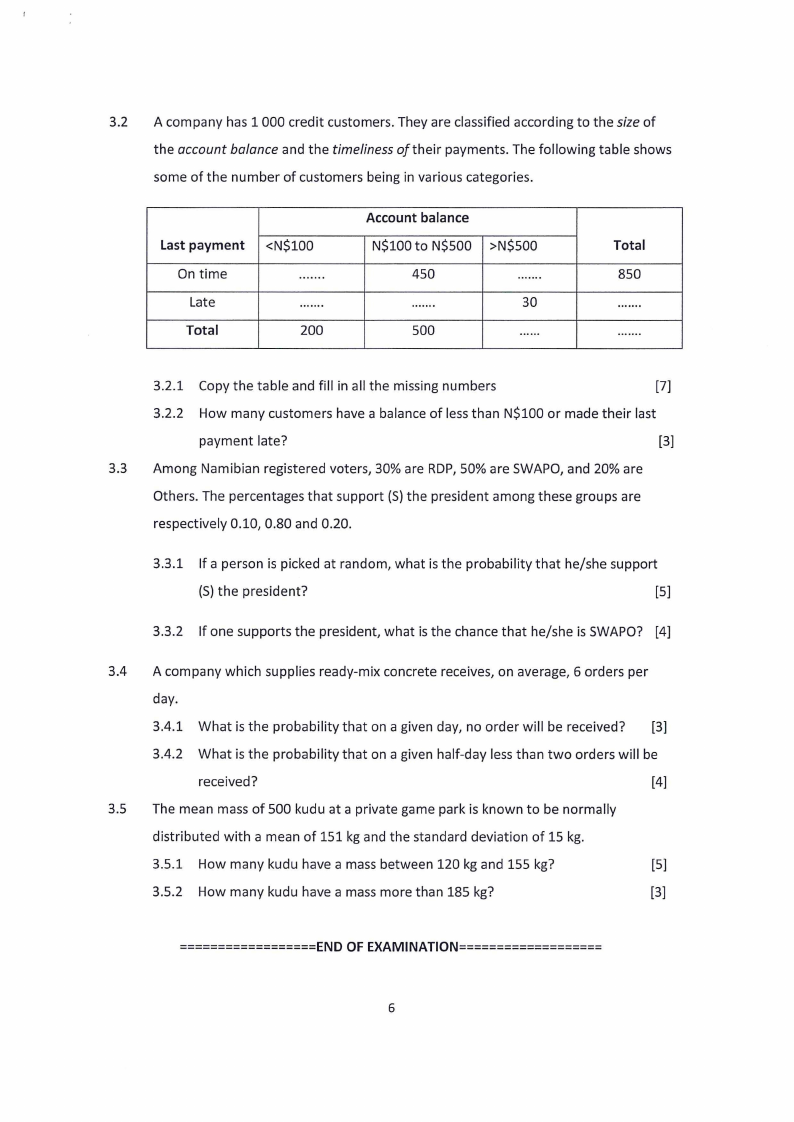
3.2 A company has 1 000 credit customers. They are classified according to the size of
the account balance and the timeliness of their payments. The following table shows
some of the number of customers being in various categories.
Last payment | <NS100
Ontime |
uae.
Late = ||
sssses
Total
200
Account balance
NS100 to NS500 | >NS500
Total
A500
fea
850
a|tta
SO
fastens
SOG
fess, Seman
3.2.1 Copy the table and fill in all the missing numbers
[7]
3.2.2 How many customers have a balance of less than NS$100 or made their last
payment late?
[3]
3.3
Among Namibian registered voters, 30% are RDP, 50% are SWAPO, and 20% are
Others. The percentages that support (S) the president among these groups are
respectively 0.10, 0.80 and 0.20.
3.3.1 Ifa person is picked at random, what is the probability that he/she support
(S) the president?
[5]
3.3.2 If one supports the president, what is the chance that he/she is SWAPO? [4]
3.4 A company which supplies ready-mix concrete receives, on average, 6 orders per
day.
3.4.1 What is the probability that on a given day, no order will be received? _— [3]
3.4.2 What is the probability that on a given half-day less than two orders will be
received?
[4]
3.5 The mean mass of 500 kudu at a private game park is known to be normally
distributed with a mean of 151 kg and the standard deviation of 15 kg.
3.5.1 How many kudu have a mass between 120 kg and 155 kg?
[5]
3.5.2. How many kudu have a mass more than 185 kg?
[3]
|
|
7 Page 7 |
▲back to top |
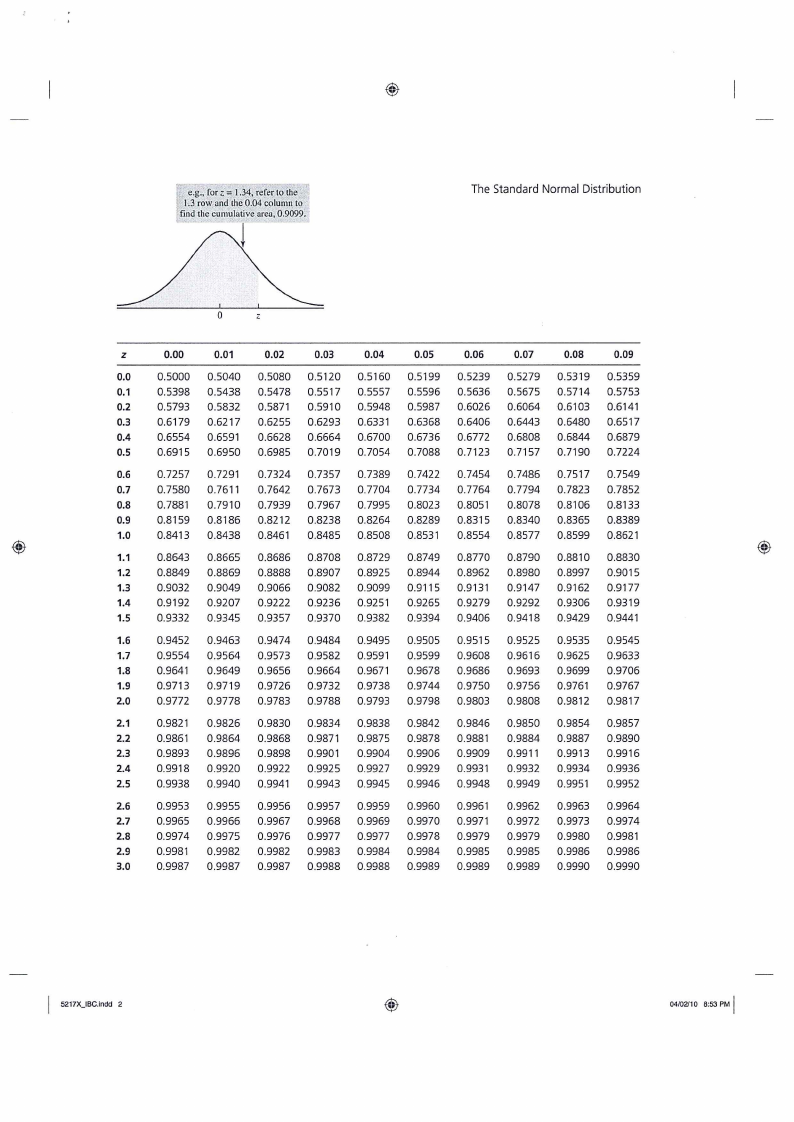
eg. forz = 1.34, refer to the
1.3 row and the 0.04 column to
! find the cumulative area, 0.9099,
The Standard Normal Distribution
0
Zz
z
0.00
0.01
0.02
0.03
0.04
0.05
0.06
0.07
0.08
0.09
0.0
0.5000
0.5040
0.5080
0.5120
0.5160
0.5199
0.5239
0.5279
0.5319
0.5359
0.1
0.5398
0.5438
0.5478
0.5517
0.5557
0.5596
0.5636
0.5675
0.5714
0.5753
0.2
0.5793
0.5832
0.5871
0.5910
0.5948
0.5987
0.6026
0.6064
0.6103
0.6141
0.3
0.6179
0.6217
0.6255
0.6293
0.6331
0.6368
0.6406
0.6443
0.6480
0.6517
0.4
0.6554
0.6591
0.6628
0.6664
0.6700 0.6736
0.6772
0.6808
0.6844
0.6879
0.5
0.6915
0.6950
0.6985
0.7019
0.7054
0.7088
0.7123
0.7157
0.7190
0.7224
0.6
0.7257 = =0.7291
0.7324
0.7357
0.7389
0.7422
0.7454
0.7486
0.7517
0.7549
0.7
0.7580
0.7611
0.7642
0.7673
0.7704 0.7734
0.7764
0.7794
0.7823
0.7852
0.8
0.7881
0.7910
0.7939
0.7967
0.7995
0.8023
0.8051
0.8078
0.8106
0.8133
0.9
0.8159
0.8186
0.8212
0.8238
0.8264
0.8289
0.8315
0.8340
0.8365
0.8389
1.0
0.8413
0.8438
0.8461
0.8485
0.8508
0.8531
0.8554
0.8577
0.8599
0.8621
1.1
0.8643
0.8665
0.8686
0.8708
0.8729
0.8749
0.8770
0.8790
0.8810
0.8830
1.2
0.8849
0.8869
0.8888
0.8907
0.8925
0.8944
0.8962
0.8980
0.8997
0.9015
1.3
0.9032
0.9049
0.9066
0.9082
0.9099
0.9115
0.9131
0.9147.
0.9162
0.9177
1.4
0.9192
0.9207
0.9222
0.9236
0.9251
0.9265
0.9279
0.9292
0.9306
0.9319
15
0.9332
0.9345
0.9357
0.9370
0.9382
0.9394
0.9406
0.9418
0.9429
0.9441
1.6
0.9452
0.9463
0.9474
0.9484
0.9495
0.9505
0.9515
0.9525
0.9535
0.9545
1.7
0.9554
0.9564
0.9573
0.9582
0.9591
0.9599
0.9608
0.9616
0.9625
0.9633
1.8
0.9641
0.9649
0.9656
0.9664
0.9671
0.9678
0.9686
0.9693
0.9699
0.9706
1.9
0.9713.
0.9719
0.9726
0.9732
0.9738
0.9744
0.9750
0.9756
0.9761
0.9767
2.0
0.9772
0.9778
0.9783
0.9788
0.9793
0.9798
0.9803
0.9808
0.9812
0.9817
2.1
0.9821
0.9826
0.9830
0.9834
0.9838
0.9842
0.9846
0.9850
0.9854
0.9857
2.2
0.9861
0.9864
0.9868
0.9871
0.9875
0.9878
0.9881
0.9884
0.9887
0.9890
2.3
0.9893
0.9896
0.9898
0.9901
0.9904
0.9906
0.9909
0.9911
0.9913
0.9916
2.4
0.9918
0.9920
0.9922
0.9925
0.9927
0.9929
0.9931
0.9932
0.9934
0.9936
2.5
0.9938
0.9940
0.9941
0.9943
0.9945
0.9946
0.9948
0.9949
0.9951
0.9952
2.6
0.9953
0.9955
0.9956
0.9957
0.9959
0.9960
0.9961
0.9962
0.9963
0.9964
2.7
0.9965
0.9966
0.9967
0.9968
0.9969
0.9970
0.9971
0.9972
0.9973
0.9974
2.8
0.9974
0.9975
0.9976
0.9977
0.9977
0.9978
0.9979
0.9979
0.9980
0.9981
2.9
0.9981
0.9982
0.9982
0.9983
0.9984
0.9984
0.9985
0.9985
0.9986
0.9986
3.0
0.9987
0.9987
0.9987
0.9988
0.9988
0.9989
0.9989
0.9989
0.9990
0.9990
5217X_IBC.indd 2
04/02/10 8:53 PM
|
|
8 Page 8 |
▲back to top |
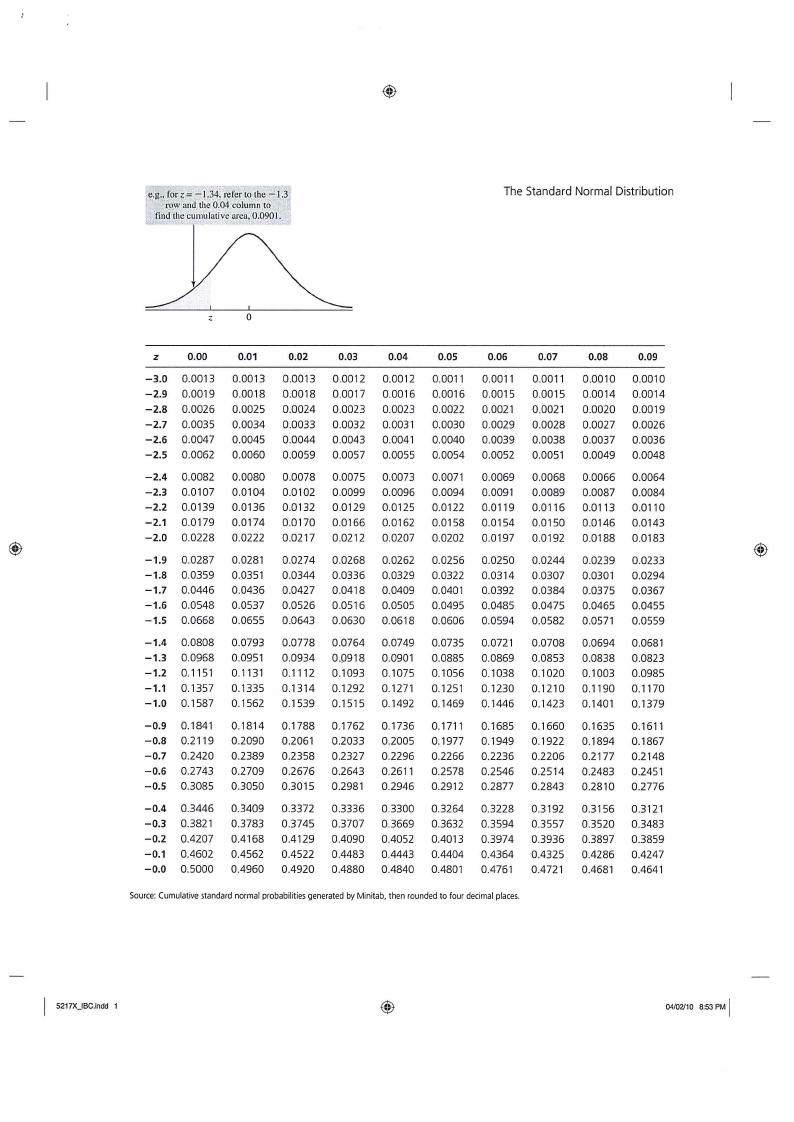
e.g., for z= —1.34, refer to the —1.3
‘row and the 0.04 column to
find the cumulative area, 0.0901.
The Standard Normal Distribution
Zz
0
z
-3.0
-2.9
—2.8
-2.7.
-2.6
-—2.5
—2.4
-2.3
-2.2.
-2.1
—2.0
-1.9
-1.8
-1.7.
-1.6
-1.5
-1.4
-1.3
-1.2.
-1.1
-1.0
-0.9
-0.8
-0.7.
-0.6
-0.5
-0.4
-0.3
-0.2.
-0.1
-0.0
0.00
0.0013
0.0019
0.0026
0.0035
0.0047
0.0062
0.0082
0.0107
0.0139
0.0179
0.0228
0.0287
0.0359
0.0446
0.0548
0.0668
0.0808
0.0968
0.1151
0.1357
0.1587
0.1841
0.2119
0.2420
0.2743
0.3085
0.3446
0.3821
0.4207
0.4602
0.5000
0.01
0.0013
0.0018
0.0025
0.0034
0.0045
0.0060
0.0080
0.0104
0.0136
0.0174
0.0222
0.0281
0.0351
0.0436
0.0537
0.0655
0.0793
0.0951
0.1131
0.1335
0.1562
0.1814
0.2090
0.2389
0.2709
0.3050
0.3409
0.3783
0.4168
0.4562
0.4960
0.02
0.0013
0.0018
0.0024
0.0033
0.0044
0.0059
0.0078
0.0102
0.0132
0.0170
0.0217
0.0274
0.0344
0.0427
0.0526
0.0643
0.0778
0.0934
0.1112
0.1314
0.1539
0.1788
0.2061
0.2358
0.2676
0.3015
0.3372
0.3745
0.4129
0.4522
0.4920
0.03
0.0012
0.0017
0.0023
0.0032
0.0043
0.0057
0.0075
0.0099
0.0129
0.0166
0.0212
0.0268
0.0336
0.0418
0.0516
0.0630
0.0764
0.0918
0.1093
0.1292
0.1515
0.1762
0.2033
0.2327
0.2643
0.2981
0.3336
0.3707
0.4090
0.4483
0.4880
0.04
0.0012
0.0016
0.0023
0.0031
0.0041
0.0055
0.0073
0.0096
0.0125
0.0162
0.0207
0.0262
0.0329
0.0409
0.0505
0.0618
0.0749
0.0901
0.1075
0.1271
0.1492
0.1736
0.2005
0.2296
0.2611
0.2946
0.3300
0.3669
0.4052
0.4443
0.4840
0.05
0.0011
0.0016
0.0022
0.0030
0.0040
0.0054
0.0071
0.0094
0.0122
0.0158
0.0202
0.0256
0.0322
0.0401
0.0495
0.0606
0.0735
0.0885
0.1056
0.1251
0.1469
0.1711
0.1977
0.2266
0.2578
0.2912
0.3264
0.3632
0.4013
0.4404
0.4801
0.06
0.0011
0.0015
0.0021
0.0029
0.0039
0.0052
0.0069
0.0091
0.0119
0.0154
0.0197
0.0250
0.0314
0.0392
0.0485
0.0594
0.0721
0.0869
0.1038
0.1230
0.1446
0.1685
0.1949
0.2236
0.2546
0.2877
0.3228
0.3594
0.3974
0.4364
0.4761
0.07
0.0011
0.0015
0.0021
0.0028
0.0038
0.0051
0.0068
0.0089
0.0116
0.0150
0.0192
0.0244
0.0307
0.0384
0.0475
0.0582
0.0708
0.0853
0.1020
0.1210
0.1423
0.1660
0.1922
0.2206
0.2514
0.2843
0.3192
0.3557
0.3936
0.4325
0.4721
Source: Cumulative standard normal probabilities generated by Minitab, then rounded to four decimal places.
0.08
0.0010
0.0014
0.0020
0.0027
0.0037
0.0049
0.0066
0.0087
0.0113
0.0146
0.0188
0.0239
0.0301
0.0375
0.0465
0.0571
0.0694
0.0838
0.1003
0.1190
0.1401
0.1635
0.1894
0.2177
0.2483
0.2810
0.3156
0.3520
0.3897
0.4286
0.4681
0.09
0.0010
0.0014
0.0019
0.0026
0.0036
0.0048
0.0064
0.0084
0.0110
0.0143
0.0183
0.0233
0.0294
0.0367
0.0455
0.0559
0.0681
0.0823
0.0985
0.1170
0.1379
0.1611
0.1867
0.2148
0.2451
0.2776
0.3121
0.3483
0.3859
0.4247
0.4641
5217X_IBC.indd 1
04/02/10 8:53 PM