


 |
IAS501S - INTRODUCTION TO APPLIED STATISTICS - 2ND OPP - JANUARY 2024 |
|
|
1 Page 1 |
▲back to top |
nAm I BIA un IVERSITY
OF SCIEnCEAnOTECHnOLOGY
FacultoyfHealthN, atural
ResourceasndApplied
Sciences
Schoool f NaturalandApplied
Sciences
Departmentof Mathematics,
StatisticsandActuarialScience
13JacksonKaujeuaStreet
PrivateBag13388
Windhoek
NAMIBIA
T: +264612072913
E: msas@nust.na
W: www.nust.na
QUALIFICATION : BACHELORof SCIENCEIN APPLIEDMATHEMATICS AND STATISTICS&
BACHELORof SCIENCE
QUALIFICATIONCODE: 07BSAM & 07BSOC
COURSE: INTRODUCTION TO APPLIEDSTATISTICS
DATE: JANUARY2024
DURATION: 3 HOURS
LEVEL:5
COURSECODE: IASS0lS
SESSION: 1
MARKS: 100
SECOND OPPORTUNITY/ SUPPLEMENTARY: EXAMINATION QUESTION PAPER
EXAMINER:
MODERATOR:
MR. ANDREW ROUX
DR. DISMASNTIRAMPEBA
INSTRUCTIONS
1. Answer all questions on the separate answer sheet.
2. Please write neatly and legibly.
3. Do not use the left side margin of the exam paper. This must be allowed for the
examiner.
4. No books, notes and other additional aids are allowed.
5. Mark all answers clearly with their respective question numbers.
PERMISSIBLE MATERIALS :
1. Non-Programmable Calculator
ATTACHEMENTS
1. Statistical Formulae Sheet
2. Standard Normal Probability Distribution Table
3. 1 x A4 Graph Sheet
This paper consistsof 4 pages including this front page
|
|
2 Page 2 |
▲back to top |
.- .
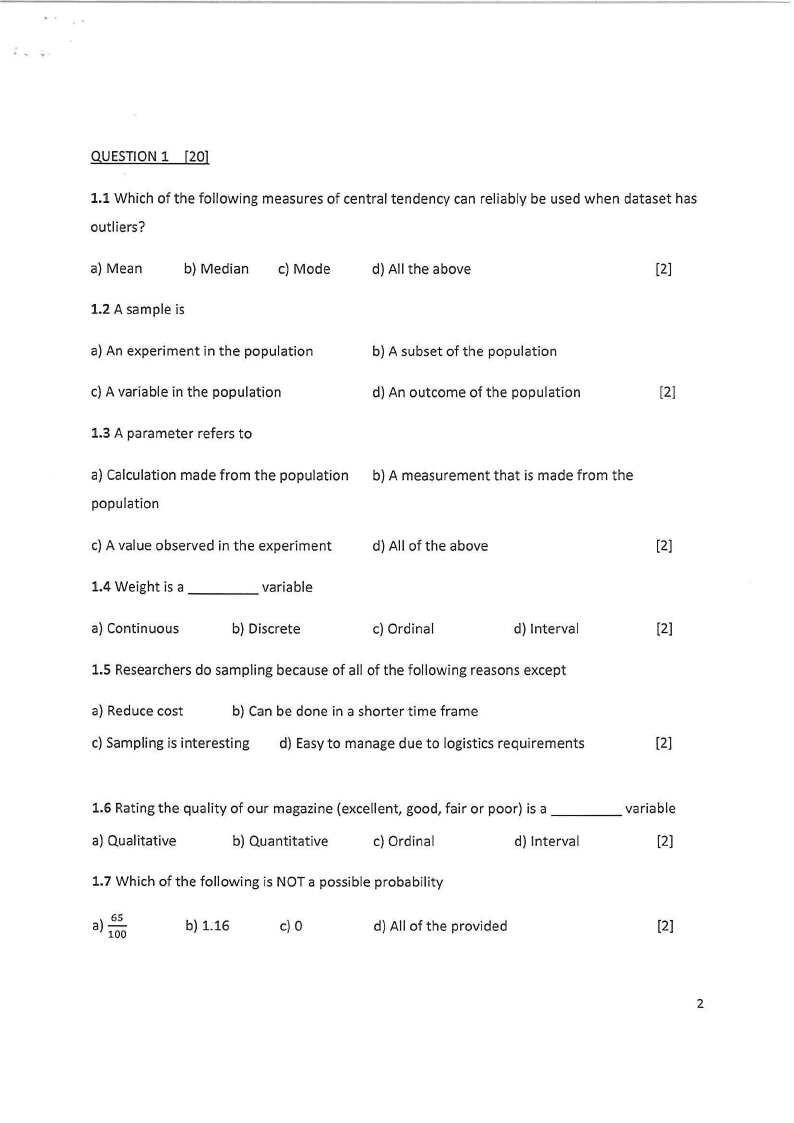
QUESTION1 [20)
1.1 Which of the following measures of central tendency can reliably be used when dataset has
outliers?
a) Mean
b) Median c) Mode
d) All the above
[2]
1.2 A sample is
a) An experiment in the population
b) A subset of the population
c) A variable in the population
d) An outcome of the population
[2]
1.3 A parameter refers to
a) Calculation made from the population
population
b) A measurement that is made from the
c) A value observed in the experiment
d) All of the above
[2]
1.4 Weight is a ____
variable
a) Continuous
b) Discrete
c) Ordinal
d) Interval
[2]
1.5 Researchers do sampling because of all of the following reasons except
a) Reduce cost
b) Can be done in a shorter time frame
c) Sampling is interesting
d) Easyto manage due to logistics requirements
[2]
1.6 Rating the quality of our magazine (excellent, good, fair or poor) is a ____
a) Qualitative
b) Quantitative
c) Ordinal
d) Interval
1.7 Which of the following is NOT a possible probability
a)- 65
100
b) 1.16
c) 0
d) All of the provided
variable
[2]
[2]
2
|
|
3 Page 3 |
▲back to top |
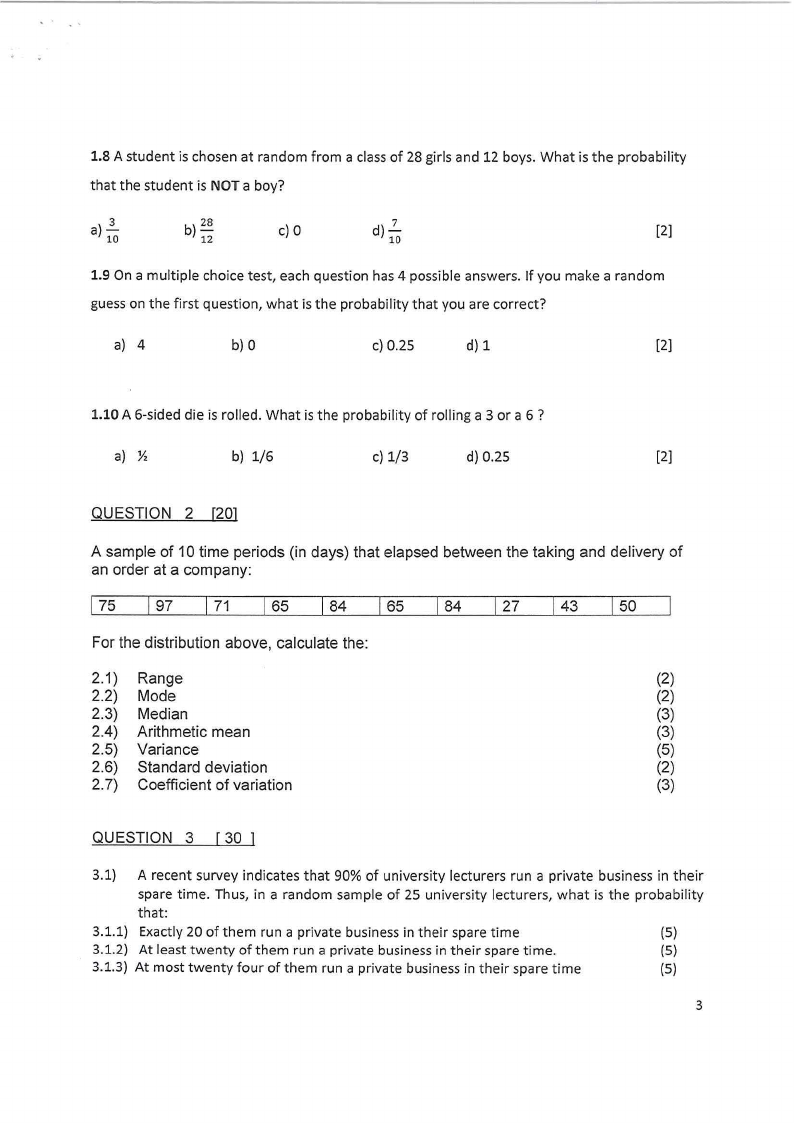
1.8 A student is chosen at random from a class of 28 girls and 12 boys. What is the probability
that the student is NOT a boy?
a)- 3
b) 2s
c) 0
d) 2.
[2]
10
12
10
1.9 On a multiple choice test, each question has 4 possible answers. If you make a random
guess on the first question, what is the probability that you are correct?
a) 4
b) O
c) 0.25
d) 1
[2]
1.10 A 6-sided die is rolled. What is the probability of rolling a 3 or a 6?
a) ½
b) 1/6
c) 1/3
d) 0.25
[2]
QUESTION 2 [20]
A sample of 10 time periods (in days) that elapsed between the taking and delivery of
an order at a company:
I 75 I 97 I 71 I 65 184 I 65 184 I 27 I 43 150
For the distribution above, calculate the:
2.1) Range
(2)
2.2) Mode
(2)
2.3) Median
(3)
2.4) Arithmetic mean
(3)
2.5) Variance
(5)
2.6) Standard deviation
(2)
2.7) Coefficient of variation
(3)
QUESTION 3 [ 30 ]
3.1) A recent survey indicates that 90% of university lecturers run a private business in their
spare time. Thus, in a random sample of 25 university lecturers, what is the probability
that:
3.1.1) Exactly 20 of them run a private business in their spare time
(5)
3.1.2) At least twenty of them run a private business in their spare time.
(S)
3.1.3) At most twenty four of them run a private business in their spare time
(5)
3
|
|
4 Page 4 |
▲back to top |

3.2 Shoprite/ Checkers estimates that its maximum daily demand for electricity
during the coming few weeks can be approximated by a normal distribution with
a mean of 100kW and a standard deviation of 10 kW.
3.2.1) Determine the probability that the maximum daily demand will be between 100
kW and 125 kW (inclusive)
(5)
3.2.2) Determine the probability that the maximum daily demand will be between 94 kW
and 108 kW (inclusive)
(5)
3.2.3) Determine the probability that a given day's maximum demand will be exceed 87
kW (inclusive)
(5)
QUESTION 4 [91
A shop owner has compiled the following information on the prices and quantities of
fruit sales from December 2012 to December 2022
ITEM
PRICE
2012
PRICE
2022
QUANTITY
2012
QUANTITY
2022
Apple
Orange
Avocado
1.85
1.50
3.40
3.75
2.25
5.40
75
110
140
260
250
335
Using December 2012 as the base period, determine and interpret the simple price
indexes for these three items in December 2022.
[3 X 3 = 9]
QUESTION 5
r21l
The asset turnovers, excluding cash and short-term investments, for the Konkiep Cash
Loans from 2012 to 2022 are listed below (in $mil):
2012 2013 2014 2015 2016 2017 2018 2019 2020 2021 2022
3.33 3.84 3.51 3.30 3.18 3.42 3.37 3.99 4.14 4.50 4.95
5.1 Plot the time series data.
(6)
5.2 Determine the least squares trend line equation, using the sequential coding
method with x = 1 in 2012.
(9)
5.3 Use the trend line equation to estimate turnovers for 2010 and 2026
(6)
xxxxxxxxxxxxxxxxxxxxxxxxxxxxxxxxxxxxxxxxxxxx
4
|
|
5 Page 5 |
▲back to top |
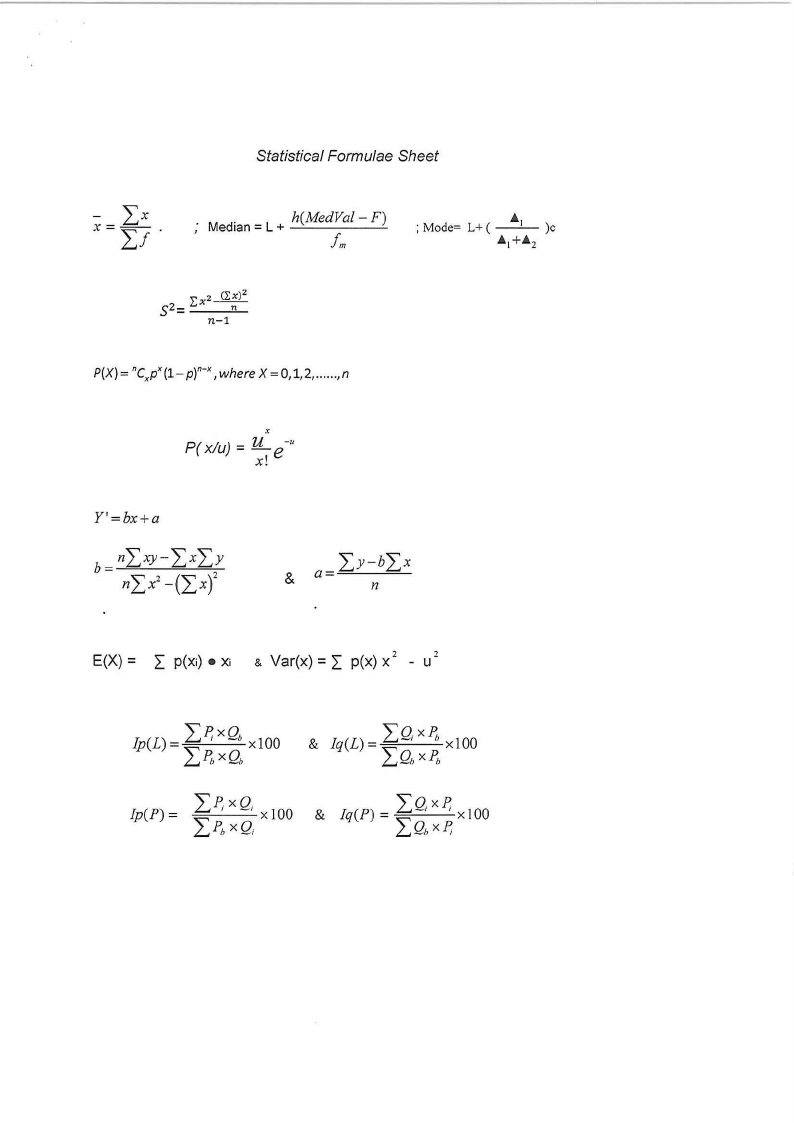
Statistical Formulae Sheet
Med.,an= L + -h--(-M- edVal-F)
fm
-'
P( xlu) = lL e-u
x!
Y'=bx+a
E(X) = L p(Xi) • Xi & Var(x) = I p(x) x 2 - u2
L Ip(L) = :Z:1)~~xb oxlOO
P,X, Qb
|
|
6 Page 6 |
▲back to top |

Z-Table
The table shows cumulativeprobabilitiesfor the standardnormal curve.
Cumulative probabilities for NEGATIVE z-values are shown first. SCROLL
DOWN to the 2nd page for POSITIVE z
z
.J.4
.J.3
.J.2
I .J.1
-3.0
-2.9
-2.8
-2.7
-2.6
-2.5
-2.4
-2.3
-2.2
-2.1
-2.0
-1.9
-1.8
-1.7
-1.6
-1.5
-1.4
-1.3
-1.2
-1.1
-1.0
-0.9
-0.8
-0.7
I -0.6
-0.5
-0.4
-0.3
-0.2
-0.1
0.0
.00
.0003
.0005
.0007
.0010
.0013
.0019
.0026
.0035
.0047
.0062
:0082
.0107
.0139
.0179
.0228
.0287
.0359
.0446
.0548
.0668
.0808
.0968
.1151
.1357
.1587
.1841
.2119
.2420
.2743
.3085
.3446
.3821
.4207
.4602
.5000
.01
.0003
.0005
.0007
.0009
.0013
.0018
.0025
.0034
.0045
.0060
.0080
.0104
.0136
.0174
.0222
.0281
.0351
.0436
.0537
.0655
.0793
.0951
.1131
.1335
.1562
.1814
.2090
.2389
.2709
.3050
.3409
.3783
.4168
.4562
.4960
.02
.0003
.0005
.0006
.0009
.0013
.0018
.0024
.0033
.0044
.0059
.0078
.0102
.0132
.0170
.0217
.0274
.0344
.0427
.0526
.0643
.0778
.0934
.1112
.1314
.1539
.1788
.2061
.2358
.2676
.3015
.3372
.3745
.4129
.4522
.4920
.03
.0003
.0004
.0006
.0009
.0012
.0017
.0023
.0032
.0043
.0057
.0075
.0099
.0129
.0166
.0212
.0268
.0336
.0418
.0516
.0630
.0764
.0918
.1093
.1292
.1515
.1762
.2033
.2327
.2643
.2981
.3336
.3707
.4090
.4483
.4880
.04
.0003
.0004
.0006
.0008
.0012
.0016
.0023
.0031
.0041
.0055
.0073
.0096
.0125
.0162
.0207
.0262
.0329
.0409
.0505
.0618
.0749
.0901
.1075
.1271
.1492
.1735
.2005
.2296
.2611
.2946
.3300
.3669
.4052
.4443
.4840
.05
.0003
.0004
.0006
.0008
.0011
.0016
.0022
.0030
.0040
.0054
.0071
.0094
.0122
.0158
.0202
.0256
.0322
.0401
.0495
.0606
.0735
.0885
.1056
.1251
.1469
.1711
.1977
.2266
.2578
.2912
.3264
.3632
.4013
.4404
.4801
.06
.0003
.0004
.0006
.0008
.0011
.0015
.0021
.0029
.0039
.0052
.0069
.0091
.0119
.0154
.0197
.0250
.0314
.0392
.0485
.0594
.0721
.0869
.1038
.1230
.1446
.1685
.1949
.2236
.2546
.2877
.3228
.3594
.3974
.4364
.4761
.07
.0003
.0004
.0005
.0008
.0011
.0015
.0021
.0028
.0038
.0051
.0068
.0089
.0116
.0150
.0192
.0244
.0307
.0384
.0475
.0582
.0708
.0853
.1020
.1210
.1'123
.1660
.1922
.2206
.2514
.2843
.3192
.3557
.3936
.4325
.4721
.08
.0003
.0004
.0005
.0007
.0010
.0014
.0020
.0027
.0037
.0049
.0066
.0087
.0113
.0"146
.0188
.0239
.030"1
.0375
.0465
.0571
.0694
.0838
.1003
.1190
.1401
.1635
.1894
.2177
.2483
.2810
.3156
.3520
.3897
.4286
.4681
.09
.0002
.0003
.0005
.0007
.oorn
.0014
.00·19
.0026
.0036
.0048
.0064
.0084
.0110
.0143
.0183
.0233
.0294
.0367
.0455
.0559
.068"1
.0823
.0985
.1170
.1379
.1611
.1867
.2148
.2451
.2776
.3121
.3483
.3859
.4247
.4641
|
|
7 Page 7 |
▲back to top |
'.
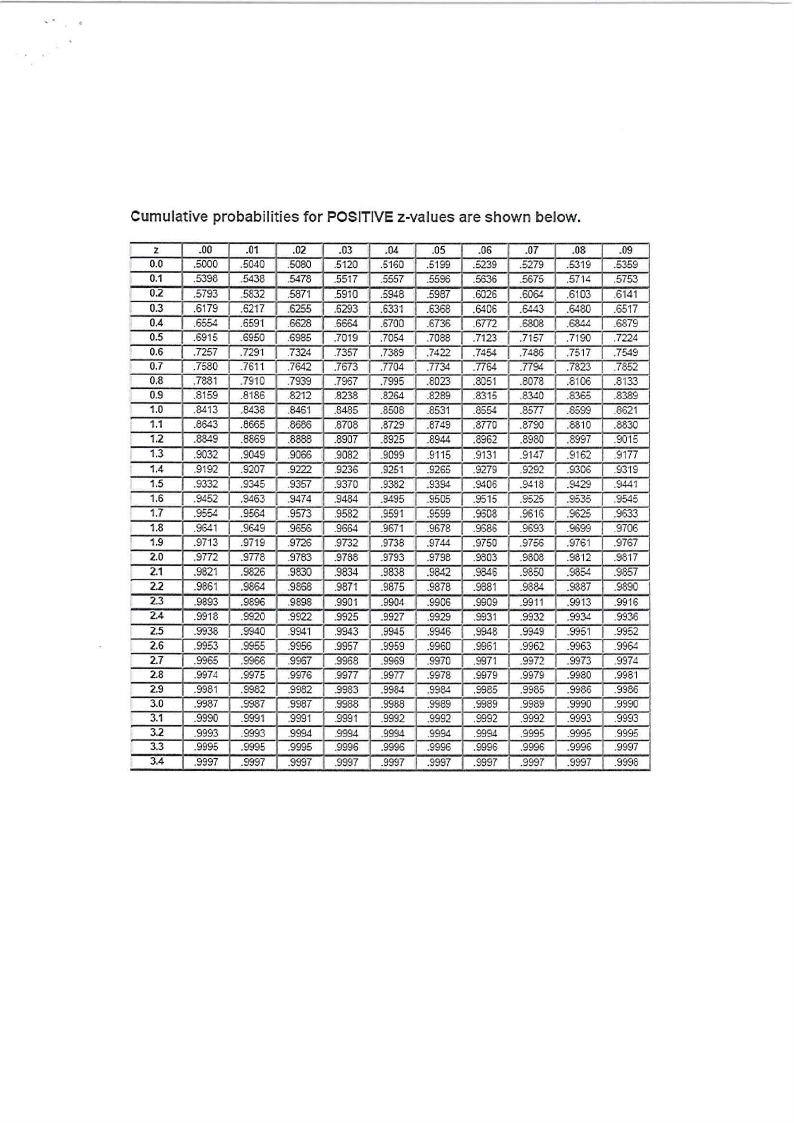
Cumulative probabilities for POSITIVE z-values are shown below .
z
0.0
0.1
0.2
0.3
0.4
0.5
0.6
0.7
0.8
0.9
1.0
1.1
1.2
1.3
I 1.4
1.5
I 1.6
I 1.7
1.8
I 1.9
I 2.0
2.1
2.2
2.3
2.4
2.5
2.6
2.7
2.8
2.9
3.0
3.1
3.2
3.3
3.4
. 00
.5000
.5398
.5793
.6179
.6554
.6915
.7257
.7580
.7881
.8159
.8413
.8643
.8849
.9032
.9192
.9332
.9452
.9554
.9641
.9713
.9772
.9821
.9861
.9893
.9918
.9938
.9953
.9965
.9974
.9981
.9987
.9990
.9993
.9995
.9997
.01
.5040
.5438
.5832
.52"17
.659"1
.6950
.7291
.7611
_79·10
.8"186
.8438
.8665
.8869
.9049
.9207
.9345
.9463
.9564
.9649
.9719
.9778
.9826
.9864
.9896
.9920
.9940
.9955
.9966
.9975
.9982
.9987
.9991
.9993
.9995
.9997
.02
.5080
.5478
.5871
.6255
.6628
.6985
.7324
.7642
.7939
.8212
.8461
.8686
.8888
.9066 I
.9222
.9357
.9474
.9573
.9656
.9726
.9783
.9830
.9868
.9898
.9922
.9941
.9956
.9967
.9976
.9982
.9987
.9991
.9994
.9995
.9997
.03
.5120
.5517
.5910
.6293
.6664
.7019
.7357
.7673
.7967
.8238
.8485
.8708
.8907
.9082
.9236
.9370
.9484
.9582
.9664
.9732
.9788
.9834
.9871
.9901
.9925
.9943
.9957
.9968
.9977
.9983
.9988
.9991
.9994
.9995
.9997
.04
.5160
.5557
.5948
.6331
.6700
.7054
.7389
.7704
.7995
.8264
.8508
.8729
.8925
.9099
.9251
.9382
.9495
.9591
.967"1
.9738
.9793
.9838
.9875
.9904
.9927
.9945
.9959
.9969
.9977
.9984
.9988
.9992
.9994
.9995
.9997
.05
.5199
.5596
.5987
.6368
.6736
.7088
.7422
.7734
.8023
.8289
.8531
.8749
.8944
.9115
.9265
.9394
.9505
.9599
.9678
.9744
.9798
.9842
.9878
.9906
.9929
.9946
.9960
.9970
.9978
.9984
.9989
.9992
.9994
.9996
.9997
.06
.5239
.5636
.6026
.6406
.6772
.7123
.7454
.7764
.8051
.8315
.8554
.8770
.8962
.9131
.9279
.9406
.9515
.9608
.9686
.9750
.9803
.9846
.9881
.9909
.9931
.9948
.9961
.9971
.9979
.9985
.9989
.9992
.9994
.9996
.9997
.07
.5279
.5675
.6064
.6443
.6808
.7157
.7486
.7794
.8078
.8340
.8577
.8790
.8980
.9147
.9292
.9418
.9525
.9616
.9693
.9756
.9808
.9850
.9384
.9911
.9932
.9949
.9962
.9972
.9979
.9985
.9989
.9992
.9995
.9996
.9997
.08
.5319
.5714
.6103
.6480
.6844
.7190
.7517
.7823
.8106
.8365
.8599
.8810
.8997
.9162
.9306
.9429
.9535
.9625
.9699
.9761
.9812
.9854
.9387
.9913
.9934
.9951
.9963
.9973
.9980
.9986
.9990
.9993
.9995
.9996
.9997
.09
.5359
.5753
.6141
.6517
.6879
.7224
.7549
.7852
.8"133
.8389
.8621
.8830
.9015
.9177
.9319
.9441
.9545
.9633
.9706
.9767
.9817
.9857
.9890
.9916
.9936
.9952
.9964
.9974
.9981
.9986
.9990
.9993
.9995
.9997
.9998