


 |
AEM520S - AGRICULTURAL ECONOMICS - 2ND OPP - NOV 2024 |
|
|
1 Page 1 |
▲back to top |
" nAmlBIA UnlVERSITY
OF SCIEnCE Ano TECHnoLOGY
FACULTYOF HEALTH,NATURALRESOURCESAND APPLIEDSCIENCES
SCHOOLOF AGRICULTUREAND NATURALRESOURCESSCIENCES
DEPARTMENTOF AGRICULTURALSCIENCESAND AGRIBUSINESS
QUALIFICATION:BACHELOROF SCIENCEIN AGRICULTURE/ HORTICULTUREand REGIONAL
AND RURALDEVELOPMENT
QUALIFICATION CODE:
07BAGA/07BHOR/07BRAR
LEVEL: 7
COURSECODE:AEM520S
COURSENAME: AGRICUTURAL ECONOMICS
DATE: JANUARY 2025
DURATION: 3 HOURS
PAPER:2
MARKS: 100
SECONDOPPORTUNITY/ SUPPLEMENTARYEXAMINATION QUESTION PAPER
EXAMINER(S) MR ANDREAS ERASTUS
MS ESTHERKWAAMBWA
MODERATOR: MR MWALA LUBINDA
INSTRUCTIONS
1. Answer ALL the questions.
2. Write clearly and neatly.
3. Number your answers clearly.
PERMISSIBLEMATERIALS
1. Examination Question paper
2. Examination Answer booklet
3. Calculator
THIS QUESTION PAPERCONSISTSOF 6 PAGES(Including this front page)
|
|
2 Page 2 |
▲back to top |
1QUESTION1
1.1 what is the difference between microeconomics and macroeconomics?
[44 MARKS].
[2]
1.2 Define Agricultural economics and why is important to study Agricultural economics?
[4]
1.3 Discuss the significance of the agricultural sector in the Namibian economy, providing at
least four key points.
[8]
1.4 Define the law of supply, and explain why it holds.
[3]
1.5 what are complementary goods?
[1]
1.6 what are substitute goods?
[1]
1.7 "Supply involves more than just having the resources and technology to produce goods
or services." Discuss three key prerequisites a firm should consider before supplying
goods or services.
[6]
1.8 Explain the difference between change in supply and change in quantity supplied. [4]
In demand theory, explain the relationship between price and quantity of goods being
demanded.
[2]
1.9 Given the answer you gave in Q1 .8, explain why the relationship is the way you
discussed it.
[2]
1.10 Consider the following functions representing the demand and supply of carrots in a
market. Where Pis the price in N$/kg, and Q. and Qd are quantity demanded and
supplied in kilograms (kg). Use this information to answer the questions below.
Qd= 100-SP
[Demand function]
Q. = 1 +4P
[Supply function]
(a) Find the equilibrium price of carrots.
[3]
(b) Find the quantity demanded or quantity supplied of carrots at the equilibrium
price
~]
(c) Estimate the surplus or shortage of carrots demanded and supplied
[3]
(d) Explain how markets regulate the price and quantity supplied or demanded back
to equilibrium.
[3]
Total
[44]
2
|
|
3 Page 3 |
▲back to top |
[12 MARKS]
2.1 When the price of potatoes increased from N$20 to N$22, the quantity of potatoes
demanded decreased from 100 to 87.
What is the price elasticity of demand for potatoes?
Calculating a Percentage
[6]
2.2 The quantity demanded of Good Z depends upon the price of Z (Pz), monthly income (Y), and
the price of a related Good W (Pw).
Demand for Good Z (Qz) is given by equation 1 below:
Qz = 150 - 8Pz + 2Y - 15Pw.
Find the demand equation for Good Zin terms of the price for Z (Pz), when Y is N$50 and Pw =
N$6.
~]
Total
[12]
3
|
|
4 Page 4 |
▲back to top |
•QUESTION3
[20 MARKS]
3.1 Find the slope of a linear demand cu Ne for orange boxes, when persons purchase 1,000
at N$ 5.00 per box and 200 at N$ 15.00 per box
[4]
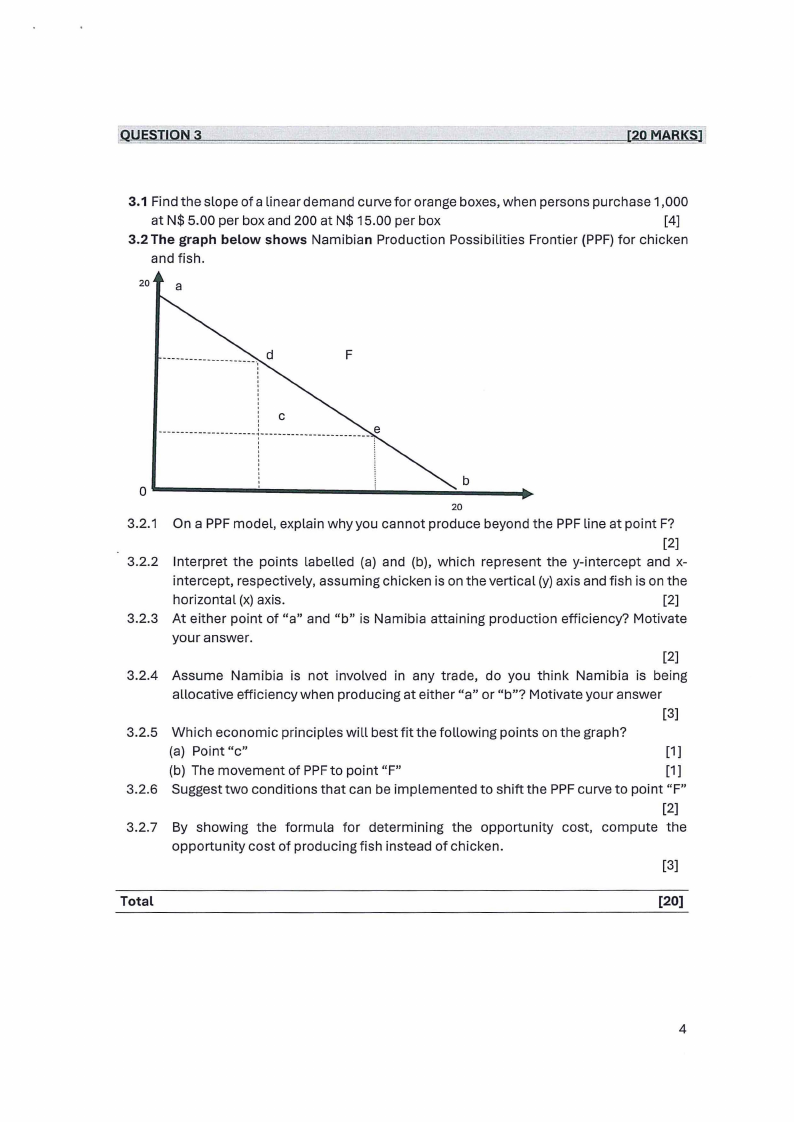
3.2 The graph below shows Namibian Production Possibilities Frontier (PPF) for chicken
and fish.
20 a
F
:C
--- --- ----- --- -------- -- --- --- ------ -- --------- e
''
''
'
0 ------·-----~---.;;;..
b
__ ,..
20
3.2.1 On a PPF model, explain why you cannot produce beyond the PPF line at point F?
[2]
3.2.2 Interpret the points labelled (a) and (b), which represent the y-intercept and x-
intercept, respectively, assuming chicken is on the vertical (y) axis and fish is on the
horizontal (x) axis.
[2]
3.2.3 At either point of "a" and "b" is Namibia attaining production efficiency? Motivate
your answer.
[2]
3.2.4 Assume Namibia is not involved in any trade, do you think Namibia is being
allocative efficiency when producing at either "a" or "b"? Motivate your answer
[3]
3.2.5 Which economic principles will best fit the following points on the graph?
(a) Point "c"
[1]
(b) The movement of PPFto point "F"
[1]
3.2.6 Suggest two conditions that can be implemented to shift the PPF curve to point "F"
[2]
3.2.7 By showing the formula for determining the opportunity cost, compute the
opportunity cost of producing fish instead of chicken.
[3]
Total
[20]
4
|
|
5 Page 5 |
▲back to top |
[14 MARKS]
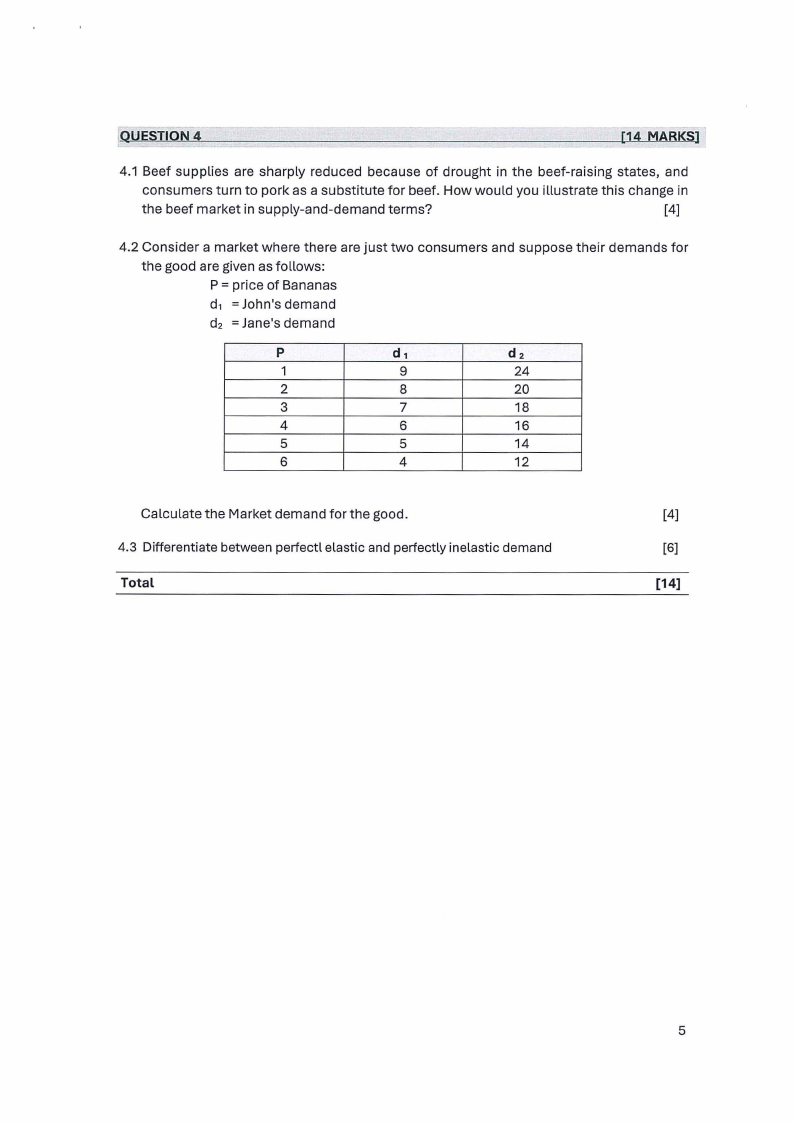
4.1 Beef supplies are sharply reduced because of drought in the beef-raising states, and
consumers turn to pork as a substitute for beef. How would you illustrate this change in
the beef market in supply-and-demand terms?
[4]
4.2 Consider a market where there are just two consumers and suppose their demands for
the good are given as follows:
P = price of Bananas
d1 = John's demand
d2 = Jane's demand
p
d1
d2
1
9
24
2
8
20
3
7
18
4
6
16
5
5
14
6
4
12
Calculate the Market demand for the good.
[4]
4.3 Differentiate between perfectl elastic and perfectly inelastic demand
[6]
Total
[14]
5
|
|
6 Page 6 |
▲back to top |
QUESTIONS
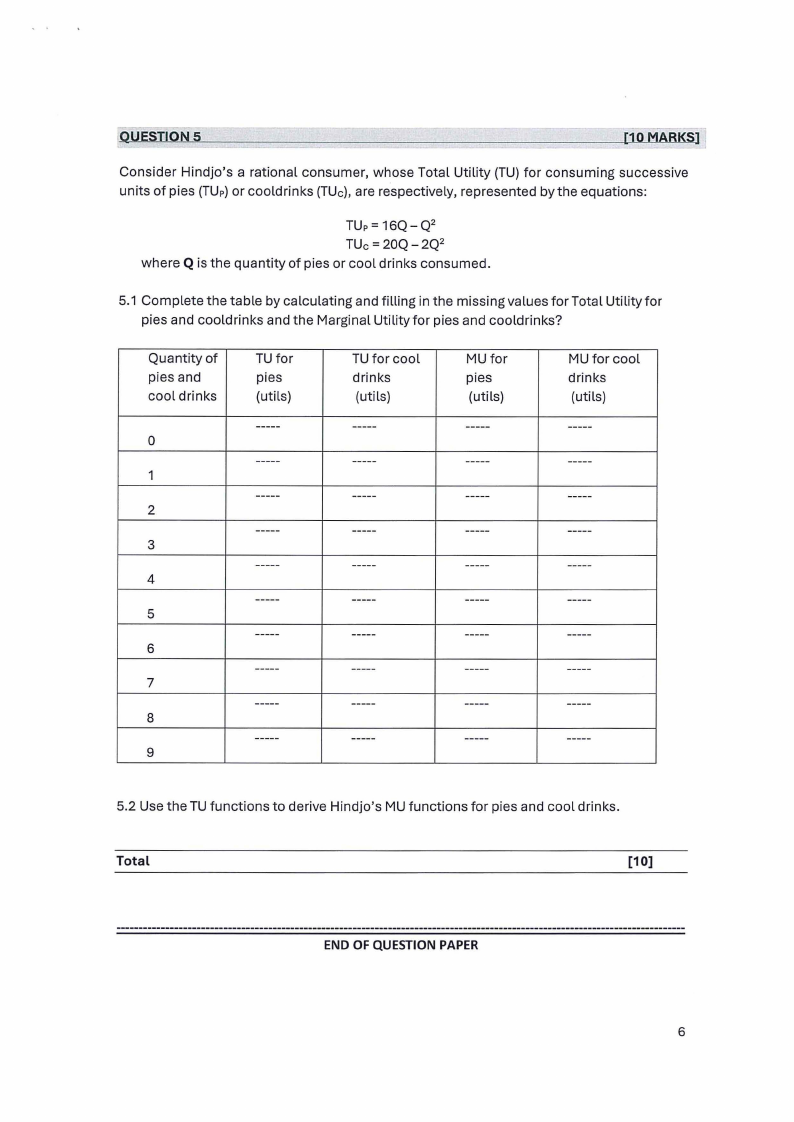
Consider Hindjo's a rational consumer, whose Total Utility (TU) for consuming successive
units of pies (TUP)or cooldrinks (TUc), are respectively, represented by the equations:
TUp= 16Q-Q 2
TUc = 20Q - 2Q2
where Q is the quantity of pies or cool drinks consumed.
5.1 Complete the table by calculating and filling in the missing values for Total Utility for
pies and cooldrinks and the Marginal Utility for pies and cooldrinks?
Quantity of
pies and
cool drinks
0
1
2
3
4
5
6
7
8
9
TU for
pies
(utils)
-----
-----
-----
-----
-----
-----
-----
-----
-----
-----
TU for cool
drinks
(utils)
-----
-----
-----
-----
-----
-----
-----
-----
-----
-----
MU for
pies
(utils)
-----
-----
-----
-----
-----
-----
-----
-----
-----
-----
MU for cool
drinks
(utils)
-----
-----
-----
-----
-----
-----
-----
-----
-----
-----
5.2 Use the TU functions to derive Hindjo's MU functions for pies and cool drinks.
Total
[10]
END OF QUESTION PAPER
6