


 |
DPS610S - DEMOGRAPHY and POPUL STUDIES - 1 ST OPP - JUNE 2022 |
|
|
1 Page 1 |
▲back to top |
nAmlBIA UnlVERSITY
OF SCIEnCE AnD TECHnOLOGY
FACULTYOF ENGINEERINGAND SPATIALSCIENCES
DEPARTMENTOF ARCHITECTUREAND SPATIALSCIENCES
QUALIFICATION: BACHELOROF TOWN AND REGIONALPLANNING
QUALIFICATIONCODE: 07BTAR
COURSECODE: DPS610S
LEVEL: 6
CREDITS:10
COURSENAME: DEMOGRAPHYAND POPULATION
STUDIES
DATE:JUNE 2022
PAPER:THEORY
DURATION: 3 HOURS
MARKS: 100
FIRSTOPPORTUNITYEXAMINATION QUESTION PAPER
Laudika Kandjinga, 061 207 2672, lkandjinga@nust.na
EXAMINER{S) Pieter Genis, 061 207 2640, pgenis@nust.na
Jacques Korrubel, 061 207 2683, jkorrubel@nust.na
MODERATOR: Jane Gold, 061 207 2894, jgold@nust.na
INSTRUCTIONS
1. Answer ALL the questions in any sequence
2. Write clearly and neatly.
3. Number the answers clearly.
4. Use sketches to improve your answers.
PERMISSIBLEMATERIALS
1. Calculator, ruler, pen, pencil, and eraser
THIS QUESTION PAPERCONSISTSOF 6 PAGES(Including this front page)
|
|
2 Page 2 |
▲back to top |
Demographyand PopulationStudies
Question 1
DPS610S
(a) Outline two ways of studying fertility.
(2)
(b) Explain two downsides (disadvantages) of using Crude Birth Rate CBR)for measuring fertility of
a specific place.
(5)
(c) Briefly describe why the General Fertility Rate {GFR)is superior to the CBR.
{2)
[9]
Question 2
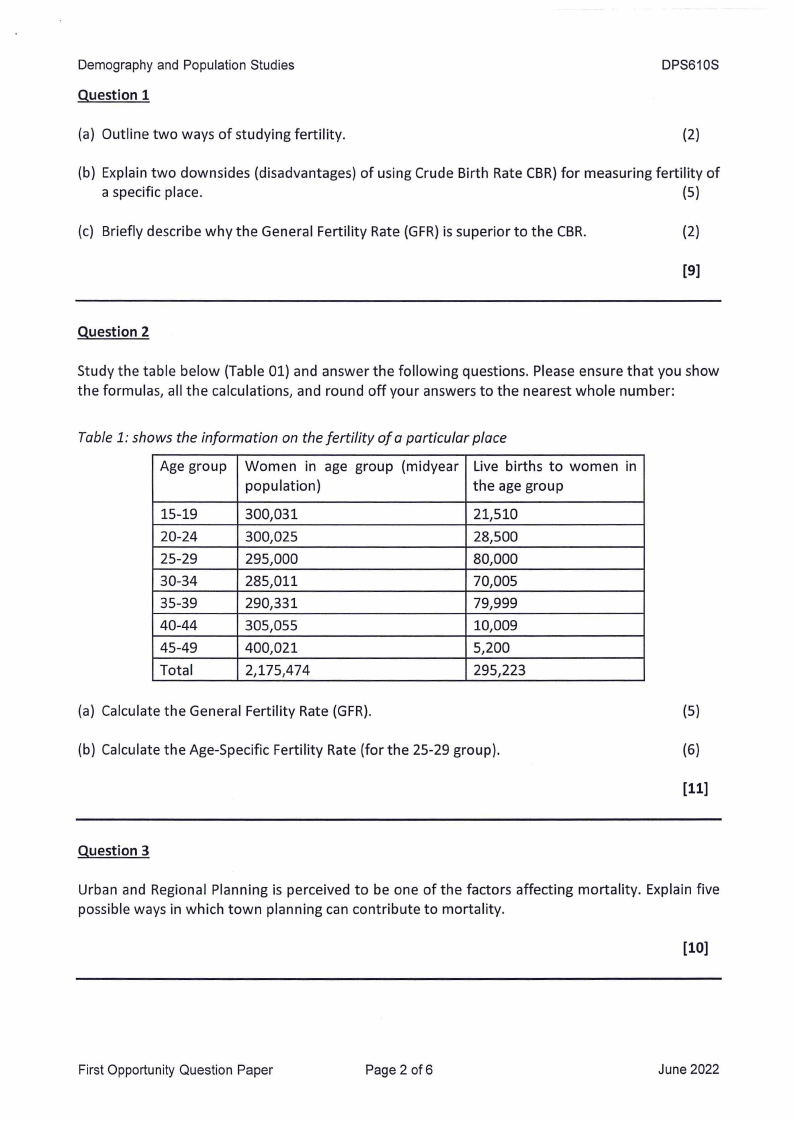
Study the table below {Table 01) and answer the following questions. Please ensure that you show
the formulas, all the calculations, and round off your answers to the nearest whole number:
Table 1: shows the information on the fertility of a particular place
Age group Women in age group (midyear Live births to women in
population)
the age group
15-19
20-24
25-29
30-34
35-39
40-44
45-49
Total
300,031
300,025
295,000
285,011
290,331
305,055
400,021
2,175,474
21,510
28,500
80,000
70,005
79,999
10,009
5,200
295,223
(a) Calculate the General Fertility Rate {GFR).
(b) Calculate the Age-Specific Fertility Rate (for the 25-29 group).
(5)
{6)
[11)
Question 3
Urban and Regional Planning is perceived to be one of the factors affecting mortality. Explain five
possible ways in which town planning can contribute to mortality.
[10)
First OpportunityQuestion Paper
Page 2 of 6
June 2022
|
|
3 Page 3 |
▲back to top |
Demographyand PopulationStudies
Question 4
DPS610S
Internal or international migration can impact destination areas (counties, regions, or towns). With
this understanding, discuss in detail at least three advantages of migration in the destination areas.
[10]
Question 5
a. Which of the following characteristics are not part of census contents?
(1)
i. social
ii. psychological
iii. financial
iv. economic
b. Vital/Civil Registration Systems are administrative systems used by governments to
record vital events or vital statistics of citizens/residents. Choose the statistical indicator
below not classified as vital.
(1)
i. migration
ii. birth
iii. marriage
iv. none of the above
c.
Population projection aims to describe what is likely to happen in future under certain
clear assumptions related to the immediate past. Objective population projections are
best described by:
(1)
i. collecting data & applying a quantitative method
ii. rely, to some extent, on subjective elements
iii. all of the above
iv. none of the above
d.
We often use definitions of projections, forecasts, and estimates, interchangeably,
without knowing the implications. Indicate the most suitable statement applicable to
estimates.
(1)
i. refers exclusively to past or present statistics
ii. choose one set of parameters that will lead to the most likely result based on a believe
iii. need to specify first all parameters to be used in calculations
iv. all of the above
e. The CSIR guidelines for provision of social facilities in urban areas use the following
provision criteria:
(1)
i. basic essential services
ii. non-essential provision based on needs, distance, or other factors
iii. valuable services that are un-funded
iv. all of the above
[S]
FirstOpportunityQuestion Paper
Page 3 of 6
June 2022
|
|
4 Page 4 |
▲back to top |
Demography and Population Studies
DPS610S
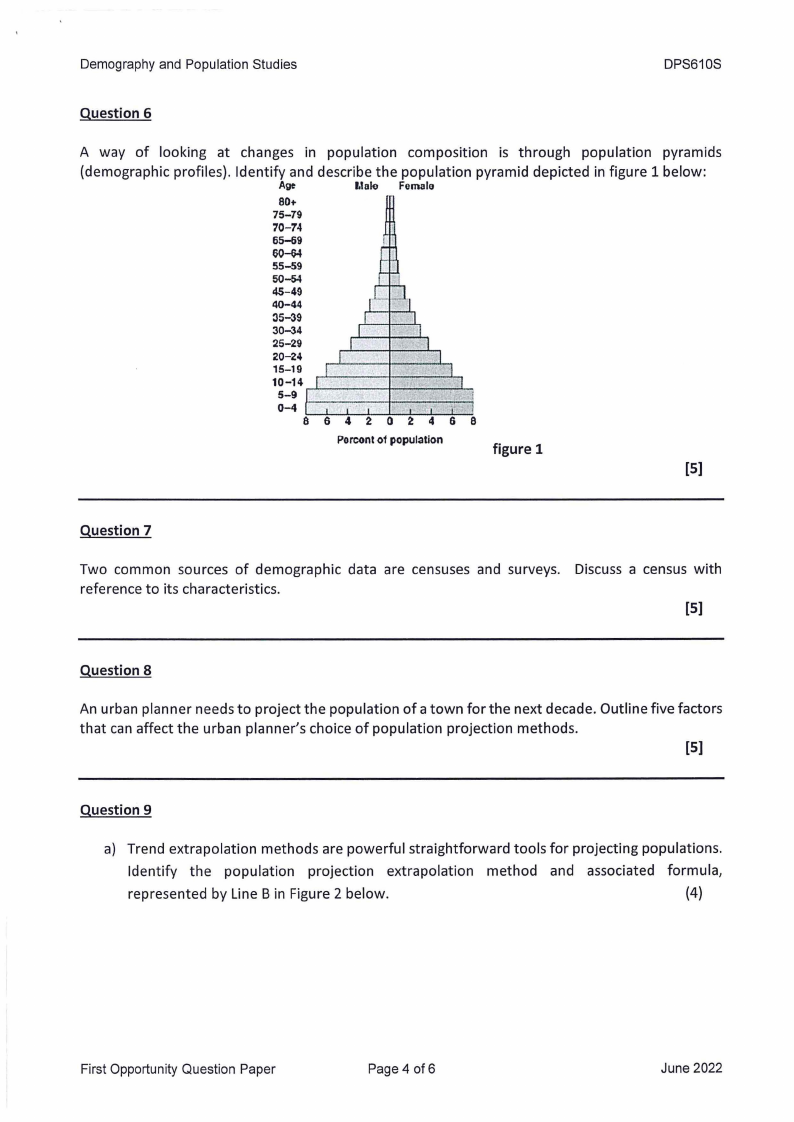
Question 6
A way of looking at changes in population composition is through population pyramids
(demographic profiles). Identify and describe the population pyramid depicted in figure 1 below:
Age
Llalo FomalCJ
801-
75-79
70-74
65-69
60~
55-59
50-54
45-49
40-44
35-39
30-34
25-29
20-24
15-19
150--194 ,_._________
....,_
0-4 a---------~---
Porcontof population
figure 1
[S]
Question 7
Two common sources of demographic data are censuses and surveys. Discuss a census with
reference to its characteristics.
[S]
Question 8
An urban planner needs to project the population of a town for the next decade. Outline five factors
that can affect the urban planner's choice of population projection methods.
[S]
Question 9
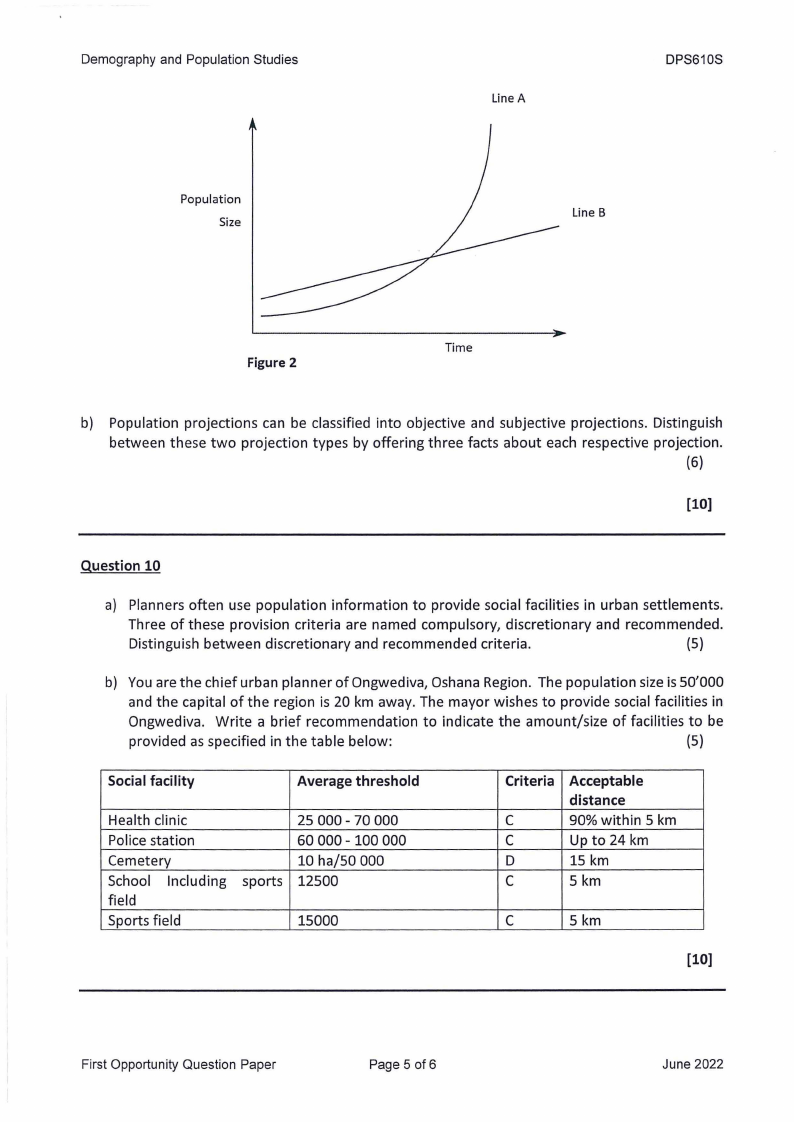
a) Trend extrapolation methods are powerful straightforward tools for projecting populations.
Identify the population projection extrapolation method and associated formula,
represented by Line Bin Figure 2 below.
(4)
First Opportunity Question Paper
Page 4 of 6
June 2022
|
|
5 Page 5 |
▲back to top |
Demography and Population Studies
Population
Size
Line A
DPS610S
Line B
Figure 2
Time
b) Population projections can be classified into objective and subjective projections. Distinguish
between these two projection types by offering three facts about each respective projection.
(6)
[10]
Question 10
a) Planners often use population information to provide social facilities in urban settlements.
Three of these provision criteria are named compulsory, discretionary and recommended.
Distinguish between discretionary and recommended criteria.
(5)
b) You are the chief urban planner of Ongwediva, Oshana Region. The population size is 50'000
and the capital of the region is 20 km away. The mayor wishes to provide social facilities in
Ongwediva. Write a brief recommendation to indicate the amount/size of facilities to be
provided as specified in the table below:
(5)
Social facility
Average threshold
Health clinic
Police station
Cemetery
School Including
field
Sports field
sports
25 000 - 70 000
60 000 - 100 000
10 ha/50 000
12500
15000
Criteria
C
C
D
C
Acceptable
distance
90% within 5 km
Up to 24 km
15 km
5km
C
5km
[10]
First Opportunity Question Paper
Page 5 of 6
June 2022
|
|
6 Page 6 |
▲back to top |
Demography and Population Studies
DPS610S
Question 11
a) Provide a comprehensive description or definition of population policies as used by decisions
makers globally
(4)
b) In terms of broad categories, implementations formats, and tools of population policies
highlighted in the course material, motivate how the Namibian Government is aligning its
population policies with its economic and social development priorities.
(6)
[10]
Question 12
Population growth and development can be described via 2x basic growth patterns namely
Exponential growth and Logistical/ Sigmoidal growth. Provide a visual description of an exponential
growth pattern by providing a sketch of a typical graph of a population growing exponentially.
[5]
Question 13
100 ..
9S-59
90-'H
6S.!9
11().84
1S-79
10-1~
U-69
60-IH
SS-59
S0.54
..is•a.
40-..14
lS-l'l
10-3-i
2S-29
20-24
lS-19
,_, 10.14
Male
"-1-----,-:.:'·c"cIc".!.!'!%!~
Populat,onPyramld.net
0.0~ 00"-
00',i, oox.
o.o~.10.0-1.
o.o¼Jo.1•.1,
o.1%ao.n.
Female
fi.4%
Namibia - 2022
Population: 2,633,874
Male
O.~ O.Of,
0.0% O.tn.
Female
l0-l4
25-29
20.2,
15-lt
,_, 10-1,1
••+-~-..--J
PopulatlonPyramld.net
Namibia - 2050
Population: 3,981,125
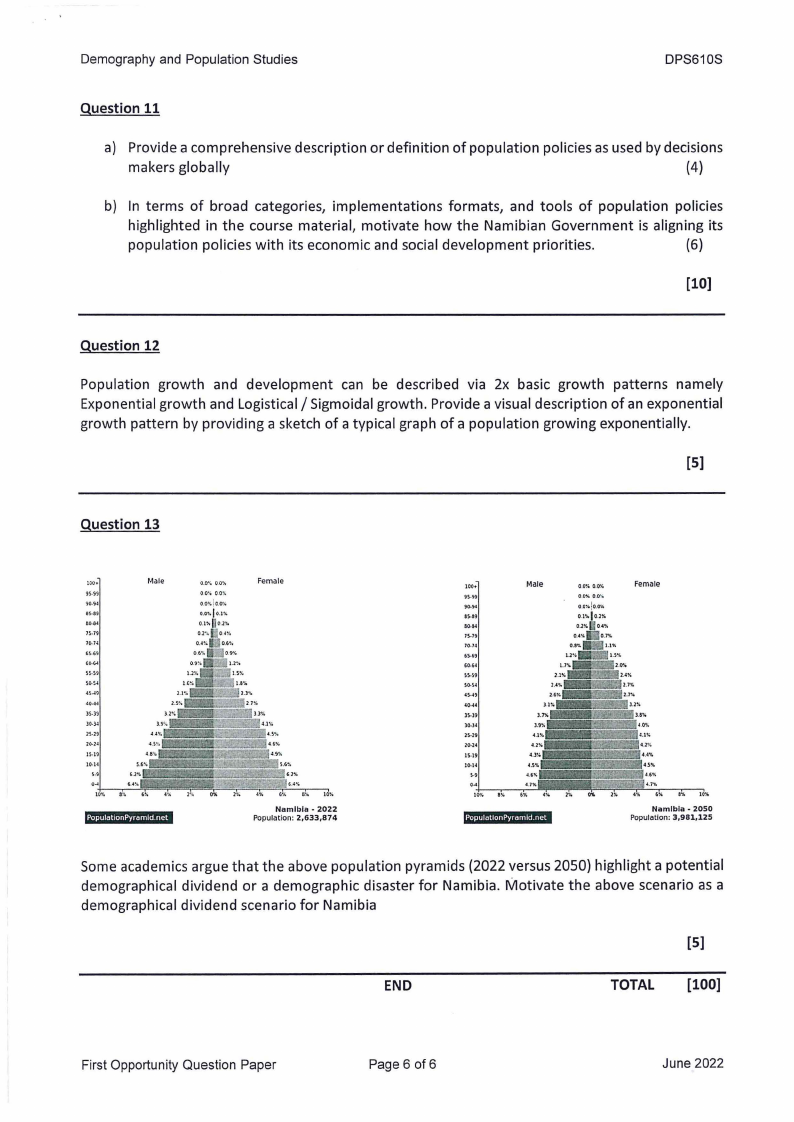
Some academics argue that the above population pyramids (2022 versus 2050) highlight a potential
demographical dividend or a demographic disaster for Namibia. Motivate the above scenario as a
demographical dividend scenario for Namibia
[5]
END
TOTAL [100]
First Opportunity Question Paper
Page 6 of 6
June 2022