


 |
AEM520S - AGRICULTURAL ECONOMICS - 1ST OPP - NOV 2022 |
|
|
1 Page 1 |
▲back to top |
nAmlBIA unlVERSITY
OF SCIEnCE Ano TECHnDLOGY
FACULTYOF HEALTH,NATURALRESOURCESAND APPLIEDSCIENCES
DEPARTMENTOF AGRICULTUREAND NATURALRESOURCESSCIENCES
QUALIFICATION:BACHELOROF SCIENCEIN AGRICULTURE
QUALIFICATION CODE: 07BAGA
COURSECODE: AEM520S
LEVEL: 7
COURSENAME: AGRICULTURALECONOMICS
DATE: NOVEMBER 2022
DURATION: 3 HOURS
MARKS: 100
FIRSTOPPORTUNITY EXAMINATION QUESTION PAPER
EXAMINER(S} Mr. Teofilus Shiimi
MODERATOR: Mr. Mwala Lubinda
INSTRUCTIONS
1. Answer ALL the questions.
2. Write clearly and neatly.
3. Number the answers clearly.
PERMISSIBLEMATERIALS
1. Examination question paper
2. Answering book
THIS EXAMINATION QUESTION PAPERCONSISTSOF 4 PAGES(Excluding this front page)
|
|
2 Page 2 |
▲back to top |
Question 1
"We have a problem, the economizing problem, scarcity problem. When we have a society with
unlimited wants this exerts pressure on available resources".
(a) Explain what will happen to the resources in a society when the needs of people exceed the
available resources?
[2]
(b) Given the current societal behaviour in Namibia, what happens to the access of the few
available resources if a situation like this is experienced?
[2]
(c) Assume the above-mentioned situation happens in your community where you serve as an
agricultural economist, assume you have the power to make decisions, and what action will you
take to normalize the situation? Mention at least three actions.
[6]
(d) "Economics is the field of study that deals with the allocation of resources among competing
needs over time". Why is it necessary for you to study the production, distribution, and
consumption of goods and services?
[4]
(e) "It is in the agricultural sector that the battle for long-term economic development will be
won or lost". What does this statement mean to you?
[2]
(f) Why is the agricultural sector characterized by price instability?
[4]
Sub -Total Mark
[20]
Question 2
(a) Define the following terminology?
[6]
(i) A rational consumer
(ii) Consumer Utility
(iii) Indifference curve
(b) One of the properties of the indifference curve is that "indifference curve do not cross". In
your own understanding explain why the indifference curve can't cross.
[3]
(c) Imagine you had a budget line of two commodities. Assume your income increased by 20%.
Explain how your budget line will shift, given that you spread your extra income equally on the
two commodities.
[3]
(d) Using the relationship between quantities demanded and price, differentiate the following
two commodities:
[4]
(i) Substitute
(ii) Compliment
1
|
|
3 Page 3 |
▲back to top |
(e) "The exchange of goods and services in the agricultural sector happened through agricultural
marketing" Explain why there are conflicts between consumers and producers in the agricultural
marketing system.
[4]
Sub-Total Marks
[20]
Question 3
(a) "A farmer sell oranges, when he sell at N$14.00 he sells 8015 oranges. When he increases the
prices to N$15.00 he sells only 8005 oranges". Calculate the price elasticity of demand for
orange?
[4]
(b) What type of price elasticity of demand you found in Question 3 (a)?
[2]
(c) Interpret the meaning of the price elasticity of demand that you mentioned in question 3 (b)?
[2]
(d) Assume the price given is for selling per piece of orange. Calculate the revenue the farmer
made by selling those oranges at the given prices?
[4]
(e) Which price will you recommend to sell the oranges with regard to the revenue you generated
in question 3 (d)? Motivate your answer.
[2]
(f) Discussthe importance of determining elasticity of any products.
[6]
Sub-Total Marks
[20]
2
|
|
4 Page 4 |
▲back to top |
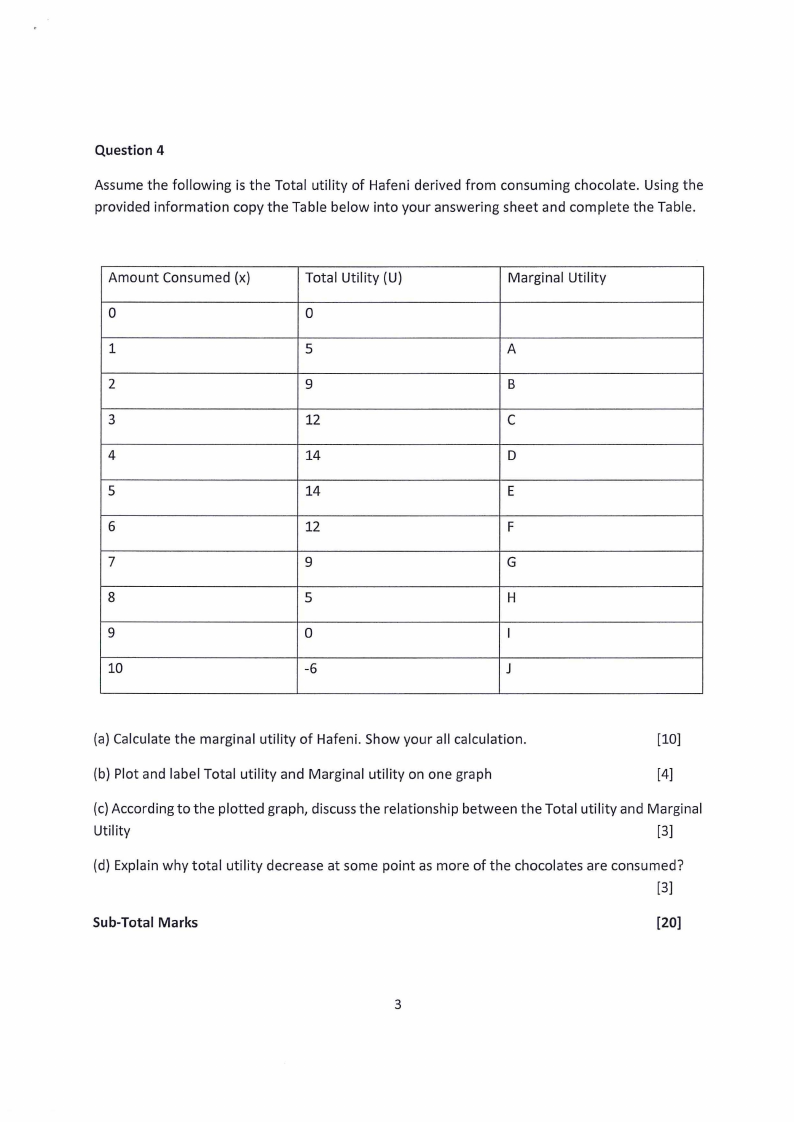
Question 4
Assume the following is the Total utility of Hafeni derived from consuming chocolate. Using the
provided information copy the Table below into your answering sheet and complete the Table.
Amount Consumed (x)
0
1
2
3
4
5
6
7
8
9
10
Total Utility {U)
0
5
9
12
14
14
12
9
5
0
-6
Marginal Utility
A
B
C
D
E
F
G
H
I
J
(a) Calculate the marginal utility of Hafeni. Show your all calculation.
[10]
(b) Plot and label Total utility and Marginal utility on one graph
[4]
(c) According to the plotted graph, discuss the relationship between the Total utility and Marginal
Utility
[3]
(d) Explain why total utility decrease at some point as more of the chocolates are consumed?
[3]
Sub-Total Marks
[20]
3
|
|
5 Page 5 |
▲back to top |
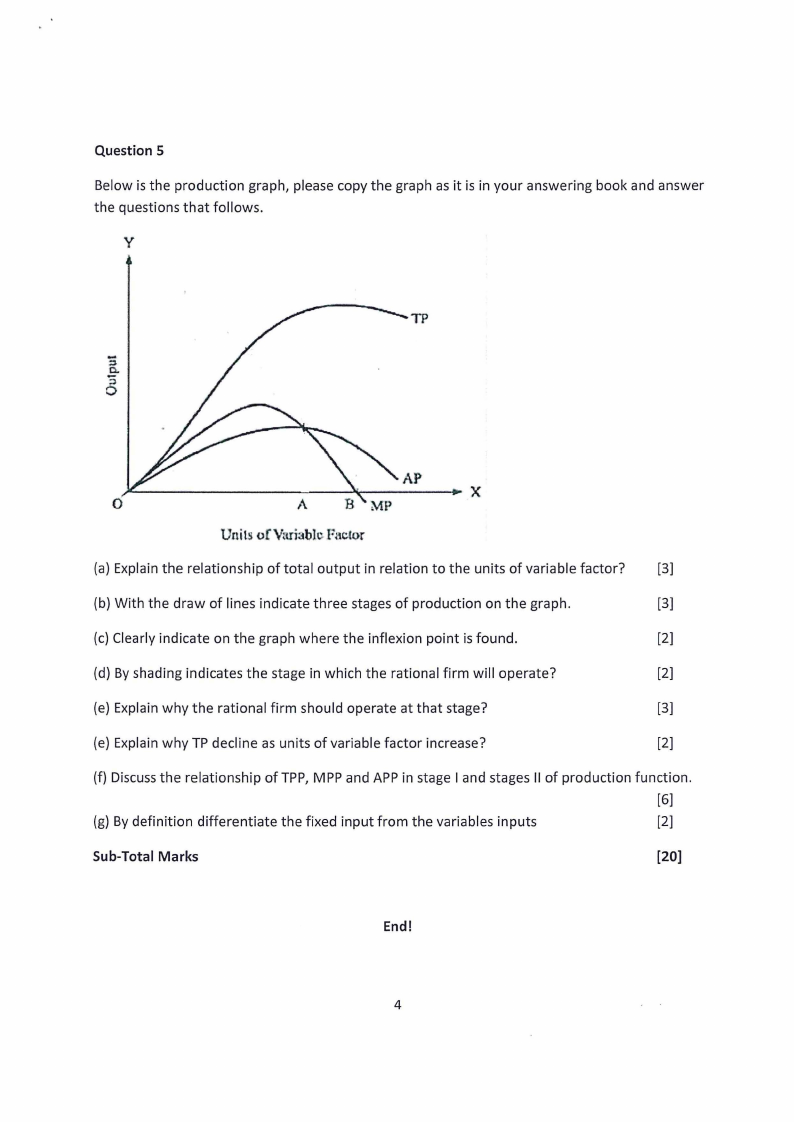
Question 5
Below is the production graph, please copy the graph as it is in your answering book and answer
the questions that follows.
y
TP
"5
0..
8
AP
Urtil!oi f VariableFactor
(a) Explain the relationship of total output in relation to the units of variable factor?
[3]
(b) With the draw of lines indicate three stages of production on the graph.
[3]
(c) Clearly indicate on the graph where the inflexion point is found.
[2]
(d) By shading indicates the stage in which the rational firm will operate?
[2]
(e) Explain why the rational firm should operate at that stage?
[3]
(e) Explain why TP decline as units of variable factor increase?
[2]
(f) Discussthe relationship of TPP, MPP and APP in stage I and stages II of production function.
[6]
(g) By definition differentiate the fixed input from the variables inputs
[2]
Sub-Total Marks
[20]
End!
4