


 |
BBS111S - BASIC BUSINESS - 1ST OPP - JUNE 2022 |
|
|
1 Page 1 |
▲back to top |
NAMIBIA UNIVERSITY
OF SCIENCE AND TECHNOLOGY
Faculty of Health, Applied Sciences and Natural Resources
Department of Mathematics and Statistics
QUALIFICATIONS: B. Business Admin, B. Marketing, B. Human
Management and B. Logistics and Supply Chain Management
QUALIFICATION CODES: 21BBAD / 07BMAR/
O7B/ H24R BPN / 07BLSM
LEVEL: 6
Resource
Management,
COURSE: BASIC BUSINESS STATISTICS 1A
COURSE CODE: BBS111S
B. Public
DATE: JUNE 2022
SESSION: 1
DURATION: 3 HOURS
MARKS: 100
EXAMINER(S)
MODERATOR:
FIRST OPPORTUNITY EXAMINATION QUESTION PAPER
MR EM MWAHI, DR G DIBABA, MR J AMUNYELA, DR J MWANYEKANGE,
MR S KASHIHALWA, MR A ROUX, MR G TAPEDZESA
MRJ SWARTZ
THIS QUESTION PAPER CONSISTS OF 5 PAGES
(Including this front page)
INSTRUCTIONS
1. Answer all the questions and number your solutions correctly.
2. Question 1 of this question paper entails multiple choice questions with options A to
D. Write down the letter corresponding to the best option for each question.
3. For Question 2 & 3 you are required to show clearly all the steps used in the
calculations.
4. All written work MUST be done in blue or black ink.
5. Untidy/ illegible work will attract no marks.
PERMISSIBLE MATERIALS
1. Non-Programmable Calculator without the cover
ATTACHMENTS
1. Standard normal Z-table
|
|
2 Page 2 |
▲back to top |
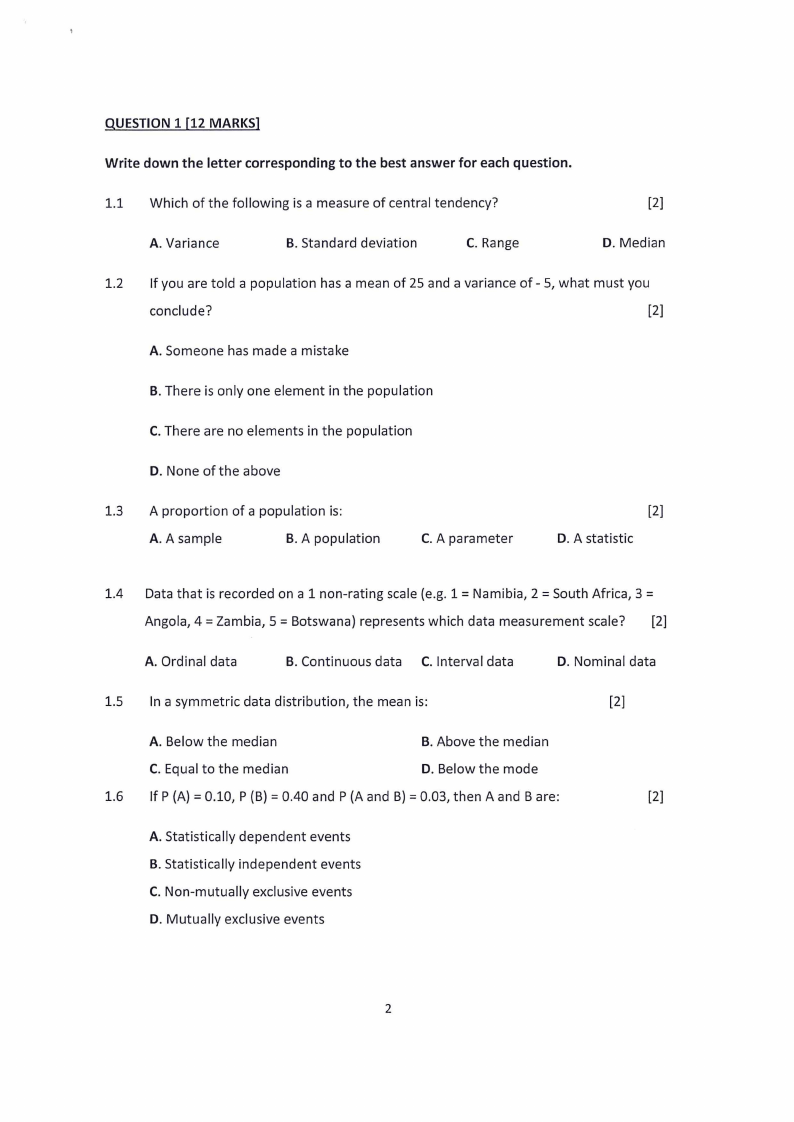
QUESTION 1 [12 MARKS]
Write down the letter corresponding to the best answer for each question.
1.1 Which of the following is a measure of central tendency?
[2]
A. Variance
B. Standard deviation
C. Range
D. Median
1.2
If you are told a population has a mean of 25 and a variance of - 5, what must you
conclude?
[2]
A. Someone has made a mistake
B. There is only one element in the population
C. There are no elements in the population
D. None of the above
1.3 A proportion of a population is:
A. A sample
B. A population
C. A parameter
[2]
D. A statistic
1.4 Data that is recorded on a 1 non-rating scale (e.g. 1 = Namibia, 2 = South Africa, 3 =
Angola, 4 = Zambia, 5 = Botswana) represents which data measurement scale?
[2]
A. Ordinal data
B. Continuous data_C. Interval data
D. Nominal data
Lb
In asymmetric data distribution, the mean is:
[2]
A. Below the median
B. Above the median
C. Equal to the median
D. Below the mode
1.6
If P (A) = 0.10, P (B) = 0.40 and P (A and B) = 0.03, then A and B are:
[2]
A. Statistically dependent events
B. Statistically independent events
C. Non-mutually exclusive events
D. Mutually exclusive events
|
|
3 Page 3 |
▲back to top |
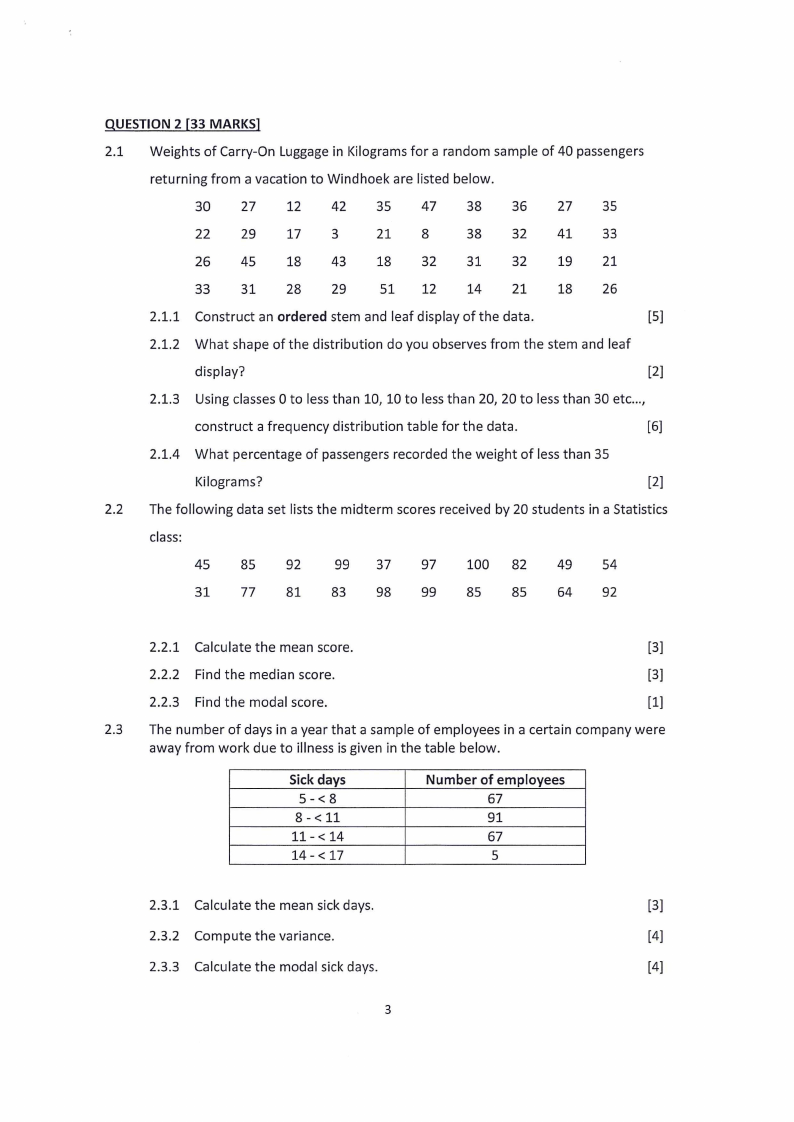
QUESTION 2 [33 MARKS]
2.1 Weights of Carry-On Luggage in Kilograms for a random sample of 40 passengers
returning from a vacation to Windhoek are listed below.
30
27
12
42
35
47
38
36
27
35
22
29
17
3
21
8
38
32
41
33
26
45
18
43
18
32
31
32
19
21
33
31
28
29
51
12
14
21
18
26
2.1.1 Construct an ordered stem and leaf display of the data.
[5]
2.1.2. What shape of the distribution do you observes from the stem and leaf
display?
[2]
2.1.3. Using classes 0 to less than 10, 10 to less than 20, 20 to less than 30 etc...,
construct a frequency distribution table for the data.
[6]
2.1.4 What percentage of passengers recorded the weight of less than 35
Kilograms?
[2]
2.2. The following data set lists the midterm scores received by 20 students in a Statistics
class:
45
85
92
99
37
97
100
82
49
54
31
77
81
83
98
99
85
85
64
92
2.2.1 Calculate the mean score.
[3]
2.2.2 Find the median score.
[3]
2.2.3. Find the modal score.
[1]
2.3 The number of days in a year that a sample of employees in a certain company were
away from work due to illness is given in the table below.
Sick days
5-<8
8-<11
11-<14
14-<17
Number
of employees
67
91
67
5
2.3.1 Calculate the mean sick days.
[3]
2.3.2. Compute the variance.
[4]
2.3.3. Calculate the modal sick days.
[4]
|
|
4 Page 4 |
▲back to top |
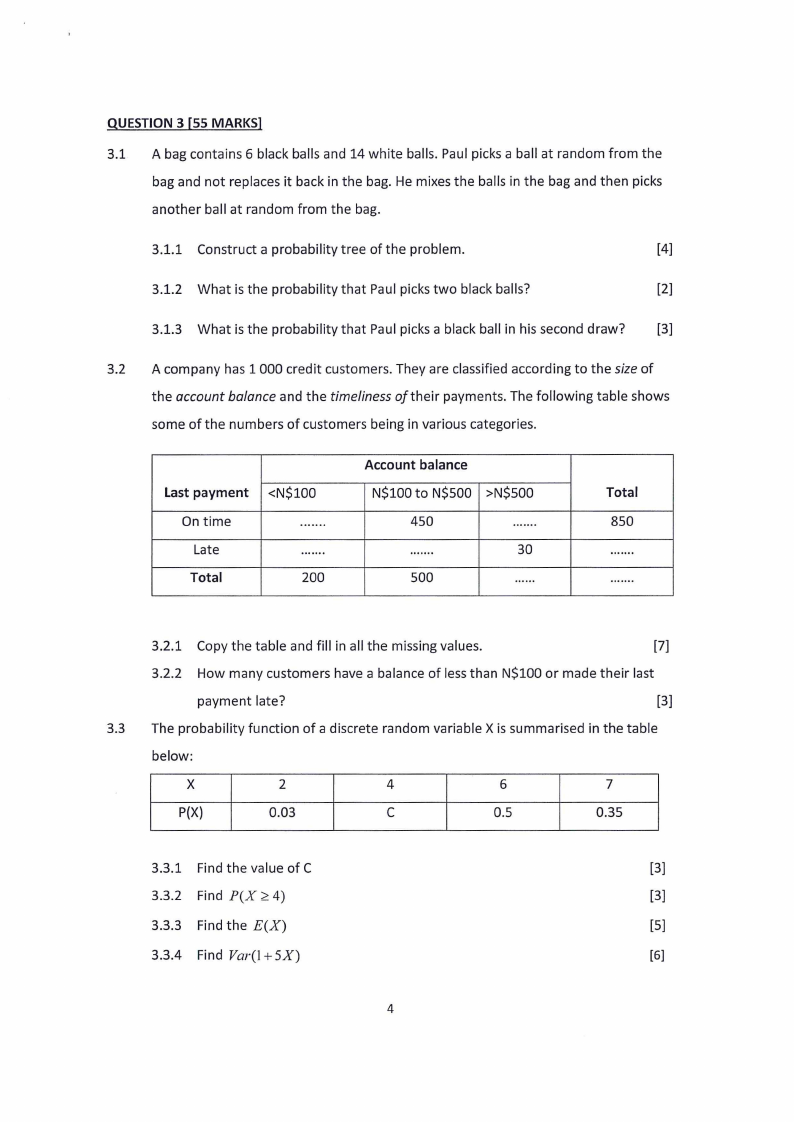
QUESTION 3 [55 MARKS]
3.1 A bag contains 6 black balls and 14 white balls. Paul picks a ball at random from the
bag and not replaces it back in the bag. He mixes the balls in the bag and then picks
another ball at random from the bag.
3.1.1 Construct a probability tree of the problem.
[4]
3.1.2. What is the probability that Paul picks two black balls?
[2]
3.1.3. What is the probability that Paul picks a black ball in his second draw?
[3]
3.2 A company has 1 000 credit customers. They are classified according to the size of
the account balance and the timeliness of their payments. The following table shows
some of the numbers of customers being in various categories.
Account balance
Last payment | <NS100
NS100 to NS500 | >NS500
Ontime |
uw...
450;
fk
neutee
Late faces fn nee
300
Total
200
500 |
wsesxs
Total
850
||
tastens
| — aweeavne
3.2.1 Copy the table and fill in all the missing values.
[7]
3.2.2. How many customers have a balance of less than N$100 or made their last
payment late?
[3]
3.3 The probability function of a discrete random variable X is summarised in the table
below:
X
2
4
P(X)
0.03
Cc
6
Z
0.5
0.35
3.3.1 Find the value of C
[3]
3.3.2 Find PCY >4)
[3]
3.3.3. Findthe E(X)
[5]
3.3.4 Find Var(1+5X)
[6]
|
|
5 Page 5 |
▲back to top |
3.4 A shoe store’s records show that 30% of the customers purchase by credit card. This
morning 20 customers purchased shoes from the store.
3.4.1 Find the probability that at most 3 of the customers used acredit card. [5]
3.4.2. What is the probability that at least 3 customers but not more than 6 used a
credit card?
[4]
3.4.3. What is the expected number of customers using a credit card?
[2]
3.9 Weekly purchases of petrol at a garage are normally distributed with a mean of 5000
litres and a standard deviation of 2000 litres. What is the probability that in a given
week, the purchases will be:
3.5.1 Between 2500 and 5000 litres.
[5]
3.5.2 More than 3760 litres.
[3]
|
|
6 Page 6 |
▲back to top |
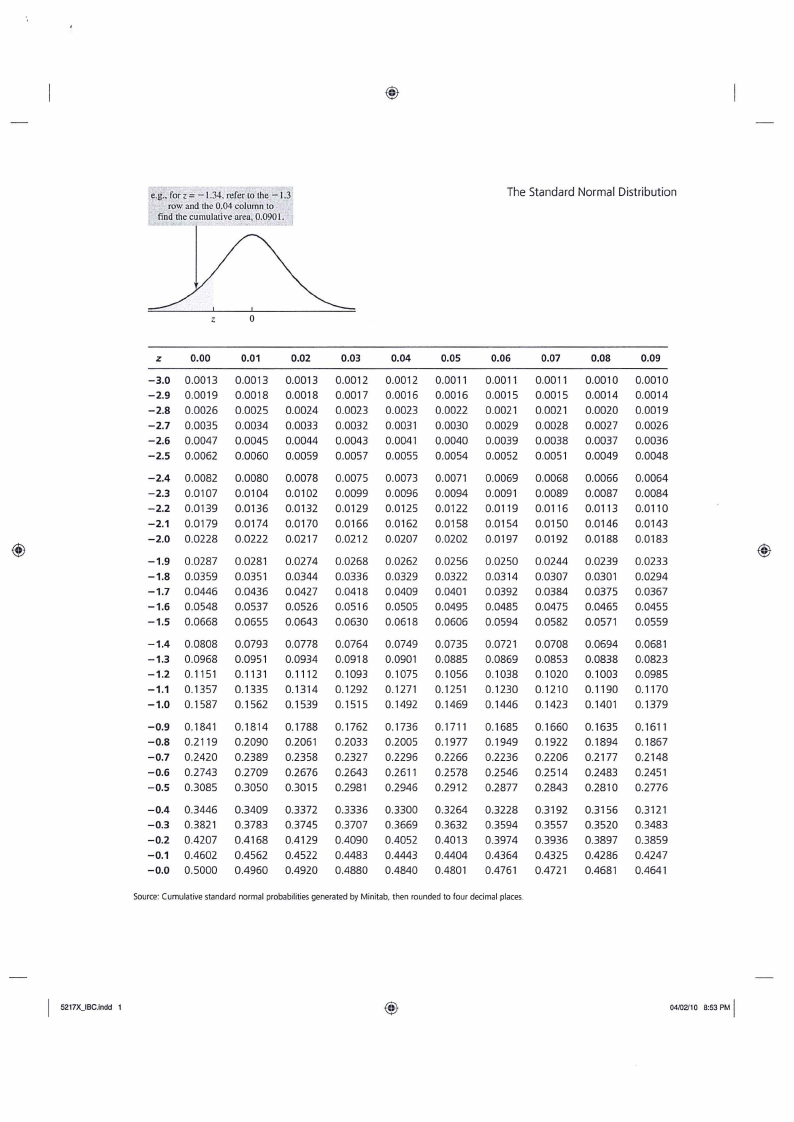
e.g., for z= —1.34, refer to the —1.3
row and the 0.04 column to
find the cumulative area, 0.0901. -
The Standard Normal Distribution
0
Zz
0.00
-3.0 0.0013
-2.9 0.0019
-2.8 0.0026
-2.7. 0.0035
-2.6 0.0047
-2.5 0.0062
-2.4 0.0082
-2.3 0.0107
-2.2. 0.0139
-2.1 0.0179
—2.0 0.0228
-1.9 0.0287
-1.8 0.0359
-1.7 0.0446
-1.6 0.0548
-1.5 0.0668
-1.4 0.0808
-1.3 0.0968
—1.2 0.1151
—1.1 0.1357)
-1.0 0.1587
-0.9 0.1841
-0.8 0.2119
-0.7. 0.2420
-0.66 0.2743
-0.5 0.3085
-0.4 0.3446
-0.3 0.3821
-0.2 0.4207
-0.1 0.4602
-0.0 0.5000
0.01
0.0013
0.0018
0.0025
0.0034
0.0045
0.0060
0.0080
0.0104
0.0136
0.0174
0.0222
0.0281
0.0351
0.0436
0.0537
0.0655
0.0793
0.0951
0.1131
0.1335
0.1562
0.1814
0.2090
0.2389
0.2709
0.3050
0.3409
0.3783
0.4168
0.4562
0.4960
0.02
0.0013
0.0018
0.0024
0.0033
0.0044
0.0059
0.0078
0.0102
0.0132
0.0170
0.0217
0.0274
0.0344
0.0427
0.0526
0.0643
0.0778
0.0934
0.1112
0.1314
0.1539
0.1788
0.2061
0.2358
0.2676
0.3015
0.3372
0.3745
0.4129
0.4522
0.4920
0.03
0.0012
0.0017
0.0023
0.0032
0.0043
0.0057
0.0075
0.0099
0.0129
0.0166
0.0212
0.0268
0.0336
0.0418
0.0516
0.0630
0.0764
0.0918
0.1093
0.1292
0.1515
0.1762
0.2033
0.2327
0.2643
0.2981
0.3336
0.3707
0.4090
0.4483
0.4880
0.04
0.0012
0.0016
0.0023
0.0031
0.0041
0.0055
0.0073
0.0096
0.0125
0.0162
0.0207
0.0262
0.0329
0.0409
0.0505
0.0618
0.0749
0.0901
0.1075
0.1271
0.1492
0.1736
0.2005
0.2296
0.2611
0.2946
0.3300
0.3669
0.4052
0.4443
0.4840
0.05
0.0011
0.0016
0.0022
0.0030
0.0040
0.0054
0.0071
0.0094
0.0122
0.0158
0.0202
0.0256
0.0322
0.0401
0.0495
0.0606
0.0735
0.0885
0.1056
0.1251
0.1469
0.1711
0.1977
0.2266
0.2578
0.2912
0.3264
0.3632
0.4013
0.4404
0.4801
0.06
0.0011
0.0015
0.0021
0.0029
0.0039
0.0052
0.0069
0.0091
0.0119
0.0154
0.0197
0.0250
0.0314
0.0392
0.0485
0.0594
0.0721
0.0869
0.1038
0.1230
0.1446
0.1685
0.1949
0.2236
0.2546
0.2877
0.3228
0.3594
0.3974
0.4364
0.4761
0.07
0.0011
0.0015
0.0021
0.0028
0.0038
0.0051
0.0068
0.0089
0.0116
0.0150
0.0192
0.0244
0.0307
0.0384
0.0475
0.0582
0.0708
0.0853
0.1020
0.1210
0.1423
0.1660
0.1922
0.2206
0.2514
0.2843
0.3192
0.3557
0.3936
0.4325
0.4721
Source: Cumulative standard normal probabilities generated by Minitab, then rounded to four decimal places.
0.08
0.0010
0.0014
0.0020
0.0027
0.0037
0.0049
0.0066
0.0087
0.0113
0.0146
0.0188
0.0239
0.0301
0.0375
0.0465
0.0571
0.0694
0.0838
0.1003
0.1190
0.1401
0.1635
0.1894
0.2177
0.2483
0.2810
0.3156
0.3520
0.3897
0.4286
0.4681
0.09
0.0010
0.0014
0.0019
0.0026
0.0036
0.0048
0.0064
0.0084
0.0110
0.0143
0.0183
0.0233
0.0294
0.0367
0.0455
0.0559
0.0681
0.0823
0.0985
0.1170
0.1379
0.1611
0.1867
0.2148
0.2451
0.2776
0.3121
0.3483
0.3859
0.4247
0.4641
5217X_IBC.indd 1
04/02/10 8:53 PM
|
|
7 Page 7 |
▲back to top |
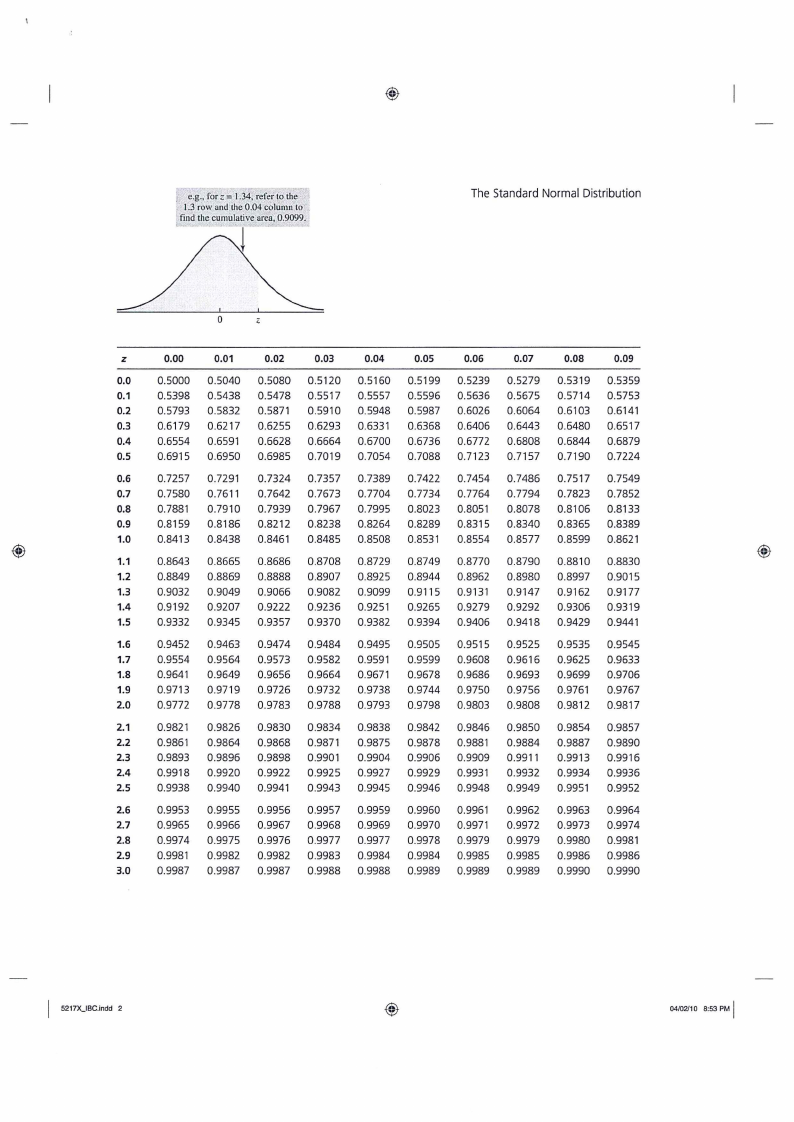
_ eg., for z= 1.34, refer to the
1.3 row and the 0.04 column to
! find the cumulative area, 0.9099.
The Standard Normal Distribution
z
0.00
0.01
0.02
0.03
0.04
0.05
0.06
0.07
0.08
0.09
0.0
0.5000 0.5040 0.5080 0.5120 0.5160 0.5199 0.5239 0.5279 0.5319 0.5359
0.1
0.5398 0.5438 0.5478 0.5517 0.5557 0.5596 0.5636 0.5675 0.5714 0.5753
0.2
0.5793 0.5832 0.5871 0.5910 0.5948 0.5987 0.6026 0.6064 0.6103 0.6141
0.3
0.6179 0.6217 0.6255 0.6293 0.6331 0.6368 0.6406 0.6443 0.6480 0.6517
0.4
0.6554 0.6591 0.6628 0.6664 0.6700 0.6736 0.6772 0.6808 0.6844 0.6879
0.5
0.6915 0.6950 0.6985 0.7019 0.7054 0.7088 0.7123 0.7157 0.7190 0.7224
0.6
0.7257 0.7291 0.7324 0.7357 0.7389 0.7422 0.7454 0.7486 0.7517 0.7549
0.7
0.7580 0.7611 0.7642 0.7673 0.7704 0.7734 0.7764 0.7794 0.7823 0.7852
0.8
0.7881 0.7910 0.7939 0.7967 0.7995 0.8023 0.8051 0.8078 0.8106 0.8133
0.9
0.8159 0.8186 0.8212 0.8238 0.8264 0.8289 0.8315 0.8340 0.8365 0.8389
1.0
0.8413 0.8438 0.8461 0.8485 0.8508 0.8531 0.8554 0.8577 0.8599 0.8621
1.1
0.8643 0.8665 0.8686 0.8708 0.8729 0.8749 0.8770 0.8790 0.8810 0.8830
1.2
0.8849 0.8869 0.8888 0.8907 0.8925 0.8944 0.8962 0.8980 0.8997 0.9015
1.3
0.9032 0.9049 0.9066 0.9082 0.9099 0.9115 0.9131 0.9147 0.9162 0.9177
1.4
0.9192 0.9207 0.9222 0.9236 0.9251 0.9265 0.9279 0.9292 0.9306 0.9319
1.5
0.9332 0.9345 0.9357 0.9370 0.9382 0.9394 0.9406 0.9418 0.9429 0.9441
1.6
0.9452 0.9463 0.9474 0.9484 0.9495 0.9505 0.9515 0.9525 0.9535 0.9545
1.7
0.9554 0.9564 0.9573 0.9582 0.9591 0.9599 0.9608 0.9616 0.9625 0.9633
1.8
0.9641 0.9649 0.9656 0.9664 0.9671 0.9678 0.9686 0.9693 0.9699 0.9706
1.9
0.9713 0.9719 0.9726 0.9732 0.9738 0.9744 0.9750 0.9756 0.9761 0.9767
2.0
0.9772 0.9778 0.9783 0.9788 0.9793 0.9798 0.9803 0.9808 0.9812 0.9817
2.1
0.9821 0.9826 0.9830 0.9834 0.9838 0.9842 0.9846 0.9850 0.9854 0.9857
2.2
0.9861 0.9864 0.9868 0.9871 0.9875 0.9878 0.9881 0.9884 0.9887 0.9890
2.3
0.9893 0.9896 0.9898 0.9901 0.9904 0.9906 0.9909 0.9911 0.9913 0.9916
2.4
0.9918 0.9920 0.9922 0.9925 0.9927 0.9929 0.9931 0.9932 0.9934 0.9936
2.5
0.9938 0.9940 0.9941 0.9943 0.9945 0.9946 0.9948 0.9949 0.9951 0.9952
2.6
0.9953 0.9955 0.9956 0.9957 0.9959 0.9960 0.9961 0.9962 0.9963 0.9964
2.7
0.9965 0.9966 0.9967 0.9968 0.9969 0.9970 0.9971 0.9972 0.9973 0.9974
2.8
0.9974 0.9975 0.9976 0.9977 0.9977 0.9978 0.9979 0.9979 0.9980 0.9981
2.9
0.9981 0.9982 0.9982 0.9983 0.9984 0.9984 0.9985 0.9985 0.9986 0.9986
3.0
0.9987 0.9987 0.9987 0.9988 0.9988 0.9989 0.9989 0.9989 0.9990 0.9990
5217X_IBC.indd 2
04/02/10 8:53 PM