


 |
ASP610S-ASP611S - APPLIED STATISTICS AND PROBABILITY - 2ND OPP - JULY 2022 |
|
|
1 Page 1 |
▲back to top |
4
NAMIBIA UNIVERSITY
OF SCIENCE AND TECHNOLOGY
FACULTY OF HEALTH, APPLIED SCIENCES AND NATURAL RESOURCES
DEPARTMENT OF MATHEMATICS AND STATISTICS
QUALIFICATION: BACHELOR OF COMPUTER SCIENCE
QUALIFICATION CODE: 07BOCS
LEVEL: 6
COURSE CODE: ASP610S/611S
COURSE NAME: : APPLIED STATISTICS & PROBBAABILITY
FOR IT
SESSION: JULY 2022
DURATION: 3 HOURS
PAPER: THEORY
MARKS: 90
SUPPLEMENTARY / SECOND OPPORTUNITY EXAMINATION
EXAMINER:
MR AJ. ROUX
MODERATOR:
MR E. MWAHI
THIS QUESTION PAPER CONSISTS OF 5 PAGES
(Excluding Statistical Tables & Graph Paper)
INSTRUCTIONS
1. Answer ALL the questions in the booklet provided.
2. Show clearly all the steps used in the calculations.
3. All written work must be done in blue or black ink.
PERMISSIBLE MATERIALS
1. Non-programmable calculator without a cover.
ATTACHMENTS
1. Statistical Tables ( Z-tables)
2. Graph Paper
Page 1 of 5
|
|
2 Page 2 |
▲back to top |
QUESTION
1
[10x 2=20]
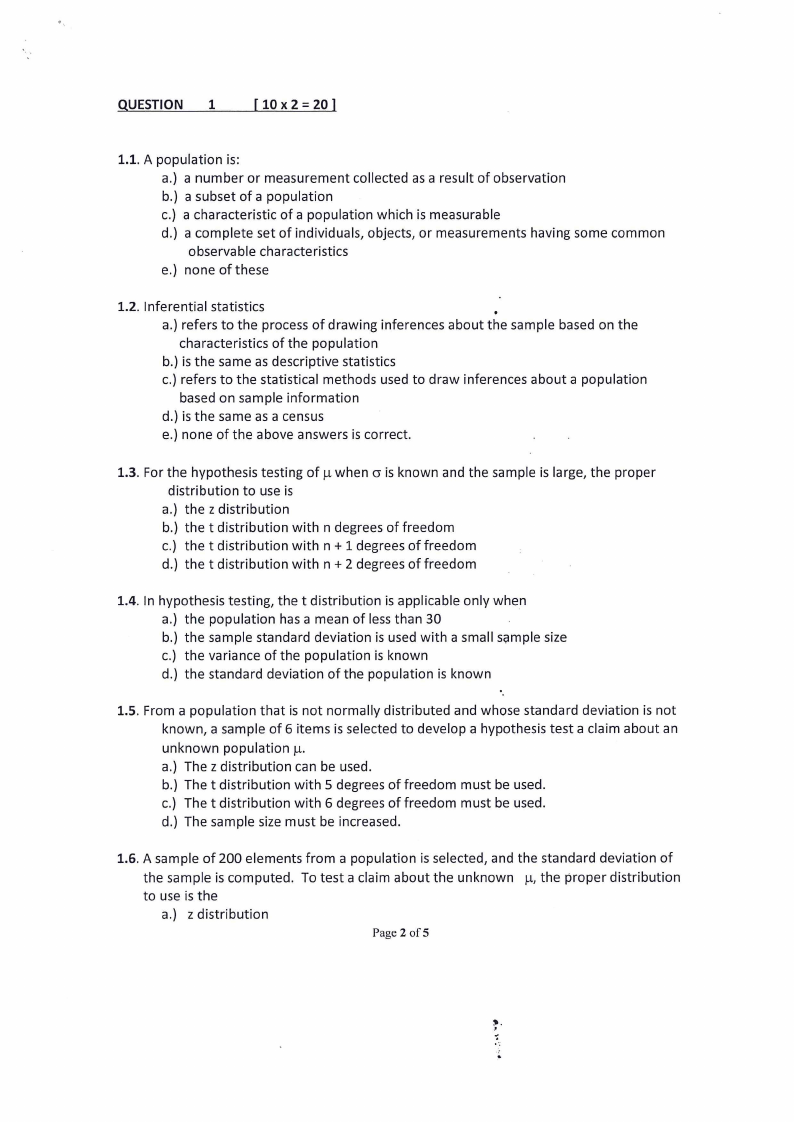
1.1. A population is:
a.) anumber or measurement collected as a result of observation
b.) a subset of a population
c.) a characteristic of a population which is measurable
d.) a complete set of individuals, objects, or measurements having some common
observable characteristics
e.) none of these
1.2. Inferential statistics
.
a.) refers to the process of drawing inferences about the sample based on the
characteristics of the population
b.) is the same as descriptive statistics
c.) refers to the statistical methods used to draw inferences about a population
based on sample information
d.) is the same as a census
e.) none of the above answers is correct.
1.3. For the hypothesis testing of p when o is known and the sample is large, the proper
distribution to use is
a.) the z distribution
b.) the t distribution with n degrees of freedom
c.) the t distribution with n + 1 degrees of freedom
d.) the t distribution with n + 2 degrees of freedom
1.4. In hypothesis testing, the t distribution is applicable only when
a.) the population has a mean of less than 30
b.) the sample standard deviation is used with a small sample size
c.) the variance of the population is known
d.) the standard deviation of the population is known
1.5. From a population that is not normally distributed and whose standard deviation is not
known, a sample of 6 items is selected to develop a hypothesis test a claim about an
unknown population nu.
a.) The z distribution can be used.
b.) The t distribution with 5 degrees of freedom must be used.
c.) The t distribution with 6 degrees of freedom must be used.
d.) The sample size must be increased.
1.6. A sample of 200 elements from a population is selected, and the standard deviation of
the sample is computed. To test a claim about the unknown uy, the proper distribution
to use is the
a.) z distribution
Page 2 of5
|
|
3 Page 3 |
▲back to top |
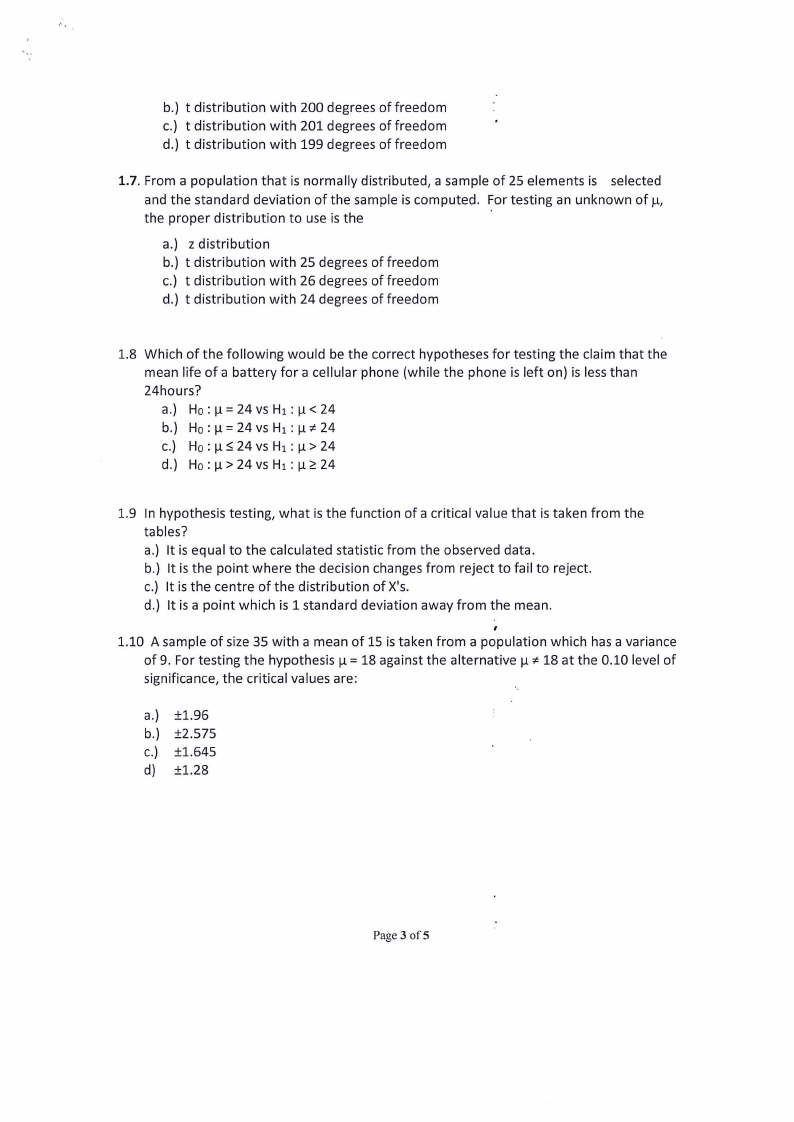
b.) t distribution with 200 degrees of freedom
c.) t distribution with 201 degrees of freedom
d.) t distribution with 199 degrees of freedom
1.7. From a population that is normally distributed, a sample of 25 elements is selected
and the standard deviation of the sample is computed. For testing an unknown of iL,
the proper distribution to use is the
,
a.) z distribution
b.) t distribution with 25 degrees of freedom
c.) t distribution with 26 degrees of freedom
d.) t distribution with 24 degrees of freedom
1.8 Which of the following would be the correct hypotheses for testing the claim that the
mean life of a battery for a cellular phone (while the phone is left on) is less than
24hours?
a.) Ho: W=24vs Hi: u< 24
b.) Ho: W=24vs Hi: #24
c.) Ho:ws24vsHi:p>24
d.) Ho: w>24vs Hi: p224
1.9 In hypothesis testing, what is the function of a critical value that is taken from the
tables?
a.) It is equal to the calculated statistic from the observed data.
b.) It is the point where the decision changes from reject to fail to reject.
c.) It is the centre of the distribution of X's.
d.) It is a point which is 1 standard deviation away from the mean.
Ci
1.10 Asample of size 35 with a mean of 15 is taken from a population which has a variance
of 9. For testing the hypothesis 1 = 18 against the alternative py # 18 at the 0.10 level of
significance, the critical values are:
a.) +1.96
b.) +#2.575
c.) +1.645
d) +1.28
Page 3 of 5
|
|
4 Page 4 |
▲back to top |
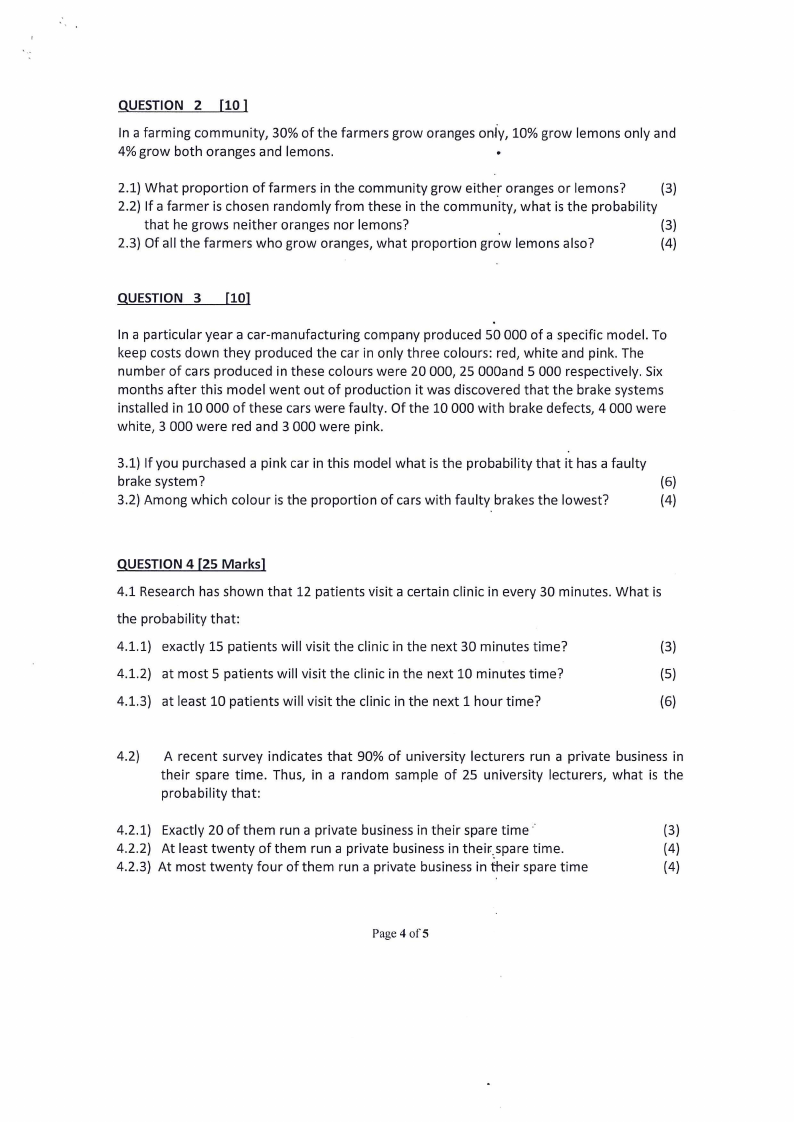
UESTION 2 [10
In a farming community, 30% of the farmers grow oranges only, 10% grow lemons only and
4% grow both oranges and lemons.
°
2.1) What proportion of farmers in the community grow either oranges or lemons?
(3)
2.2) If a farmer is chosen randomly from these in the community, what is the probability
that he grows neither oranges nor lemons?
(3)
2.3) Of all the farmers who grow oranges, what proportion grow lemons also?
(4)
QUESTION 3 [10]
In a particular year a car-manufacturing company produced 50 000 of a specific model. To
keep costs down they produced the car in only three colours: red, white and pink. The
number of cars produced in these colours were 20 000, 25 O00and 5 000 respectively. Six
months after this model went out of production it was discovered that the brake systems
installed in 10 O00 of these cars were faulty. Of the 10 000 with brake defects, 4 000 were
white, 3 000 were red and 3 000 were pink.
3.1) If you purchased a pink car in this model what is the probability that it has a faulty
brake system?
(6)
3.2) Among which colour is the proportion of cars with faulty brakes the lowest?
(4)
QUESTION 4 [25 Marks]
4.1 Research has shown that 12 patients visit a certain clinic in every 30 minutes. What is
the probability that:
4.1.1) exactly 15 patients will visit the clinic in the next 30 minutes time?
(3)
4.1.2) at most 5 patients will visit the clinic in the next 10 minutes time?
(5)
4.1.3) atleast 10 patients will visit the clinic in the next 1 hour time?
(6)
4.2) A recent survey indicates that 90% of university lecturers run a private business in
their spare time. Thus, in a random sample of 25 university lecturers, what is the
probability that:
4.2.1) Exactly 20 of them run a private business in their spare time ™
(3)
4.2.2) Atleast twenty of them run a private business in their spare time.
(4)
4.2.3) At most twenty four of them run a private business in their spare time
(4)
Page 4 of5
|
|
5 Page 5 |
▲back to top |
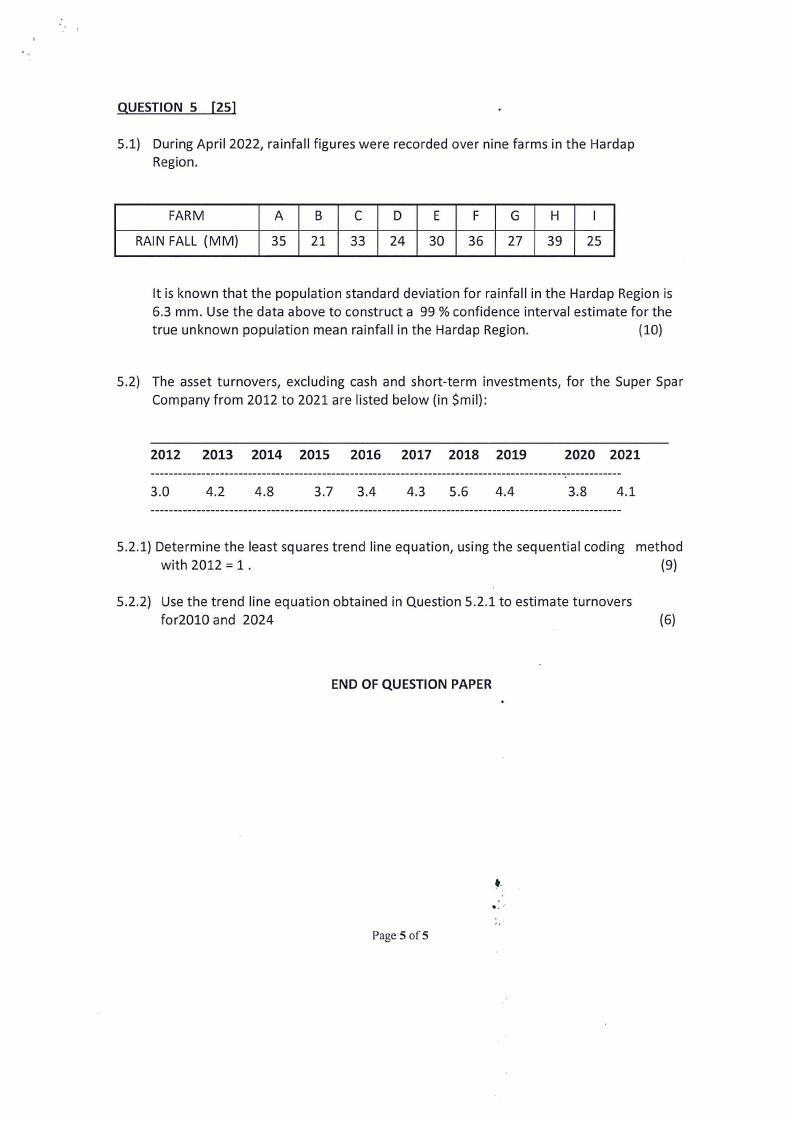
QUESTION 5 [25]
5.1) During April 2022, rainfall figures were recorded over nine farms in the Hardap
Region.
FARM
RAIN FALL (MM)
A
B
C
D
E
F
G
H
|
35 |} 21 | 33 | 24 | 30 | 36 | 27 | 39 |} 25
It is known that the population standard deviation for rainfall in the Hardap Region is
6.3 mm. Use the data above to construct a 99 % confidence interval estimate for the
true unknown population mean rainfall in the Hardap Region.
(10)
5.2) The asset turnovers, excluding cash and short-term investments, for the Super Spar
Company from 2012 to 2021 are listed below (in Smil):
2012) +2013 2014 2015 2016 2017 2018 2019
3.0
4.2
4.8
3.7 3.4
4.3 5.6
4.4
2020 2021
3.8
4.1
5.2.1) Determine the least squares trend line equation, using the sequential coding method
with 2012 =1.
(9)
5.2.2) Use the trend line equation obtained in Question 5.2.1 to estimate turnovers
for2010 and 2024
(6)
END OF QUESTION PAPER
Page 5 of 5
|
|
6 Page 6 |
▲back to top |
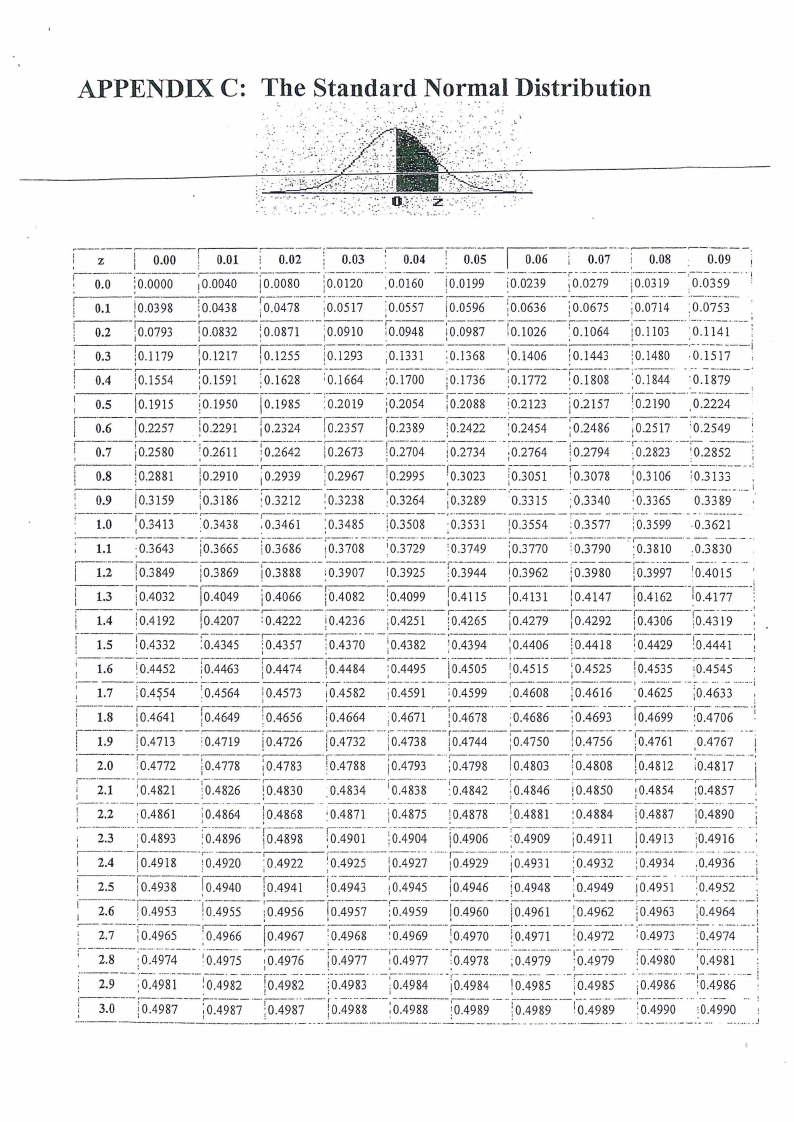
APPENDIX C: The Standard Normal Distribution
|
1
z
‘0.0
0.1
0.2
0.3
[0.4
0.5
| 0.6
(0.7
0.8
0.9
1.0
| LL
[12
| 13
| 14
i
|'
1.5
16
1.7
1.8
| 19
| 2.0
21
; 2.2
2.3
2.4
' 2.5
| 26
2.7
' 2.8
2.9
3.0
{| 0.00 | 0.01 | 0.02 | 0.03 | 004 , 005 | 0.06 | 0.07 | 0.08 . 0.09|
10.0000 10.0040 10.0080 {0.0120 0.0160 10.0199 10.0239 {0.0279 j0.0319 0.0359
10.0398 (0.0438 |,0.0478 0.0517 0.0557 :{0.0596 sme 10.0636 10.0675 0.0714 0.0753. oeraeatc er ee open form Se Se
0.0793 10.0832 {0.0871 0.0910 10.0948 10.0987 10.1026 0.1064 0.1103. 0.1141 |
(0.1179 (0.1217 {0.1255 —(0.1293 0.1331 10.1368 10.1406 0.1443 0.1480 r-o0a.1517 —j
[0.1554 {0.1591 (0.1628 10.1664 0.1700 30.1736 0.1772 10.1808 0.1844 0.1879
[0.1915 10.1950 [0.1985 10.2019 10.2054 [0.2088 10.2123 (0.2157 10.2190 0.2224
{0.2257 10.2291 [0.2324 10.2357 {0.2389 0.2422 10.2454 10.2486 = 0.2517 0.2549!
0.2580 10.2611 10.2642 {0.2673 -|0.2704 + 10.2734 10.2764 10.2794 ~f—o-0oe.2823 tee eee r0e.e 2852 ee
0.2881 |0.2910 0.2939 10.2967 10.2995 ‘0.3023 10.3051 10.3078 + 10.3106 10.3133,
[0.3159 (0.3186 10.3212 10.3238 10.3264 0.3289 0.3315 (0.3340 0.3365 0.3389
103413 (0.3438 0.3461 0.3485 10.3508 0.3531 10.3554 .0.3577 0.3599 0.3621
-0.3643 [0.3665 10.3686 10.3708 10.3729 ‘0.3749 «10.3770 0.3790 «0.3810 0.3830
fo3849 {03869 [0.3888 0.3907 10.3925 (0.3948 (03962 103980 (0.3997 (0.4018
|0.4032 [0.4049 0.4066 {0.4082 10.4099 [0.4115 0.4131 10.4147 {0.4162 10.4177
(0.4192 [0.4207 10.4222 10.4236 © ,0.4251 10.4265 {0.4279 [0.4292 10.4306 (0.4319 ,
1: 0.4332 1=0.4345
10.4452 0.4463
f10.4357
0.4370 ———F
Sees
_—(|0.4382_—*'10.4394
10.4406cemncne[0.441a8e 19.4429
0.4474 [0.4484 0.4495 [0.4505 smc [0.4515 [0.4525 '0.4535
a 0.44e 41
10.4545 STC ame. emmey nae
(0.4554 (0.4564 10.4573 10.4582 10.4591 10.4599 :0.4608 10.4616 ‘0.4625 ,0.4633_
0.4641 [0.4649 0.4656 10.4664 0.4671 10.4678 0.4686 += :0.4693 (10.4699 10.4706
04713 0.4719 [0.4726 [0.4732 (0.4738 [0.4744 (0.4750 10.4756 0.4761 0.4767 |
10.4772 (0.4778 10.4783 10.4788 0.4793 0.4798 (10.4803 10.4808 + {0.4812 0.4817 |
10.4821
Ae
:0.4861
0.4893
:0.4826 10.4830
Sy Ee peep commertene tee EES
0. 4864
10 4868
0486 10.4898
0.4834 + '0.4838 «0.4842 0.4846. «10.4850
Eee
ore a
te ieeomerae mdse PAREN EES
= ‘0.4871 “10. 4875
:0.4878
a pnt ne ec ee
10.4881
:0.4884
pete etc tenet neaa
(0.4901 0.4904 10. 4906 :0. 4909 10. 4911
10.4854 10.4857
cremains (ES
id. 4887 {0 4890
penne
\\0. 49130. 4916
[0.4918 10.4920 0.4922 10.4925 {0.4927 10.4929 [0.4931 :0.4932 10.4934 .0.4936
0.4938 10.4940 [0.4941 10.4943 10.4945 10.4946 10.4948 «0.4949 «(10.4951 -0.4952_—C
10.4953 10.4955 10.4956 10.4957 (0.4959 [0.4960 [0.4961 10.4962 0.4963 0.4964 |
{0.4965 0.4966 [0.4967 0.4968 10.4969 [0.4970 [0.4971 (0.4972 10.4973 0.4974
10.4974
10.4981
10.4987
‘0 4975 10. 4976
10.4982 “10.4982
0.4987 __ 10.4987
“10. 4977,
{0.4983
Tous4988
10, 4977,
0.4984
0.4988
0. 4978
0.4984
(0.4989
0. 4979
10.4985
0.4989
0. 4979
0.4985
Vo. 4989
‘0. 4980
9.8986
0.4990
‘0. 4981
10.4986
10.4990 :
|
|
7 Page 7 |
▲back to top |
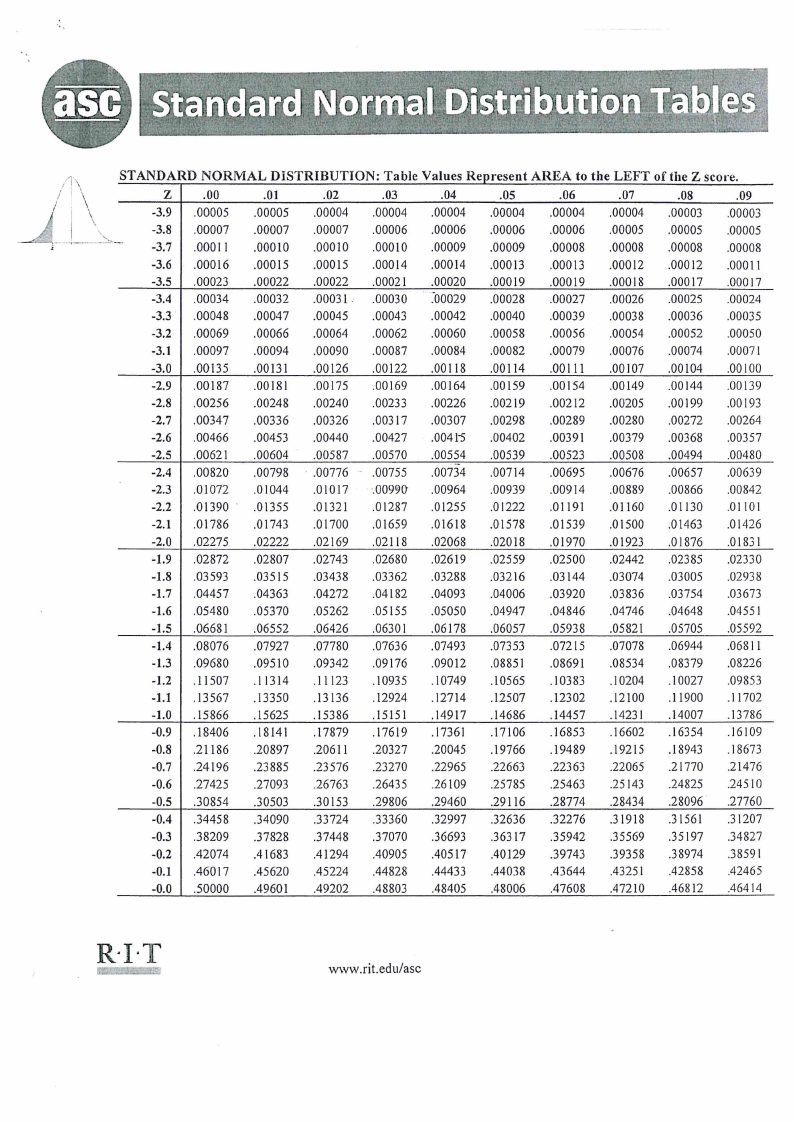
STANDARD NORMAL DISTRIBUTION: Table Values Represent
Z
00
-01
02
.03
04
05
-3.9 | .00005
.00005
.00004
.00004
.00004
00004
7
-3.8 | .00007
-00007
.00007
=.00006 =. .00006
~=—.00006
oe
-3.7 | .00011
00010
.00010
00010
.00009
.00009
-3.6 | .00016
.00015
00015
00014
00014
.00013
-3.5 | .00023
.00022
00022
_—.00021
00020
00019
-3.4 | .00034
00032
.00031. .00030
.00029
00028
-3.3/| .00048
.00047
.00045
00043
.00042
.00040
-3.2 | .00069
00066
.00064
.00062
.00060
00058
-3.1 | .00097
.00094
.00090
.00087 = .00084
.00082
-3.0 | .00135
00131
.00126
00122
_—.00118
00114
-2.9 | .00187
00181
00175
.00169
00164
00159
-2.8 | .00256
00248
.00240
.00233
00226
.00219
-2.7 | .00347
.00336
.00326
00317 = .00307
.00298
-2.6 | .00466
00453
.00440
00427 = .004 15
00402
-2.5 | .00621
.00604
00587
—_.00570 00554
00539
-2.4 | .00820
00798 — .00776
.00755
00734
00714
-2.3 | .01072
01044
01017 = .00990 = .00964
.00939
-2.2 | .01390 ° ~=.01355
01321
01287 = 01255
01222
-2.1 | .01786
.01743
01700 = =.01659 ~—s 01618
01578
-2.0 | .02275
02222
02169
02118
.02068
.02018
-1.9 | .02872
.02807
02743
.02680
02619
02559
-1.8 | .03593
03515
03438
03362
.03288
03216
-1.7 | .04457
.04363
04272
.04182 = .04093
04006
-1.6 | .05480
.05370
05262
05155
05050
04947
-1.5 | .06681
06552
06426
.06301
.06178
06057
-1.4 | .08076
07927
.07780
.07636
07493
07353
-1.3 | .09680
09510
09342
09176
.09012
08851
-1.2 | .11507
11314
«dd 123:
10935
.10749
10565
-1.1 | .13567
13350
13136
12924 — 12714
12507
-1.0 | .15866
15625
15386
15151
14917
14686
-0.9 | .18406
18141
17879
17619
.17361
.17106
-0.8 | .21186
.20897
20611
20327
~—-.20045
.19766
-0.7 | .24196
23885
.23576
23270 = .22965
.22663
-0.6 | .27425
.27093
.26763
26435
.26109
25785
-0.5 | .30854
30503
30153
29806
29460
29116
-0.4 | .34458
34090
33724
33360
32997
32636
-0.3 | .38209
37828
37448
37070
36693
36317
-0.2 | .42074
.41683
41294
40905
40517
40129
-0.1 | .46017
45620
45224
44828
44433
44038
-0.0 | .50000
49601
49202
_.48803
48405
48006
AREA to the LEFT
06
07
00004
.00004
.00006
.00005
.00008
00008
.00013
00012
.00019
.00018
.00027
.00026
.00039
00038
.00056
.00054
.00079
.00076
00111
.00107
00154
00149
00212
.00205
00289
00280
.00391
00379
00523
00508
.00695
.00676
00914
00889
01191
.01160
01539
01500
.01970
01923
02500
02442
.03144
03074
.03920
.03836
04846
.04746
05938
05821
07215
.07078
08691
08534
10383
10204
12302
.12100
14457
1423]
16853
.16602
19489
19215
.22363
.22065
25463
25143
28774
28434
32276
31918
35942
35569
39743
39358
43644
43251
47608
47210
of the Z score.
-08
.09
00003
.00003
00005
.00005
00008
.00008
.00012
00011
00017
——«.00017
00025
.00024
.00036
00035
.00052
.00050
.00074
.0007 1
00104
.00100
00144
.00139
00199
00193
.00272
.00264
.00368
.00357
00494
00480
00657
00639
.00866
00842
01130
01101
01463
01426
01876
01831
02385
02330
.03005
02938
.03754
.03673
04648
04551
05705
05592
06944
06811
.08379
08226
10027
09853
11900
.11702
14007
13786
16354
16109
18943
18673
.21770
.21476
24825
24510
.28096
.27760
31561
31207
35197
34827
38974
38591
42858
42465
_—.46812
46414
RIT
TES MEN SEE EES
SE LT
www.rit.edu/asc
|
|
8 Page 8 |
▲back to top |
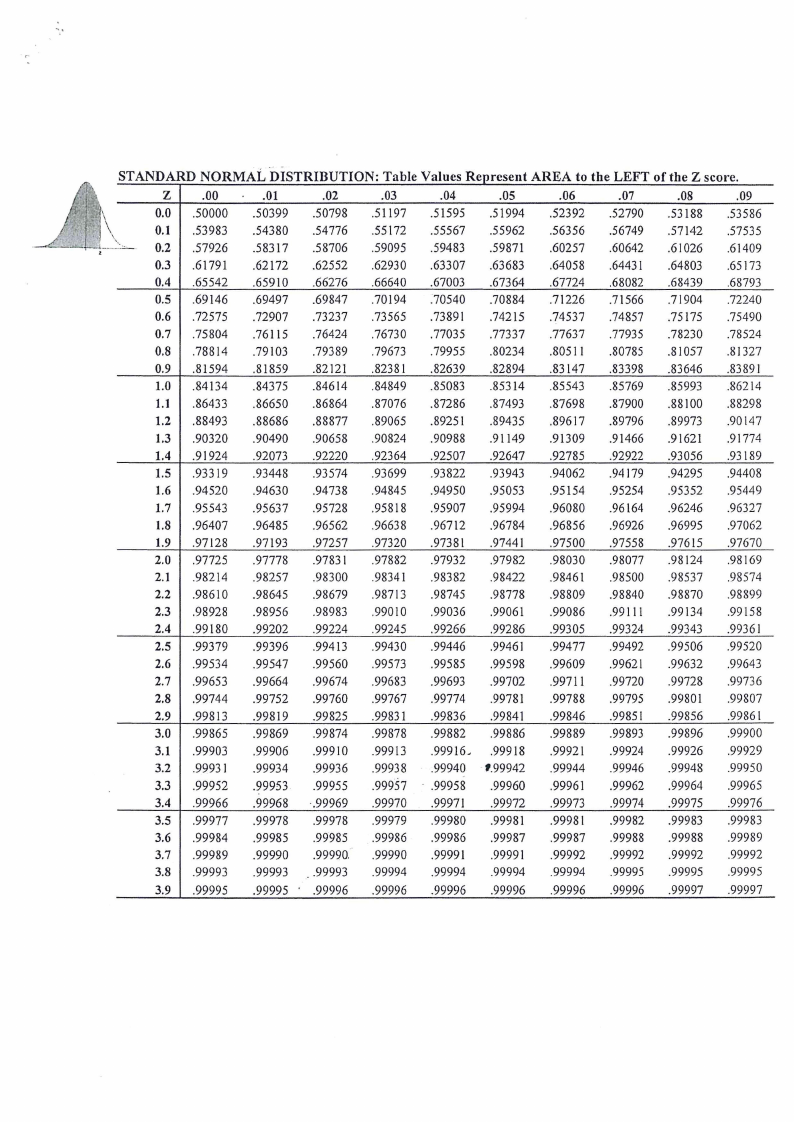
STANDARD NORMAL DISTRIBUTION: Table Values Represent AREA to the LEFT of the Z score.
Z
00
- 01
0.0 | .50000 50399
.02
50798
.03
51197
.04
51595
05
06
~—.51994. = .52392,
.07
.08
09
52790 ~— 53188 = 53586
0.1 53983
“s- 0.2 | .57926
0.3 | .61791
54380
=—-.58317.—s
62172
54776
«58706 =
.62552
55172
59095.
62930
.55567
55962
59483-59871
~=—.63307 ~— 63683
56356
60257
64058
56749
.60642
64431
57142
57535
.61026 61409
64803 = 65173
0.4 | .65542
0.5 | 69146
0.6 | .72575
.65910
.66276
-66640
69497 69847 .70194
= .72907 = 73237 Ss £73565
-67003
.70540
73891
.67364
.70884
74215
67724
.68082
.71226 .71566
74537-74857)
68439
.71904
£75175
.68793
.72240
~——.75490
0.7
.75804
76115
.76424
.76730
.77035
.77337
.77637
.77935
.78230
-78524
0.8 | .78814
0.9 | .81594
.79103
81859
.79389
82121
-79673
8238 |
.79955
82639
80234
_—.82894_
80511
~——.83147_
80785
~——.83398
.81057
.81327
~——.83646 ~——.83 891
1.0 | .84134
84375
84614
84849
85083
85314
85543
85769
85993
86214
1.1 | .86433
1.2 | .88493
.86650
88686
86864
88877
.87076
89065
.87286
89251
87493
89435
87698
89617
87900
89796
88100
89973
88298
90147
1.3 | .90320
.90490
.90658
90824
90988
91149
91309
91466
91621
91774
1.4 | .91924
92073
92220
92364
92507
92647
92785
92922
93056
93189
1.5 | .93319
1.6 | .94520
93448
94630
93574
.94738
93699
94845
93822
94950
93943
95053
94062
95154
94179
95254
94295
95352
94408
95449
1.7 | .95543
95637
95728
95818
95907
95994
.96080
96164
.96246
96327
1.8 | .96407
96485
96562
.96638
.96712
.96784
.96856
96926
96995
97062
1.9 | .97128
2.0 | .97725
97193
97778
97257
9783 |
97320
97882
97381
.97932
97441
97982
.97500
.98030
97558
98077
97615
98124
97670
98169
2.1 | .98214
2.2 | .98610
98257
98645
98300
98679
9834]
98713
98382
98745
98422
98778
98461
98809
98500
98840
98537
98870
98574
98899
2.3 | .98928
98956
98983
99010
99036
99061
.99086
99111
.99134
99158
2.4 | .99180
99202
99224
99245
99266
99286
99305
99324
99343
99361
2.5 | .99379
99396
99413
99430
99446
9946]
99477
99492
99506
99520
2.6 | .99534
99547
99560
99573
99585
99598
99609
99621
99632
99643
2.7 | .99653
99664
99674
.99683
99693
99702
99711
99720
99728
.99736
2.8 | .99744
2.9 | .99813
99752
99819
99760
99825
99767
99831
.99774
99836
99781
99841
.99788
99846
99795
99851
99801
99856
99807
99861
3.0 | .99865
99869
99874
.99878
99882
99886
99889
99893
99896
99900
3.1 | .99903
99906
99910 = .99913
99916. 99918
99921
99924
99926
99929
3.2 | .9993]
99934
99936 = .99938
99940 —-#.99942
99944
99946 = .99948
99950
3.3 | .99952
99953
99955
99957 ~ 99958
99960
9996]
99962
=—.99964
99965
3.4 | .99966
99968
_-.99969_
«99970
_—«.9997]
99972
99973
99974
_.99975
99976
3.5 |
3.6 |
3.7 |
3.8 |
.99977
.99984
.99989
.99993
99978
99985
99990
99993
99978
99985
99990.
—_ 99993
99979
99986
.99990
99994
99980
99986
9999]
99994
9998]
99987
9999 |
99994
99981
99987
99992
99994
99982 = .99983
99988
99988
99992
99992
99995
99995
99983
99989
99992
99995
3.9 | .99995
99995 * .99996
99996
99996
99996
99996
99996
99997
99997